
R. M. O. Santos1; S. Cronemberger1; H. M. Vieira Filho2; N. Calixto1
DOI: 10.1590/S0004-27491999000600013
ABSTRACT
Purpose: To show the results of a comparative study between dynamic and normal strategies with Octopus 1-2-3. Methods: Automatic perimetry using the Octopus 1-2-3 with dynamic and normal strategies was performed on 24 glaucomatous patients (eight males and 16 females) within an average interval of six months between the two exams. All patients had previously submitted to at least one automatic perimetry with the Octopus 1-2-3. The data compared, for both eyes, were: the patient's age, number of questions, mean sensitivity (MS), mean defect (MD), loss variance (LV), short-term fluctuation (SF) and the reliability factor (RF). In the statistical analyses through the paired t test, only the visual fields with RF less than 10 were included. The level of significance was equal to 5% (p < 0.05). Results: There was no statistically significant difference between the two strategies in relation to age, LV, SF and RF. However, there was statistically significant differences in the duration of the test, number of questions, MS and MD. The dynamic strategy showed a higher diffuse sensitivity and a lower mean defect than the normal strategy. Conclusions: Our results show that the threshold values measured by the dynamic strategy were in close agreement with the values obtained using the normal strategy in patients who have, or are suspected of having, glaucoma and whose visual fields are normal or borderline. They also confirm the claimed reduction in testing time. These results also suggest that, when comparing a visual field exam performed with the dynamic strategy to one performed with a normal strategy, it is necessary to be cautious in regard to MS and MD values.
Keywords: Automated perimetry; Glaucoma; Octopus 1-2-3
RESUMO
Objetivo: Analisar os resultados de um estudo comparativo entre as estratégias dinâmica e normal utilizando o perí-metro Octopus 1-2-3. Métodos: Utilizando o Octopus 1-2-3 nas estratégias dinâmica e normal foi realizada a perimetria automatizada em 24 pacientes glaucomatosos (8 homens e 16 mulheres) com uma média de intervalo entre os 2 exames de 6 meses. Todos pacientes já haviam sido previamente submetidos a pelo menos um exame de perimetria automatizada no Octopus 1-2-3. Os dados comparados, para ambos os olhos, foram: a idade do paciente, número de estímulos, sensibilidade média (MS), defeito médio (MD), perda localizada (LV), flutuação em curto prazo (SF) e o fator de confiabilidade (RF). Na análise estatística, utilizando o teste t pareado, somente os campos visuais com RF menor que 10 foram incluídos. O nível de significância foi igual a 5% (p < 0,05). Resultados: Não houve diferença estatisticamente significativa entre as duas estratégias em relação à idade, LV, SF e RF. Entretanto, houve diferença estatisticamente significativa na duração do teste, número de estímulos, MS e MD. A estratégia dinâmica mostrou uma sensibilidade difusa maior e um menor defeito médio quando comparada à estratégia normal. Conclusões: Nossos resultados indicam que os valores dos limiares medidos pela estratégia dinâmica estão em concordância com os valores obtidos utilizando a estratégia normal nos pacientes portadores ou suspeitos de glaucoma, cujos campos visuais estão normais ou limítrofes. Estes resultados também confirmam a redução na duração do exame. Também sugerem que, quando compararmos campos visuais realizados com a estratégia dinâmica com aqueles realizados com a estratégia normal, é necessária cautela em relação aos valores do MS e MD.
Descritores: Perimetria automatizada; Glaucoma; Octopus 1-2-3
PURPOSE
Automated perimetry was introduced fifteen years ago, and has become one of first choices for the diagnosis and follow-up in the treatment of glaucoma 1. However, it presents some problems, especially fatigue during the exam.
Previous publications on this subject report a reduction in contrast sensitivity and higher fluctuations in the results with increasing test duration in glaucomatous patients, when compared to normal persons 2, 3. These fluctuations, when attributed to fatigue 4, compromise the accuracy and reproducibility of visual field results.
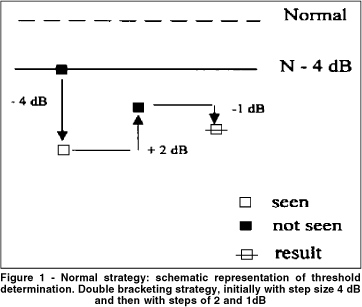
Therefore, new strategies have been developed which aim to reduce the duration of the exam. The dynamic strategy is a perimetric measurement procedure whereby the luminance-step sizes are optimized according to physiological data. In contrast to the traditional 4- to 2-dB strategy ( Figure 1), the step sizes are not constant, but rather, vary between 2 and 10 dB depending on the sensitivity 5. The question is to determine if this reduction in the duration of the exam changes the reliability of the results.

The aim of this study was to determine how the dynamic strategy compares to the normal strategy in evaluating patients with glaucoma.
SUBJECTS AND METHODS
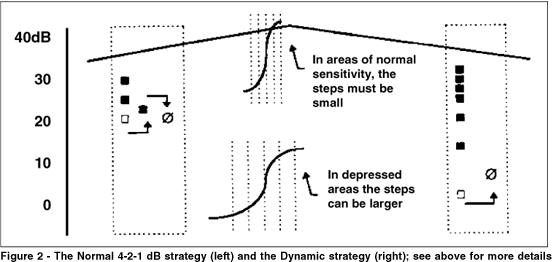
With the dynamic strategy, the step sizes are adapted to the physiological threshold zone and vary, therefore, with the absolute level of the sensitivity. In other words, the staircasing procedure involves steps between 2 dB (near normal values) and 10 dB (toward the lowest sensitivity levels) as shown in figure 2. The final measured value is calculated as the midpoint between the last two stimuli, after a change of direction. The procedure allows one to retest all locations in a second phase 6.

Using the Octopus 1-2-3, with dynamic and normal strategies, 96 visual fields were selected retrospectively, from both eyes of 24 patients who have, or are suspected of having, glaucoma (8 men and 16 women).There was an average interval of 6 months between the two exams. All patients had previously submitted to at least one automated perimetry with the Octopus 1-2-3, with the same technician. The criteria for inclusion were: RF less than 10 and both phases and all eight stages had been performed (59 test locations). The mean refractive error (spherical equivalent) for the right eye was + 0.25 and - 0.10 diopters and for the left eye, +0.34 and +0.14 diopters with dynamic and normal strategies respectively. The mean age of the patients at the time of the exams was 43.5 ± 14.2 years (14 to 70 years; median, 43.5 years) and 42.8 ± 14.0 years (14 to 69 years; median, 42.5 years) for the dynamic and normal strategies, respectively. The parameters studied for both eyes were: number of stimuli presented, mean sensitivity (MS), mean defect (MD), loss variance (LV), short term fluctuation (SF) and the reliability factor (RF).
The statistical analyses were calculated by the paired t test. The level of significance was 5% (p < 0.05).
RESULTS
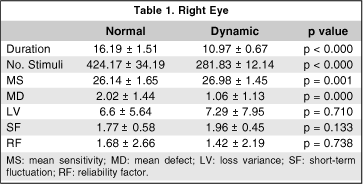
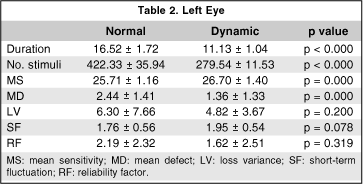
The results for the right and left eyes were analyzed separately ( Tables 1, 2).


As shown below, our sample presents, for the normal strategy, patients with a borderline mean defect (MD equal to 2.02 ± 1.44 and 2.44 ± 1,41 dB for RE and LE respectively), and a slight local loss (LV equal to 6.6±5.64 and 6.30 ± 7.66 dB 2 for RE and LE respectively).
The data for both eyes showed a significant reduction in the time of the exam: 5.2 min. for the right eye (32.3% less) and 5.4 min. for the left eye (32.6% less). There were no statistically significant differences in the studied parameters, except for the mean sensitivity (MS) and the mean defect (MD) for both eyes.
The dynamic strategy showed a greater value for mean sensitivity (MS) than the normal strategy for both eyes: 0.84 dB for the right and 0.99 dB for the left (p < 0.0001). The dynamic strategy overestimated the MS in both eyes.
In contrast, as one would expect, the mean defect (MD) with the dynamic strategy was lower than with the normal strategy. The differences were 0.96 dB for the right eye and 1.08 dB for the left (p < 0.0001).
DISCUSSION
An appropriate execution of the visual field requires the best possible conditions. Fatigue and the duration of the exam are well known factors which cause fluctuations in the results and, therefore, hamper their interpretation and reproducibility 4.
The fatigue effect, whereby sensitivity decreases as the examination progresses, has been demonstrated in normal subjects and in subjects with ocular hypertension, glaucoma and optic neuropathy 4.
The strategies which attempt to reduce the duration of the test utilize, either a reduction in the area analyzed (program 24/2, Humphrey), a division of the exam into phases and stages (Octopus), the staircasing procedures, which make use of only a single reversal of the patient's answers (Dynamic, Octopus and FAST-PAC, Humphrey) or artificial intelligence as in the new techniques (SITA, Humphrey and TOP, Octopus).
The studies which compared both dynamic and normal strategies examined only 16 test locations (phase 1, stage 1) 5, 7. In this paper we examine all 59 test locations twice, i.e. all patients completed both phases and all 8 stages, using both strategies.
Weber describes, by utilizing the dynamic strategy, a reduction in the duration of the exam from 40 to 50% in very depressed visual fields and 30 to 40% in areas with normal sensitivity 5. In this study, the reduction of the duration of the exam was 32.2% for the RE and 32.6% for the LE. These indices were compared to the reduction of the number of stimuli presented.
According to Hudson, an increase in the MD could be due to fatigue caused by an increase in the duration of the exam 4. This could explain, in this study, the significant reduction of MD using the dynamic strategy for both eyes and the proportional increase of MS (p < 0.000 BE).
In this study the short-term fluctuation (SF) did not significantly differ between the two strategies (RE: p = 0.133 and LE: p = 0.078). This agreement could be explained by the particular sample analyzed: visual fields showing, on average, borderline mean defect and slight local loss. In these cases, the dynamic strategy utilizes steps equal to or even lower than the normal strategy, which means that the difference is in the number of reverse answers given by the patients. This finding agrees with Weber: the result of normal or borderline visual fields by the dynamic strategy show even greater reproducibility than with the normal strategy 5.
Our results show that the threshold values measured by the dynamic strategy were in close agreement with the values obtained using the normal strategy in patients who have, or are suspected of having, glaucoma and whose visual fields are normal or borderline. They also confirm the claimed reduction in testing time 5. These results also suggest that, when comparing a visual field exam performed with the dynamic strategy to one performed with a normal strategy, it is necessary to be cautious in regard to MS and MD values.
REFERENCES
1. Lachkar Y, Barraut O, LeFrançois A, Demailly P. Stratégie rapide <<TOP>> en périmétrie automatisée Octopus. J Fr Ophtalmol 1998;21(3):180-4.
2. Heijl A. Time changes of contrast thresholds during automatic perimetry. Acta Ophthalmol 1977;55:696-708.
3. Flammer J, Niesel P. Reproducibility of perimetric study results. Klin Monatsbl Augenheilkd 1984;184:374-6. In German.
4. Hudson C, Wild JM, O'Neill EC. Fatigue effects during a single session of automated static threshold perimetry. Invest Ophthalmol Vis Sci 1994;35:268-80.
5. Weber J, Klimaschka T. Test time and efficiency of the diynamic strategy in glaucoma perimetry. Ger J Ophthalmol 1995;4(1):25-31.
6. The Octopus Examination Software. In: Octopus Visual Field Digest. Schlieren: Interzeag AG; 01/96:22-31.
7. Zulauf M, Fehlmann P, Flammer J. Perimetry with normal Octopus technique and Weber "dynamic" technique. Initial results with reference to reproducibility of measurements in glaucoma patients. Ophthalmologe 1996;93:420-7.
Thanks to Neide Natalia Rios Leão and Sofia Marques de Sousa Safe (technicians).
Trabalho realizado no Serviço de Glaucoma do Hospital São Geraldo, Hospital das Clínicas da UFMG
e no CDA: Centro de Diagnóstico Avançado em Oftalmologia.
(
1) Doutorando em Oftalmologia da Faculdade de Medicina da UFMG. Estagiário do Serviço de
Glaucoma do Hospital São Geraldo. Assistente voluntário da Unidade de Córnea da Clínica de
Olhos da Santa Casa de Misericordia de Belo Horizonte.
(
2) Professor Titular da Faculdade de Medicina da Universidade Federal de Minas Gerais.
(
3) Médico estagiário do Serviço de Glaucoma do Hospital São Geraldo.
Presented at ARVO Annual Meeting. Fort Lauderdale, Florida USA. May 9-14, 1999.
The authors have no proprietary interest in the development or marketing of the instruments or medications referred
to in the text.
Address for correspondence: Roberto Marcio de Oliveira Santos. R. Carlos Gomes, 83/301. Belo Horizonte (MG). CEP 30350-130.