Arq. Bras. Oftalmol. 2026; 89 (2): 10.5935/0004-2749.2025-0230
Total: 944
Meryem Altin Ekin
DOI: 10.5935/0004-2749.2025-0230
ABSTRACT
PURPOSE: To evaluate whether specific meibomian gland morphological features can serve as diagnostic indicators of dry eye disease in patients with type 2 diabetes mellitus.
METHODS: This cross-sectional study included patients with type 2 diabetes mellitus and age-matched healthy controls. All participants underwent a comprehensive ocular surface evaluation, including the ocular surface disease index, tear break-up time, Schirmer’s I test, corneal staining, eyelid margin scoring, meibum expressibility assessment, meibography scoring, and evaluation of meibomian gland loss area. Meibomian gland morphology was assessed bilaterally. Dry eye severity was determined based on ocular surface disease index scores, tear break-up time, Schirmer’s test results, and corneal staining scores. Correlations between meibomian gland features and ocular surface parameters, age, diabetes duration, and hemoglobin A1c levels were analyzed. Receiver operating characteristic analysis was performed to determine the diagnostic value of specific meibomian gland features for dry eye disease.
RESULTS: Dry eye disease was diagnosed in 56.6% of patients with diabetes and 22.6% of controls. Compared with controls, patients with diabetes had significantly higher ocular surface disease index scores, greater corneal staining, worse meibum expressibility, increased meibomian gland loss, and lower tear break-up time and Schirmer values (all p<0.05). Meibomian gland dropout, shortening, tortuosity, distortion, overlapping, ghost glands, and lack of extension to the lid margin were significantly more prevalent in patients with diabetes (p<0.05) and showed significant correlations with age, HbA1c levels, and diabetes mellitus duration. Receiver operating characteristic analysis identified meibomian gland dropout, ghost glands, shortening, and lack of extension to the lid margin as the most predictive morphological features for dry eye disease in patients with diabetes.
CONCLUSION: Type 2 diabetes mellitus is associated with distinct meibomian gland morphological alterations that correlate with both dry eye disease severity and systemic diabetic parameters, suggesting potential diagnostic value.
Keywords: Diabetes mellitus; dry eye syndromes/diagnosis; Meibomian glands/diagnostic imaging; Meibomian gland dysfunction; type 2/complications
INTRODUCTION
Type 2 diabetes mellitus (DM) is a prevalent chronic metabolic disorder associated with various ocular complications, including diabetic retinopathy, cataract, and keratopathy(1,2). In addition to these well-recognized manifestations, type 2 DM can adversely affect the ocular surface and tear film. Chronic hyperglycemia and metabolic dysregulation impair tear film stability, increase tear osmolarity, and damage the ocular surface epithelium, contributing to dry eye disease (DED). Despite its impact on visual function and quality of life, DED remains underrecognized in patients with diabetes(3).
Meibomian glands, located within the eyelids, play a crucial role in maintaining tear film stability by secreting lipids that reduce tear evaporation(4). Meibomian gland dysfunction, caused by reduced secretion or gland obstruction, is a major contributor to evaporative DED(4). Meibography is commonly used to evaluate gland morphology in conjunction with clinical assessment of meibum expressibility and quality. The Dry Eye Assessment and Management (DREAM) study defined standardized meibomian gland morphological features, with nearly 40% of participating centers performing meibography, enabling systematic evaluation of glandular changes in relation to DED signs and symptoms(5).
Recent evidence suggests that structural abnormalities of the meibomian glands, rather than functional impairment alone, may contribute to the pathogenesis of DED(6,7). Parameters such as gland thickness, spacing, and shortening have been associated with tear osmolarity and dry eye severity(6,7). However, to date, no study has comprehensively evaluated the relationship between type 2 DM and DED using a standardized grading system for meibomian gland morphology.
Therefore, this study aimed to investigate the association between type 2 DM and DED by analyzing meibomian gland morphological characteristics using a standardized grading approach.
METHODS
This cross-sectional study was conducted at the Department of Ophthalmology, Dokuz Eylul University Hospital. Patients with type 2 DM and age- and sex-matched healthy controls were enrolled. The diagnosis of DM was confirmed by an endocrinologist according to the American Diabetes Association criteria, including fasting plasma glucose ≥126 mg/dL (7.0 mmol/L), 2-h plasma glucose ≥200 mg/dL (11.1 mmol/L) during a 75-g oral glucose tolerance test, HbA1c ≥6.5% (48 mmol/mol), or random plasma glucose ≥200 mg/dL (11.1 mmol/L in the presence of classic hyperglycemic symptoms)(8).
Exclusion criteria included the presence of other systemic diseases, corneal or retinal pathologies, previous intraocular surgery, eyelid malpositions, contact lens use, glaucoma, smoking, or use of topical ocular medications or systemic medications (other than antidiabetic drugs) known to affect tear film stability or meibomian gland function, such as diuretics, antihistamines, antidepressants, isotretinoin, or hormonal therapies.
The study adhered to the tenets of the Declaration of Helsinki and was approved by the Institutional Ethics Review Board of Izmir Katip Celebi University Ataturk Training and Research Hospital (Approval No. 24.03.2022/150). Written informed consent was obtained from all participants.
Demographic and clinical data, including age, sex, body mass index (BMI), duration of DM, and HbA1c levels, were recorded. All participants completed the OSDI questionnaire and underwent a standardized ophthalmic examination by a single examiner in the following order: Schirmer’s I test, tear break-up time (TBUT) measurement, corneal staining assessment, eyelid margin evaluation, meibomian gland expression, and meibography. All examinations were performed during a single visit, and only data from the right eye were included in the analysis.
The OSDI is a validated 12-item questionnaire assessing dry eye symptoms over the preceding week across three domains: ocular symptoms, vision-related function, and environmental triggers. Each item is scored on a 0-4 scale. The total score was calculated using the standard formula, yielding a score ranging from 0 to 100, with higher scores indicating greater symptom severity(9). Scores were categorized as normal (0-12), mild (13-22), moderate (23-32), or severe (≥33) DED(9,10).
Schirmer’s I test was performed without topical anesthesia to evaluate basal and reflex tear secretion. A standardized filter paper strip was placed in the lateral third of the lower eyelid fornix for 5 min, after which the wetting length was measured in millimeters. Values ≤5 mm indicated severe tear deficiency, and values ≤10 mm were considered abnormal(11).
TBUT was measured after the instillation of a single drop of 2% fluorescein sodium. The interval between the last complete blink and the first appearance of a dry spot was recorded three times, and the mean value was used for analysis(12). Corneal staining was evaluated 2-4 min after fluorescein instillation using the Oxford grading scheme(13,14).
Eyelid margin abnormalities were graded on a 0-4 scale for each parameter, with a total possible score of 16 per eye(15). Meibomian gland expression was graded from 0 to 3 based on the quality and ease of meibum secretion(15). Meibomian gland dropout was assessed using infrared meibography with the Keratograph 5M, and meiboscores were calculated for each eyelid and summed per eye(16).
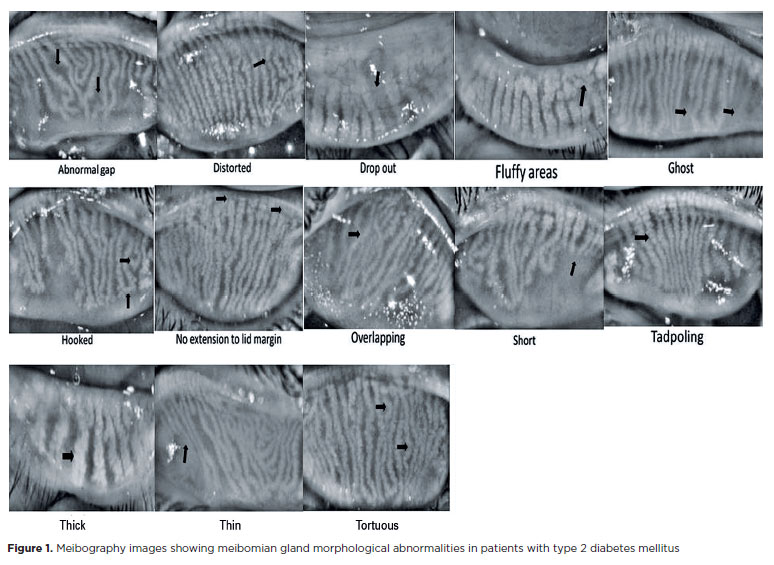
Meibomian gland morphological features were evaluated according to the DREAM study criteria(5), including distorted, tortuous, hooked, dropout, shortened, thickened, thinned, overlapping, ghost glands, tadpoling, abnormal gaps, fluffy areas, and lack of extension to the lid margin (Figure 1). Quantifiable features were scored on a 0-10 scale per eyelid, and a composite morphological score was calculated by summing all quantified features.
DED was diagnosed based on the DEWS II criteria, defined as an OSDI score ≥13 in combination with at least one abnormal objective test (TBUT <10 s, Schirmer’s ≤5 mm, or positive corneal staining)(17). Patients with diabetes were further stratified into DED- positive and DED-negative subgroups.
Statistical analyses were performed using SPSS version 25. Categorical variables were expressed as frequencies and percentages, and continuous variables as means ± standard deviation. Group comparisons were conducted using ANOVA with Tukey’s post hoc test, and categorical variables were compared using the chi-square test. Pearson’s correlation analysis was used to assess associations between variables. A p-value <0.05 was considered statistically significant. Post hoc power analysis using G*Power (version 3.1.9.2) confirmed a statistical power greater than 80% at an α level of 0.05.
RESULTS
The study included 212 participants: 106 patients with type 2 DM (60 DED-positive [56.6%] and 46 DED-negative [43.4%]) and 106 age- and sex-matched healthy controls. Within the control group, 24 individuals (22.6%) were diagnosed with DED. Demographic characteristics and ocular surface parameters of the study groups are summarized in Table 1. Both diabetic subgroups exhibited significantly higher OSDI scores and significantly worse TBUT and Schirmer’s I test results compared with controls (p<0.001), with the most pronounced impairment observed in the DED-positive subgroup. Corneal staining area and density were significantly increased in the DED-positive group compared with the DED-negative group and controls (p=0.002 and p=0.032, respectively). Eyelid margin abnormalities and meibomian gland dysfunction were significantly more severe in patients with diabetes than in controls (p<0.001), particularly among DED-positive patients. Meibography scores and the extent of meibomian gland loss were also significantly higher in diabetic patients, with the greatest gland loss observed in the DED-positive subgroup (p<0.001).
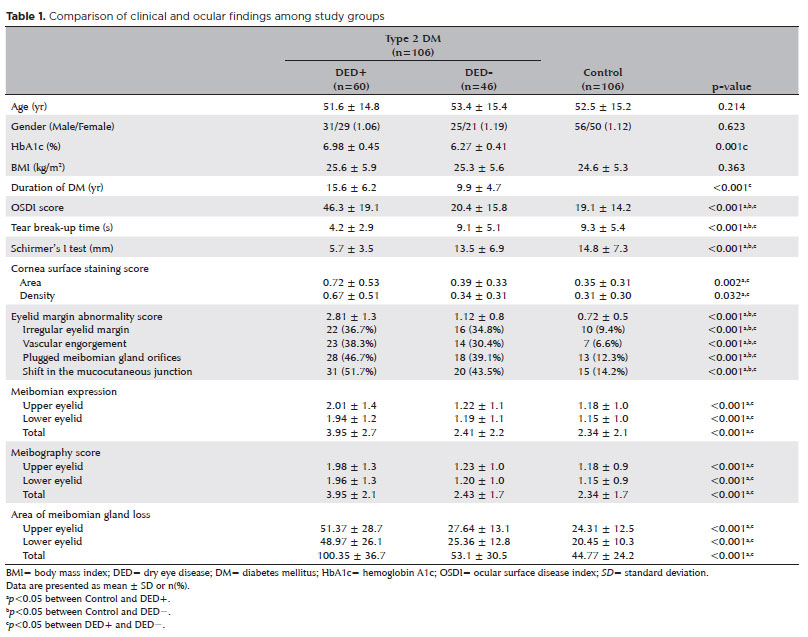
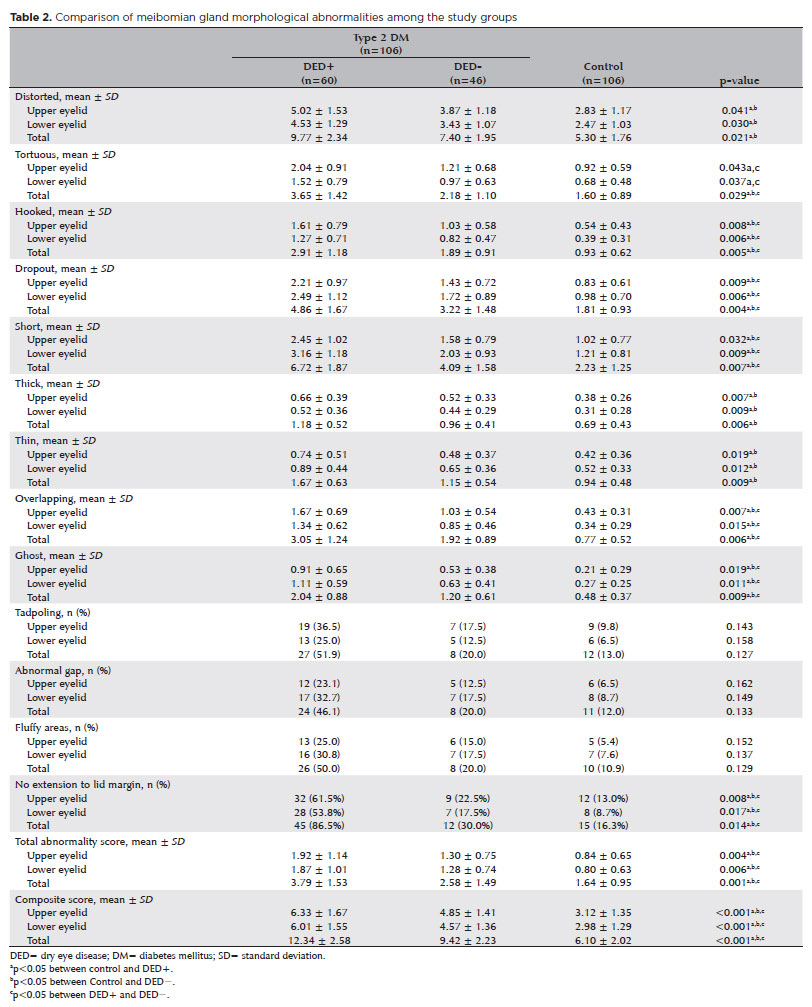
Table 2 presents the distribution of meibomian gland morphological abnormalities in the upper and lower eyelids across the study groups. Patients with diabetes demonstrated significantly higher frequencies of distorted, tortuous, hooked, dropout, short, thick, thin, overlapping, ghost-type glands, and lack of extension to the lid margin compared with healthy controls in the upper, lower, and total eyelids (all p<0.05). The DED-positive diabetic group exhibited significantly higher rates of hooked, dropout, short, overlapping, ghost-type glands, and lack of extension to the lid margin than the DED-negative diabetic group across all eyelid regions (upper, lower, and total; all p<0.05). Mean total scores for morphological abnormalities were significantly higher in diabetic patients than in controls for all eyelid regions (upper: p=0.004; lower: p=0.006; total: p=0.001), with the highest values observed in the DED-positive subgroup. Composite scores demonstrated a similar stepwise increase from controls to DED-negative patients and reached their highest levels in the DED-positive group (all p<0.001).
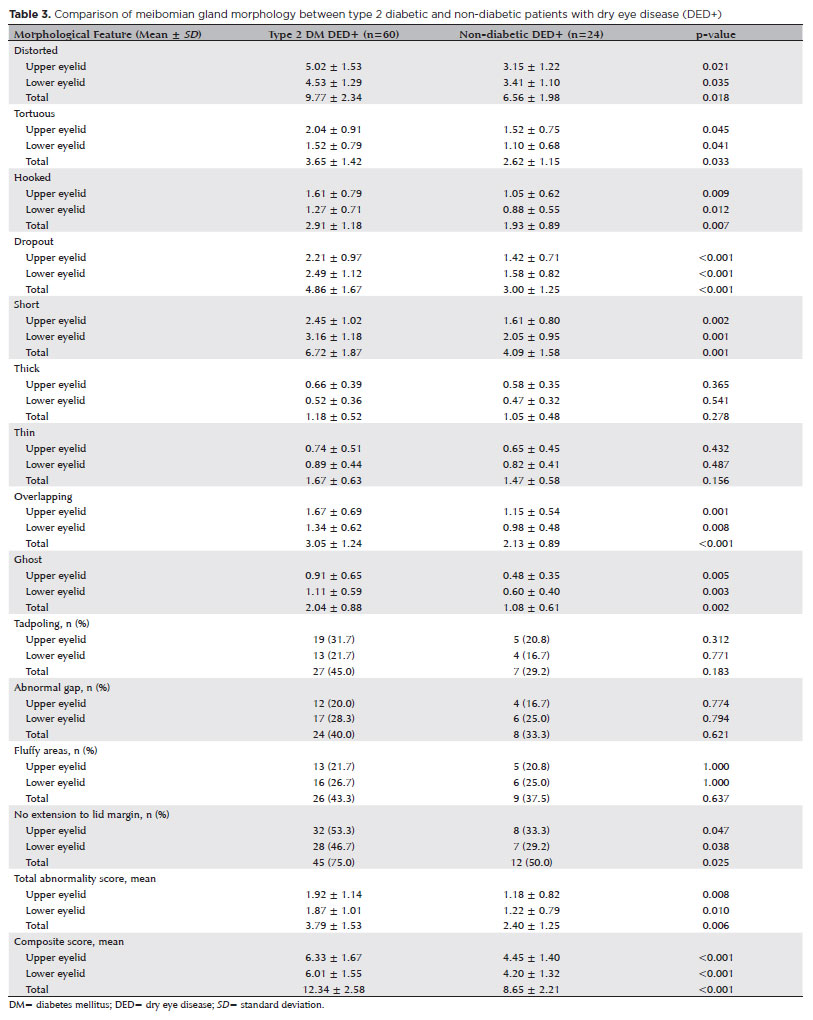
To specifically assess the impact of diabetes on meibomian gland morphology, a comparative analysis was conducted between diabetic patients with DED and non-diabetic individuals with DED (Table 3). Diabetic DED-positive patients exhibited significantly more severe morphological alterations across multiple parameters. Markers of gland atrophy and loss—including gland dropout (total: 4.86 ± 1.67 vs. 3.00 ± 1.25, p<0.001), gland shortening (total: 6.72 ± 1.87 vs. 4.09 ± 1.58, p=0.001), and ghost glands (total: 2.04 ± 0.88 vs. 1.08 ± 0.61, p=0.002)—were significantly more prevalent in the diabetic group. Structural abnormalities, such as hooked (p=0.007), tortuous (p=0.033), and overlapping glands (p<0.001), were also more common among diabetic patients. Both the total mean abnormality score (3.79 ± 1.53 vs. 2.40 ± 1.25, p=0.006) and the composite score (12.34 ± 2.58 vs. 8.65 ± 2.21, p<0.001) were significantly higher in diabetic DED-positive patients, indicating a greater overall morphological burden. In contrast, gland thickening, thinning, tadpoling, abnormal gaps, and fluffy areas did not differ significantly between groups (all p>0.05), suggesting that these features may be more closely related to DED itself rather than diabetes-specific effects.
As shown in Table 4, tortuous, hooked, dropout, short, overlapping, and ghost-type glands demonstrated strong positive correlations with OSDI scores (r=0.745-0.855, all p<0.001) and significant negative correlations with TBUT and Schirmer’s I test results (r=−0.640 to −0.840, all p<0.01) across the upper, lower, and total eyelids. These morphological abnormalities were also significantly associated with increased corneal staining severity, greater eyelid margin abnormalities, impaired meibomian gland expression, higher meibography scores, and increased gland loss (r=0.698-0.860, all p<0.01). Total mean and composite abnormality scores followed similar patterns, correlating strongly with both symptom severity and objective ocular surface findings (r=0.715-0.812, all p<0.01). In contrast, distorted, thickened, and thinned gland types demonstrated weaker and inconsistent associations with clinical parameters (p>0.05).
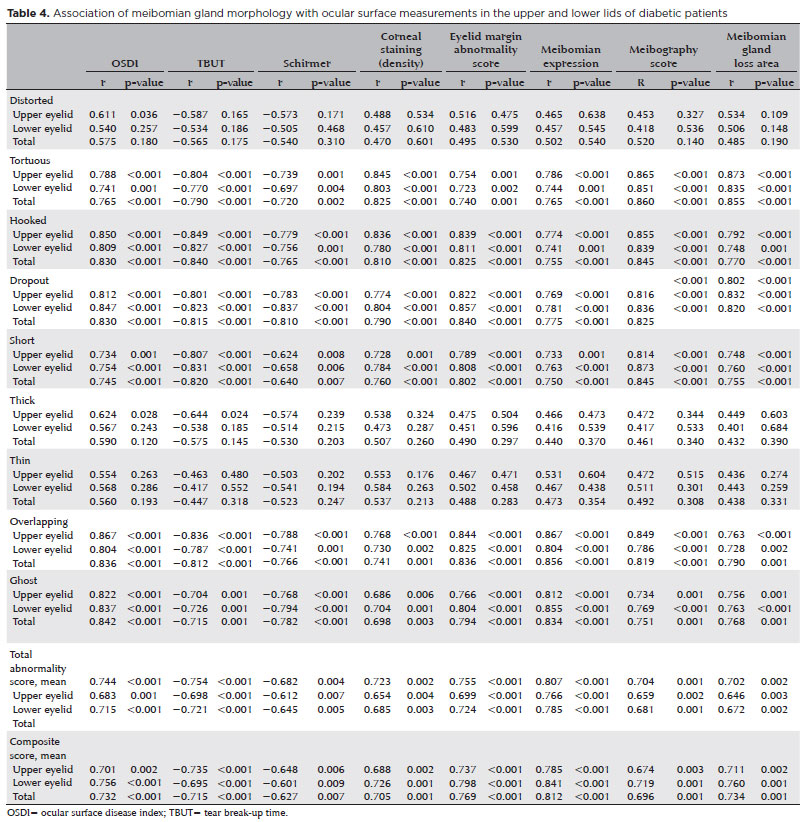
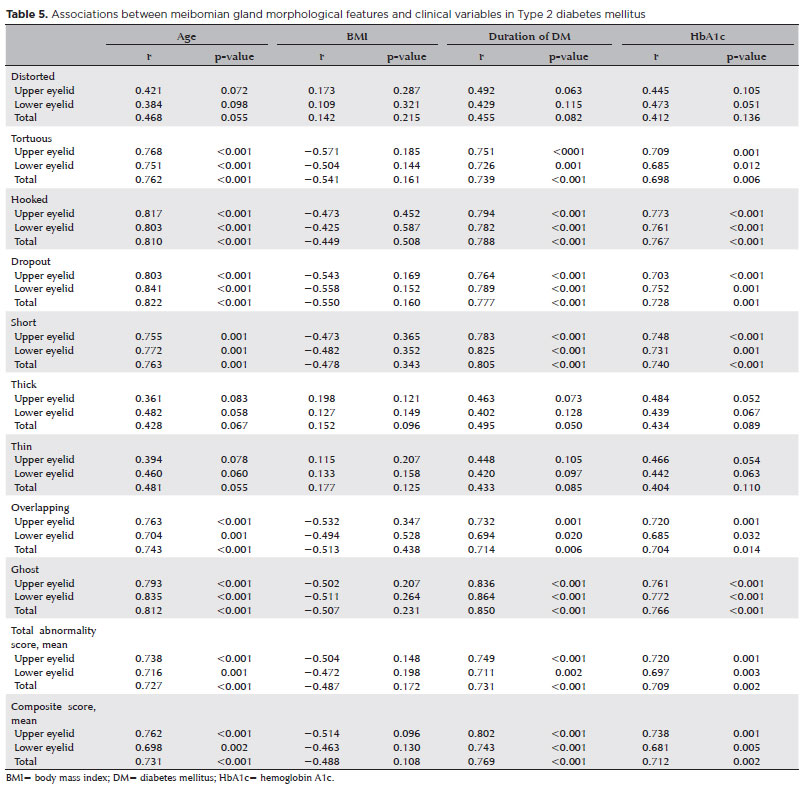
Table 5 provides a detailed overview of correlations between meibomian gland morphology and systemic diabetic parameters. Several morphological abnormalities—including tortuous, hooked, dropout, short, overlapping, and ghost glands—were significantly and positively correlated with older age (r=0.704-0.835, all p<0.001), longer duration of DM (r=0.698-0.850, all p<0.01), and higher HbA1c levels (r=0.698-0.767, all p<0.01). These associations were consistent across both upper and lower eyelids. Total mean and composite abnormality scores also showed strong correlations with age, DM duration, and HbA1c levels (r=0.727-0.769, all p<0.01).
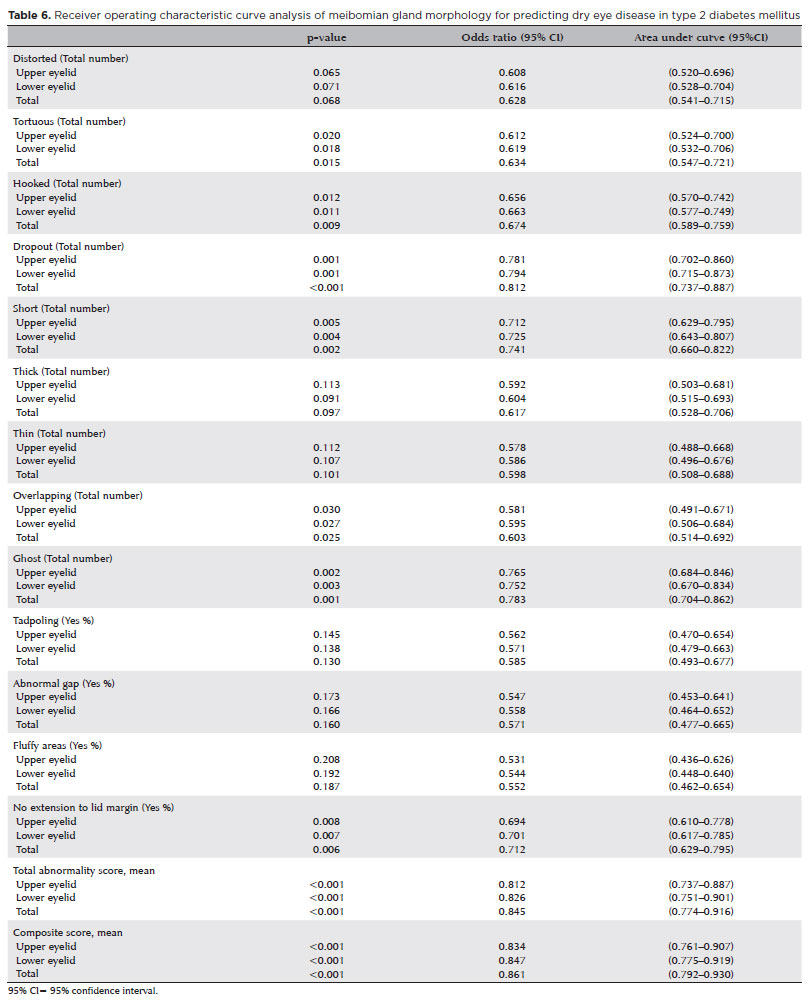
ROC curve analysis (Table 6) demonstrated that gland dropout, ghost-type glands, gland shortening, and lack of extension to the lid margin were significant predictors of DED in patients with diabetes, with AUC values ranging from 0.712 to 0.812 (all p<0.01). The total mean abnormality scores showed strong diagnostic performance, with AUCs of 0.812 for the upper eyelid, 0.826 for the lower eyelid, and 0.845 for the total eyelids. Composite scores exhibited similarly robust performance, with AUCs of 0.834, 0.847, and 0.861 for the upper, lower, and total eyelids, respectively (all p<0.001). Optimal cut-off values for the total mean score (≥1.35 for the upper eyelid, ≥1.30 for the lower eyelid, and ≥2.65 for the total score) yielded sensitivities of approximately 82.5%, 80.7%, and 85.6%, with corresponding specificities of 75.4%, 73.9%, and 78.7%. For the composite score, cut-off values of ≥4 for both the upper and lower eyelids and ≥10 for the total score produced sensitivities of 78.8%, 76.9%, and 84.6% and specificities of 72.5%, 70.3%, and 77.1%, respectively.
DISCUSSION
The present study provides novel insights into structural alterations of the meibomian glands in patients with type 2 DM and their association with DED. Our findings demonstrate that individuals with diabetes not only have a higher prevalence of DED but also exhibit distinct meibomian gland morphological changes that correlate with disease severity. Moreover, several of these morphological features appear to be reliable predictors of DED in patients with type 2 DM.
In this study, the prevalence of DED among patients with type 2 DM was 56.6%, which was substantially higher than the 22.6% observed in the age- and sex-matched control group. Diabetic patients showed significantly higher OSDI scores, more pronounced corneal staining, greater eyelid margin abnormalities, and reduced Schirmer’s I test and TBUT values. Although these findings strongly support an association between type 2 DM and DED, the literature reports heterogeneous results(18-23). For example, Bashorun et al.(18) reported a higher proportion of severe dry eye symptoms in non-diabetic individuals, which the authors attributed in part to potential selection bias. Weng et al. suggested that short-term hyperglycemic injury may be driven by acute hemodynamic changes rather than chronic metabolic pathways in experimental models; however, they emphasized that both long-term glycemic control and short-term hyperglycemia management are clinically relevant for preventing ocular surface damage in diabetes(19). In contrast, multiple clinical studies corroborate our findings. Sahu et al.(20) reported abnormal TBUT and Schirmer’s test results in 54.6% and 55.7% of diabetic patients, respectively. Baek et al. demonstrated quantitative reductions in tear meniscus parameters that worsened with retinopathy severity, while Ozdemir et al. confirmed significant tear film instability in diabetes (21,22). More recently, Mangoli et al.(23) reported a higher prevalence of moderate DED in diabetic patients and a positive correlation between DED severity and retinopathy grade. Together, these data support type 2 DM as a significant risk factor for the development of DED.
Meibomian gland dysfunction plays a central role in the pathogenesis of DED in patients with type 2 DM(24). The meibomian glands are the primary source of the tear film lipid layer, which is essential for limiting evaporation and maintaining ocular surface homeostasis. However, distinguishing pathological morphological features from changes that may be incidental or age-related remains challenging. In the present study, nearly all meibomian gland morphological abnormalities—except tadpoling, fluffy areas, and abnormal gaps—were significantly more prevalent in patients with diabetes than in controls. Structural changes such as gland dropout, shortening, ghost glands, lack of extension to the lid margin, overlapping, tortuosity, and hooked configurations were strongly associated with DED and correlated with worse objective clinical measures, including lower Schirmer’s values, reduced TBUT, and increased corneal staining. These findings indicate substantial glandular dysfunction, likely resulting in compromised lipid secretion and increased tear evaporation.
Importantly, these morphological alterations showed significant positive correlations with DM duration and HbA1c levels, suggesting that prolonged exposure to poorly controlled hyperglycemia accelerates meibomian gland degeneration and contributes to DED pathogenesis. By contrast, features such as tadpoling, fluffy areas, and abnormal interglandular gaps were not significantly associated with diabetes. This observation is consistent with findings from the DREAM study, which concluded that although these features are morphologically distinct, their diagnostic and prognostic utility is limited(5). Other alterations, including gland thickening, thinning, and distortion, were more frequently observed in diabetic patients, but their clinical significance remains uncertain, as current evidence does not demonstrate a consistent relationship with dry eye severity(5). Overall, the combination of impaired meibomian gland expressibility, elevated meibography scores, and increased prevalence of specific morphological abnormalities supports the concept that type 2 DM is associated with both functional impairment and characteristic structural changes of the meibomian glands.
Our findings also align with and extend previous research examining associations between meibomian gland morphology and ocular surface parameters. Pult et al.(25) evaluated gland morphology in non-diabetic individuals and reported negative correlations between gland thickness and TBUT, as well as positive correlations with OSDI scores, but no association with lipid layer thickness. A large study involving 538 patients with meibomian gland dysfunction reported modest inverse correlations between tear osmolarity and both gland thickness and interglandular width(6). In contrast, our study demonstrates that specific morphological patterns—particularly distorted, tortuous, overlapping, and ghost glands—are consistently associated with multiple clinical indicators of DED. The strong correlations observed between these morphological features and worsening ocular surface parameters support the hypothesis that structural disruption of the meibomian glands interferes with effective meibum delivery, thereby exacerbating both subjective symptoms and objective signs of DED(26,27).
Several mechanisms may explain the deleterious effects of type 2 DM on meibomian gland structure and function(28-31). Chronic hyperglycemia induces oxidative stress and lipid peroxidation, altering meibum composition, increasing viscosity, and promoting ductal obstruction and glandular atrophy(28). Inflammatory pathways associated with diabetes, including elevated cytokines such as IL-1β and TNF-α, can damage glandular epithelial cells. Insulin resistance may further disrupt androgen-mediated regulation of lipid secretion(29). In addition, diabetic microangiopathy compromises vascular supply to the eyelids, leading to tissue hypoxia and progressive gland dropout(30). Diabetic neuropathy may also impair blink dynamics and orbicularis oculi muscle function, reducing meibum expression and promoting glandular stagnation(31).
A key strength of this study is the direct comparison of meibomian gland morphology between diabetic and non-diabetic individuals with confirmed DED. This analysis revealed that diabetic DED represents a more severe and distinct morphological phenotype rather than simply reflecting DED alone. Diabetic DED-positive patients exhibited significantly greater gland atrophy—manifested by higher dropout, shortening, and ghost gland scores—as well as more pronounced structural deformations, including hooked, tortuous, and overlapping glands. These findings suggest that the metabolic environment of diabetes amplifies glandular degeneration and architectural disruption beyond that observed in non-diabetic DED. The substantially higher composite morphological scores in diabetic patients underscore the additional structural burden imposed by diabetes and highlight the potential value of meibomian gland morphology assessment for identifying a more severe, diabetes-associated form of DED that may require tailored management strategies.
Previous studies assessing the diagnostic value of meibomian gland morphology in DED have yielded inconsistent results. Pult et al.(25) reported that gland atrophy could differentiate symptomatic from asymptomatic individuals, whereas gland thickness and tortuosity provided limited additional diagnostic value. Xiao et al.(32) identified gland tortuosity and length as meaningful predictors, but found poor discriminative power for gland thickness and atrophy. Yeh and Lin(33) observed that after adjusting for age, differences in gland atrophy and meibum quality between lipid-deficient DED and controls were no longer significant. Such discrepancies likely reflect variations in study populations, DED definitions, grading systems, and assessment methodologies(33).
Notably, our study is the first to evaluate meibomian gland morphological features as diagnostic indicators of DED specifically in patients with type 2 DM using noninvasive meibography. ROC analysis demonstrated that gland dropout, shortening, distorted or tortuous morphology, and lack of extension to the lid margin had the highest diagnostic value. Importantly, the total mean morphological score provided superior predictive performance compared with individual features, suggesting that a composite assessment approach may improve diagnostic accuracy in diabetic patients. These findings also imply that structural glandular changes may precede overt functional impairment in diabetic ocular surface disease.
Distinct differences were observed between upper and lower eyelids. The upper eyelid exhibited higher total mean and composite scores, with increased frequencies of distorted, tortuous, hooked, overlapping, thickened, and tadpole-like glands. The larger tarsal plate and higher gland density of the upper eyelid may predispose it to greater morphological distortion under mechanical stress from blinkinge(34). In contrast, the lower eyelid more frequently demonstrated atrophic changes, including gland dropout, ghost glands, and shortening, likely due to its thinner tarsal plate and greater susceptibility to environmental and inflammatory exposure(34). These findings underscore the importance of evaluating upper and lower eyelids separately rather than assuming equivalent pathological changes.
Several limitations should be acknowledged. The cross-sectional design precludes causal inference. Although meibography was performed by experienced clinicians, morphological grading remains partly subjective and may be influenced by inter-observer variability. Additionally, the absence of automated or AI-based image analysis may limit reproducibility. Future longitudinal studies incorporating automated assessment tools and functional analyses are warranted.
Despite these limitations, this study has notable strengths. It is the first to evaluate the diagnostic value of meibomian gland morphology for DED in type 2 DM using noninvasive meibography. It integrates functional and structural assessments and separately analyzes upper and lower eyelids, providing a comprehensive evaluation of glandular pathology.
In conclusion, type 2 DM contributes to DED through impaired tear production and characteristic structural alterations of the meibomian glands. Morphological features such as gland dropout, tortuosity, and shortening appear to reflect downstream effects of metabolic dysregulation and may serve as valuable markers for identifying diabetic patients at increased risk of ocular surface disease.
AUTHOR’ CONTRIBUTIONS:
Significant contribution to conception and design: Meryem Altın Ekin. Data Acquisition: Meryem Altın Ekin. Data Analysis and Interpretation: Meryem Altın Ekin. Manuscript Drafting: Meryem Altın Ekin. Significant intellectual content revision of the manuscript: Meryem Altın Ekin. Have given final approval of the submitted manuscript (mandatory participation for all authors): Meryem Altın Ekin. Statistical analysis: Meryem Altın Ekin. Obtaining funding: not applicable. Supervision of administrative, technical, or material support: Meryem Altın Ekin. Research group leadership: Meryem Altın Ekin.
REFERENCES
1. Misra SL, Braatvedt GD, Patel DV. Impact of diabetes mellitus on the ocular surface: a review. Clin Exp Ophthalmol. 2016;44(4):278-288.
2. Lee R, Wong TY, Sabanayagam C. Epidemiology of diabetic retinopathy, diabetic macular edema, and related vision loss. Eye Vis (Lond). 2015;2:(1):17.
3. Zhang X, Zhao L, Deng S, Sun X, Wang N. Dry eye syndrome in patients with diabetes mellitus: prevalence, etiology, and clinical characteristics. J Ophthalmol. 2016;2016(1):8201053.
4. Nichols KK, Foulks GN, Bron AJ, Glasgow BJ, Dogru M, Tsubota K, et al. The international workshop on meibomian gland dysfunction: executive summary. Invest Ophthalmol Vis Sci. 2011;52(4):1922-1929.
5. Daniel E, Pistilli M, Ying GS, Bunya VY, Massaro-Giordano M, Asbell PA, Maguire mg; Dry Eye Assessment and Management (DREAM) Study Research Group. Association of meibomian gland morphology with symptoms and signs of dry eye disease in the Dry Eye Assessment and Management (DREAM) study. Ocul Surf. 2020;18(4):761-769.
6. Adil MY, Xiao J, Olafsson J, Chen X, Lagali NS, Ræder S, et al. Meibomian gland morphology is a sensitive early indicator of meibomian gland dysfunction. Am J Ophthalmol. 2019;200:16-25.
7. Crespo-Treviño RR, Salinas-Sánchez AK, Amparo F, Garza-Leon M. Comparison of meibomian glands in patients with evaporative dry eye disease versus non-dry eye disease. Sci Rep. 2021;11(1):20729.
8. American Diabetes Association Professional Practice Committee. Diagnosis and classification of diabetes: Standards of Medical Care in Diabetes—2024. Diabetes Care. 2024;47(Suppl 1):S20-S42.
9. Schiffman RM, Christianson MD, Jacobsen G, Hirsch JD, Reis BL. Reliability and validity of the Ocular Surface Disease Index. Arch Ophthalmol. 2000;118(5):615-621.
10. Asiedu K, Kyei S, Mensah SN, Ocansey S, Abu LS, Kyere EA. Ocular Surface Disease Index (OSDI) Versus the Standard Patient Evaluation of Eye Dryness (SPEED): A Study of a Nonclinical Sample. Cornea. 2016;35(2):175-80.
11. Karaca I, Yıldırım N, Yılmaz S, Ateş O. A comparative study of diagnostic tests for dry eye disease: the role of Schirmer’s test and tear break-up time. Turk J Ophthalmol. 2023;53(1):32-39.
12. Wolffsohn JS, Arita R, Chalmers R, Djalilian A, Dogru M, Dumbleton K, et al. TFOS DEWS II diagnostic methodology report. Ocul Surf. 2017;15(3):539-574.
13. Miyata K, Amano S, Sawa M, Nishida T. A novel grading method for superficial punctate keratopathy magnitude and its correlation with corneal epithelial permeability. Arch Ophthalmol. 2003;121(11):1537-1539.
14. Bron AJ, Evans VE, Smith JA. Grading of corneal and conjunctival staining in the context of other dry eye tests. Cornea. 2003;22(7):640-650.
15. Shimazaki J, Goto E, Ono M, Tsubota K. Meibomian gland dysfunction in patients with Sjögren syndrome. Ophthalmology. 1998;105(8):1485-1488.
16. Pult H, Riede-Pult B. Comparison of subjective grading and objective assessment in meibography. Cont Lens Anterior Eye. 2013;36(1):22-27.
17. Craig JP, Nichols KK, Akpek EK, Caffery B, Dua HS, Joo CK, et al. TFOS DEWS II definition and classification report. Ocul Surf. 2017;15(3):276-283.
18. Bashorun SD, Balogun BG, Ibidapo O, Bashorun AO. Prevalence of dry eye disease in type 2 diabetic and non-diabetics: a cross-sectional hospital-based study. J West Afr Coll Surg. 2024;14(2):180-187.
19. Weng J, Ross C, Baker J, Alfuraih S, Shamloo K, Sharma A. Diabetes-associated hyperglycemia causes rapid-onset ocular surface damage. Invest Ophthalmol Vis Sci. 2023;64(14):11.
20. Sahu J, Vallinayagam M, Srikanth K, Srini S. Conjunctival impression cytology and tear film changes in patients with type 2 diabetes mellitus and correlation with severity of diabetic retinopathy. Saudi J Ophthalmol. 2024;39(1):71-76.
21. Baek J, Doh SH, Chung SK. Assessment of the tear meniscus using optical coherence tomography in patients with type 2 diabetes mellitus. Cornea. 2015;34(12):1534-1540.
22. Ozdemir M, Buyukbese MA, Cetinkaya A, Ozdemir G. Risk factors for ocular surface disorders in patients with diabetes mellitus. Diabetes Res Clin Pract. 2003;59(3):195-199.
23. Mangoli MV, Bubanale SC, Bhagyajyothi BK, Goyal D. Dry eye disease in diabetics versus non-diabetics: association with diabetic retinopathy and corneal nerve sensitivity. Indian J Ophthalmol. 2023;71(4):1533-1537.
24. Altin Ekin M, Kahraman HG, Boluk E, Kurt Incesu T. Evaluation of dry eye disease and meibomian gland dysfunction with meibography in type 2 diabetes. Eur Eye Res. 2025;5(1):1-8.
25. Pult H, Riede-Pult BH, Nichols JJ. Relation between upper and lower lid meibomian gland morphology, tear film, and dry eye. Optom Vis Sci. 2012;89(3):E310-E315.
26. Knop E, Knop N, Millar T, Obata H, Sullivan DA. The international workshop on meibomian gland dysfunction: report of the subcommittee on anatomy, physiology, and pathophysiology of the meibomian gland. Invest Ophthalmol Vis Sci. 2011;52(4):1938-1978.
27. Arita R, Itoh K, Inoue K, Amano S. Noncontact infrared meibography to document age-related changes of the meibomian glands in a normal population. Ophthalmology. 2008;115(5):911-915.
28. Guo Y, Zhang H, Zhao Z, Luo X, Zhang M, Bu J, et al. Hyperglycemia induces meibomian gland dysfunction. Invest Ophthalmol Vis Sci. 2022;63(1):30.
29. Yang Q, Liu L, Li J, Yan H, Cai H, Sheng M, et al. Evaluation of meibomian gland dysfunction in type 2 diabetes with dry eye disease: a non-randomized controlled trial. BMC Ophthalmol. 2023;23(1):44.
30. Najafi L, Malek M, Valojerdi AE, Aghili R, Khamseh ME, Fallah AE, et al. Dry eye and its correlation to diabetes microvascular complications in people with type 2 diabetes mellitus. J Diabetes Complications. 2013;27(5):459-462.
31. Liu Y, Sun D, Kong Q, Li D, Wang R, Yin J, et al. Peripheral neuropathy symptoms and ocular surface lesions in patients with type 2 diabetes mellitus and dry eye: a clinical correlational study. Ophthalmol Ther. 2025;14(7):1503-1519.
32. Xiao J, Adil MY, Olafsson J, Chen X, Utheim ØA, Ræder S, et al. Diagnostic test efficacy of meibomian gland morphology and function. Sci Rep. 2019;9(1):17345.
33. Yeh TN, Lin MC. Meibomian gland contrast sensitivity and specificity in the diagnosis of lipid-deficient dry eye: a pilot study. Optom Vis Sci. 2021;98(2):121-126.
34. Li J, Qin X, Jiang H, Guo Y, Liu X, Zhang R, et al. Morphological and functional characteristics of the meibomian gland in pediatric patients with epiblepharon. BMC Ophthalmol. 2024;24(1):84.
Submitted for publication:
August 7, 2025.
Accepted for publication:
December 8, 2025.
Approved by the following research ethics committee: Izmir Katip Celebi University Ataturk Training and Research Hospital (#24.03.2022/150).
Data Availability Statement:
The data cannot be made publicly available. The dataset includes sensitive clinical information and cannot be publicly shared due to patient confidentiality and institutional data protection policies.
Edited by
Editor-in-Chief: Newton Kara-Júnior
Associate Editor: Dácio C. Costa
Funding: This study received no specific financial support.
Disclosure of potential conflicts of interest: The author declare no potential conflicts of interest.

How to cite this article:
 ABO is licensed under a Creative Commons Attribution-NonComercial 4.0 Internacional.