Arq. Bras. Oftalmol. 2026; 89 (1): 10.5935/0004-2749.2025-0049
Total: 1369
Cristiana Soares Ronconi1; Julia Dutra Rossetto2; Luisa Moreira Hopker3; Ana Carolina Sarmento Barros Carneiro1; Bárbara Stofel Ventorin4; Paulo Schor1
DOI: 10.5935/0004-2749.2025-0049
ABSTRACT
PURPOSE: This cross-sectional study compared best-corrected visual acuity obtained using Cloudscaper symbols, a novel optotype developed according to ETDRS specifications for children's virtual screening, with that obtained using LEA symbols.
METHODS: A total of 560 children aged 3-16 yr underwent visual acuity test with both Cloudscaper symbols and LS. The test application was standardized using the EyeSpy algorithm. Additionally, 147 participants were tested with the standard Snellen E paper chart. Paired t tests were performed to assess the clinical significance of logMAR visual acuity differences.
RESULTS: The mean logMAR visual acuity with LEA symbols was 0.12 (standard deviation [SD]=0.18; range, -0.10 to 0.80), while with Cloudscaper symbols it was 0.18 (SD=0.19; range, -0.10 to 0.80). The mean difference between Cloudscaper symbols and LEA symbols was 0.099 logMAR (approximately 0.5 optotypes; SD=0.08; range, 0.0-0.14; p<0.0001). Cloudscaper symbols slightly underestimated visual acuity compared to LEA symbols. Visual acuity measured by both methods was highly correlated (Spearman's r=0.74, p<0.0001). The mean visual acuity difference between Cloudscaper symbols and the Snellen E chart was 0.0045 (p=0.805; 95% confidence interval [95% CI]), whereas the difference between LEA symbols and Snellen E was 0.0883 (p<0.001; 95% CI).
CONCLUSIONS: Cloudscaper symbols provide a reliable tool for visual screening in children. Although they slightly underestimate visual acuity compared to LEA symbols – a finding also reported when comparing ETDRS letters with LEA symbols – Cloudscaper symbols show strong agreement with Snellen E chart measurements. This suggests that Cloudscaper symbols allow precise visual acuity assessment comparable to the gold standard.
Keywords: Vision screening; Vision tests; Visual acuity; Mobile applications; Eye health; Child health; Diagnostic techniques, Ophthalmological; Child; Preschool child; Adolescent
INTRODUCTION
Visual acuity (VA) measurement is the primary method used for visual screening and is considered the "gold standard" for assessing visual function in clinical trials(1,2). The Early Treatment Diabetic Retinopathy Study (e-ETDRS)(3) protocol is well established for VA assessment in adults. However, it may not be suitable for preschool-aged children, who often struggle to identify the 10 letters on the chart. Cotter et al.(4) assessed the test-retest reliability of the e-ETDRS in children aged 7-13 yr and found that 89% of retest scores were within 0.1 logMAR and 99% were within 0.2 logMAR. Comparable data are not available for children younger than 7 yr.
For optotype-based screening in preschool children, the American Association of Pediatric Ophthalmology and Strabismus (AAPOS)(5) recommends matching image optotypes, such as LEA symbols (LS), or letters, presented either as a sequence of optotypes on a line or as single optotypes surrounded by four lines (crowding or slash bars). Preverbal children may be tested with LS, whereas literate children can be tested with letter charts such as the Sloan or HOTV(5). A study comparing three methods of VA measurement in healthy and amblyopic preschool children – Snellen E chart (SE), single LEA symbols (SLS), and crowded LEA symbols (CLS) – showed no statistically significant differences, indicating that all three methods are appropriate for VA testing at this age(6).
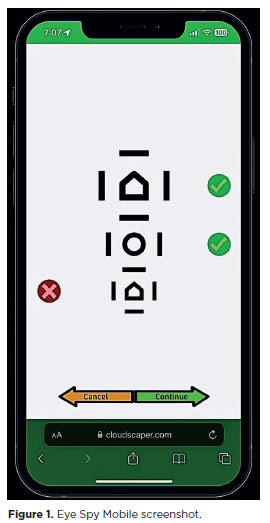
Recent studies have demonstrated that electronic devices can successfully and accurately measure VA(7). One such solution is Eye Spy Mobile, a software application designed for VA assessment in both nonliterate and older children. The app employs an adaptive algorithm that presents three optotypes with crowding bars, arranged vertically to fit a smartphone screen. VA measurements obtained with Eye Spy Mobile are comparable to e-ETDRS(8,9) and are faster to administer. Cloudscaper symbols (CS; Figure 1), a new optotype developed within Eye Spy Mobile and based on ETDRS specifications, were specifically designed for children's virtual screening. In Brazil, the Eye Spy Mobile app is currently under academic testing and is not yet commercially available.
Given Brazil's large territory and its population of approximately 48 million children aged 5-14 yr(10), scaling up vision screening through technological solutions is a reasonable approach, especially considering limited access to public healthcare in such a geographically extensive country.
This study aims to compare best-corrected VA results obtained using virtual CS via the Eye Spy Mobile application with those obtained using virtual LS and the standard Snellen E paper chart in children aged 3-16 yr.
METHODS
This cross-sectional study compared virtual VA measurements obtained using a new set of symbol optotypes, CS, with the established and validated LS and the standard Snellen E (SE) paper chart.
A total of 560 children were examined over 4 days in April 2022 during a large vision screening task force project, organized as part of a social initiative supported by SAS Brasil, a Brazilian third-sector health organization. These children had been previously screened at school by teachers trained to perform standard VA testing with paper charts. Those who failed according to the AAPOS recommendations(11) were referred for further evaluation: ages 36-47 months, correct identification of 20/50 line; ages 48-59 months, correct identification of 20/40 line; and ≥5 yr, correct identification of most optotypes on the 20/32 line.
The study followed the tenets of the Declaration of Helsinki and was approved by the Research Ethics Committee of the Universidade Federal de São Paulo (protocol number 54089421.2.0000.5505). Written informed consent was obtained from parents or legal guardians, and assent was obtained from participating children. Eligible participants were aged 3-16 yr, able to cooperate with the virtual VA measurement, and had parental consent. Children with systemic or ocular abnormalities were not excluded, since CS was designed for use across diverse conditions.
Best-corrected distance VA (BCVA) was assessed virtually using the Eye Spy Mobile application. Both CS and LS were presented via software installed on the same smartphone, positioned 3 m from the participant. Each test displayed three symbols arranged vertically, surrounded by crowding bars, across different logMAR levels. Optotype sizes ranged from 20/125 (largest, 0.8 logMAR) to 20/16 (smallest, -0.1 logMAR). Children read the symbols aloud, and examiners recorded responses by tapping the screen once for correct or twice for incorrect. This generated the next column of three optotypes (Figure 1). The adaptive algorithm used had been previously validated(8,9), adjusting optotype size based on prior responses until the VA threshold was determined.
The Eye Spy Mobile protocol defined the final VA as the smallest logMAR line with at least three of five optotypes correctly identified. The algorithm required testing of all five optotypes on the line immediately below the threshold to confirm results and refine the logMAR score using letter counting. The software recorded each logMAR stimulus, corresponding responses, and test duration.
The following monocular virtual VA assessments were performed, beginning with the right eye for all participants: right eye (OD) – tested twice, once with CS and once with LS, with order randomized, and left eye (OS) – tested once, with LS.
Additionally, 147 randomly selected children underwent a standard SE paper chart test. Because the sample included nonliterate children, the Snellen E was chosen. Only right-eye data were included in statistical analyses to avoid bilateral bias.
Participants were stratified by age (3-<6 yr, 6-<10 yr, 10-≤16 yr) and VA level (20/32 or better; >20/32 to 20/63; >20/63 to 20/125).
Normality of quantitative variables was assessed using the Shapiro-Wilk test. Results were expressed as mean ± standard deviation (SD) for normally distributed variables or median (minimum-maximum) for non-normally distributed variables. Qualitative variables were expressed as absolute numbers and percentages. Paired Student's t test was applied when quantitative variables were normally distributed; otherwise, the Wilcoxon test was used. Pearson correlation analysis was conducted to compare VA measurements between CS and LS.
Agreement between measures was assessed using Bland-Altman plots. A p-value <0.05 was considered statisticalely significant. All analyses and graphical outputs were generated using JAMOVI statistical software version 2.5.0, based on the R language(12,13).
RESULTS
All 560 participants completed the tests and were included in the analysis. The mean age was 8.8 yr (SD=3.0; range, 3-16 yr). Participant age and VA results for each optotype as well as their differences are summarized in table 1. Only right-eye (OD) VA measurements were analyzed.
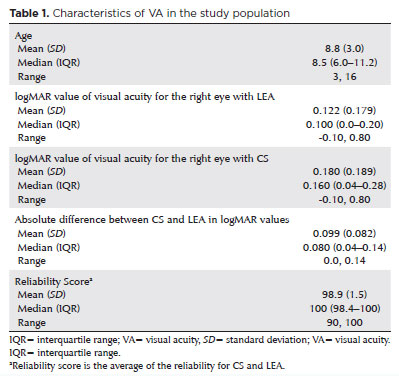
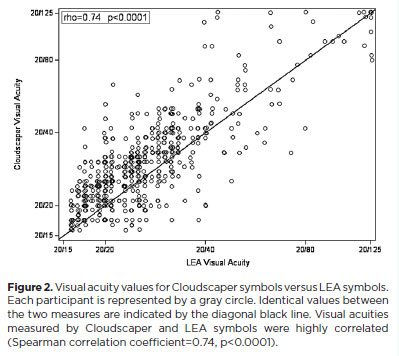
The mean logMAR VA for OD tested with LS was 0.122 (SD=0.179; range, -0.10 to 0.80), compared with 0.180 with CS (SD=0.189; range, -0.10 to 0.80). The absolute mean VA difference between CS and LS was 0.099 logMAR (SD=0.082; range, 0.0-0.14; p<0.0001). VA measurements obtained with both methods were highly correlated (Spearman's r=0.74, p<0.0001; Figure 2). This correlation remained significant across all VA and age groups.
Averaged VA from CS and LS was inversely correlated with age (Spearman's r=-0.20, p<0.0001). When analyzed separately, LS correlated with age at r=-0.22 (p<0.0001) and CS at r=-0.15 (p=0.0005).
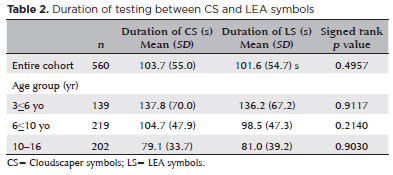
The mean test duration was similar for CS (103.7 s) and LS (101.6 s) across the cohort (Table 2). Younger children required more time with both optotypes, but test duration remained comparable between CS and LS within each age group. The CS test was administered first in 261 participants (46.6%). Regardless of the optotype, the first test performed always required more time than the second.
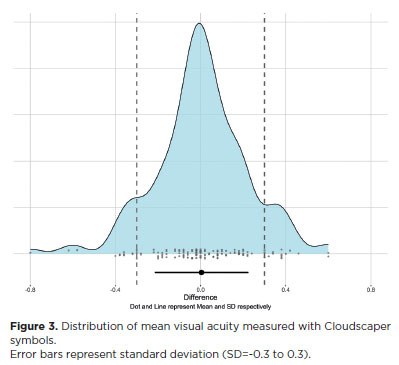
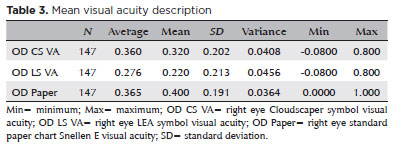
Among the 147 children who also completed the SE paper chart test, mean VA was 0.360 logMAR (SD=0.201; range, 0.080-0.800) with CS (Figure 3), 0.276 (SD=0.213; range, 0.080-0.800) with LS, and 0.365 (SD=0.191; range, 0.000-1.000) with SE (Table 3). The mean difference between CS and SE was 0.0045 logMAR (p=0.805; 95% confidence interval [95% CI]), while the mean difference between LS and SE was 0.0883 logMAR (p<0.001; 95% CI).
DISCUSSION
This study compared CS and LS in a real-world setting for assessing VA in children aged 3 to 16 yr. CS correlated significantly with LS in VA measurements, although CS tended to slightly underestimate VA compared with LS (mean difference, 0.099). The equivalence of VA measurements was observed across all subgroups (by age and VA levels). Previous research indicates that LS provides better VA scores than ETDRS charts by an average of 0.5 lines (0.04-0.06 log unit)(14). While LS vary in stroke width, optotype size, and line composition - designed so that all shapes blur into a circle - CS strictly follow Sloan/ETDRS specifications. CS are intentionally designed to underestimate VA, which is desirable in screening settings to avoid missing cases of even mild impairment. Other tests, such as the non-logMAR Landolt C test(15) or the logMAR Bailey-Lovie chart(2), have also been shown to underestimate VA when compared with LS.
The Eye Spy Mobile application also evaluates "time to assess VA". Our findings showed that the duration of CS and LS testing was similar for the overall cohort and by age group (Table 2). No significant differences were observed in the time taken to complete the tests, supporting the non-inferiority of CS compared with LS. The rapid completion time is an advantage in pediatric populations, where attention spans are often limited and may compromise test reliability. This feature could be valuable in future studies comparing VA testing times in children with refractive errors.
Importantly, CS VA measurements were consistent with those obtained using standard paper charts – the gold-standard method – whereas LS were not (Figure 3). Mean VA with CS did not differ significantly from standard paper chart results (p=0.805), whereas LS results did (p<0.001).
Selecting an instrument for VA assessment in clinical and research contexts requires balancing methodological rigor with practical applicability to the target population. The ETDRS chart is widely regarded as the gold standard because of its logMAR design, which provides uniform optotype progression, consistent numbers of letters per line, and standardized spacing. By contrast, Snellen charts, including the "E" variant, exhibit heterogeneity in optotype number, spacing, and legibility(16). Because our cohort included young children and non-literate participants, we used the Snellen "E" paper chart for screening, as it is simpler and more familiar in population-based settings.
Consistent with prior studies, Snellen charts underestimated VA compared with ETDRS. In patients with retinal disease, for example, Snellen acuity may appear one to two lines worse than ETDRS, with greater discrepancies in severe cases (e.g., Snellen 20/200 corresponding to ETDRS 20/95, >3 lines difference)(17). For individuals with better VA, however, the difference is less clinically significant (e.g., Snellen 20/30 vs ETDRS 20/25)(16). Such underestimation may be advantageous in screening, as it improves sensitivity for detecting borderline cases.
The Eye Spy Mobile application proved efficient and reproducible, adhering to a true logMAR design. This contrasts with less standardized smartphone applications such as PEEK(18) and DigiVis(19), which use non-logMAR designs and less consistent optotypes, leading to variability in stroke width and symbol size.
In Brazil, where school attendance is mandatory from age 4, reliable symbol optotypes such as CS are essential for large-scale visual screening, particularly in diverse populations and for remote assessments by general healthcare workers. Nonetheless, this study has limitations. The main limitation relates to our cohort, which predominantly included children with relatively high baseline VA, reducing the generalizability of findings to populations with significant impairment. Thus, extrapolation to clinical populations should be made with caution.
A second limitation is the methodological choice of the Snellen "E" chart, a non-logMAR tool. While appropriate for screening young and non-literate children, it lacks the psychometric precision of the ETDRS chart. Although discrepancies are less pronounced in eyes with good vision, the absence of a logarithmic scale inherently reduces measurement accuracy. These factors should be considered when interpreting the results.
In conclusion, CS provides VA measurements comparable with the gold standard and is suitable for screening children aged 3 to 16 yr. The Eye Spy 20/20 application offers a reliable, practical tool for virtual VA assessment, supporting effective pediatric visual screening.
HIGHLIGHTS
Validation of Cloudscaper symbols, a novel optotype developed based on ETDRS specifications, as a precise tool for assessing virtual visual acuity.
Demonstrated the suitability of Cloudscaper symbols for visual screening in children.
AUTHORS' CONTRIBUTIONS:
Significant contribution to conception and design: Cristiana Soares Ronconi, Julia Dutra Rossetto, Luisa Moreira Hopker, Ana Carolina Sarmento Barros Carneiro, Bárbara Stofel Ventorin, Paulo Schor. Data acquisition: Julia Dutra Rossetto, Luisa Moreira Hopker, Ana Carolina Sarmento Barros Carneiro, Bárbara Stofel Ventorin. Data analysis and interpretation: Cristiana Soares Ronconi, Julia Dutra Rossetto, Luisa Moreira Hopker, Paulo Schor. Manuscript drafting: Cristiana Soares Ronconi, Julia Dutra Rossetto, Luisa Moreira Hopker. Significant intellectual content revision of the manuscript: Julia Dutra Rossetto, Luisa Moreira Hopker, Paulo Schor. Final approval of the submitted manuscript: Cristiana Soares Ronconi, Julia Dutra Rossetto, Luisa Moreira Hopker, Ana Carolina Sarmento Barros Carneiro, Bárbara Stofel Ventorin, Paulo Schor. Statistical analysis: Cristiana Soares Ronconi, Julia Dutra Rossetto, Luisa Moreira Hopker, Paulo Schor. Obtaining funding: not applicable. Supervision of administrative, technical, or material support: Paulo Schor. Research group leadership: Paulo Schor.
REFERENCES
1. Ciner EB, Schmidt PP, Orel-Bixler D, Dobson V, Maguire M, Cyert L, Moore B, Schultz J. Vision screening of preschool children: evaluating the past, looking toward the future. Optom Vis Sci. 1998;75(8):571-84.
2. Dobson V, Maguire M, Orel-Bixler D, Quinn G, Ying GS; Vision in Preschoolers (VIP) Study Group. Visual acuity results in school-aged children and adults: Lea Symbols chart versus Bailey-Lovie chart. Optom Vis Sci. 2003;80(9):650-4.
3. Recommended stardard procedures for the clinical measurement and specification of visual acuity. Report of working group 39. Committee on vision. Assembly of Behavioral and Social Sciences, National Research Council, National Academy of Sciences, Washington, D.C. Adv Ophthalmol. 1980;41:103-48.
4. Cotter SA, Chu RH, Chandler DL, Beck RW, Holmes JM, Rice ML, et al. Reliability of the electronic early treatment diabetic retinopathy study testing protocol in children 7 to <13 years old. Am J Ophthalmol. 2003;136(4):655-61.
5. American Association for Pediatric Ophthalmology and Strabismus (AAPOS). AAPOS techniques for pediatric vision screening. [cited 2025 Aug 32]. Available from: https://www.ncesd.org/wp-content/uploads/2017/09/1074_aapostechniquesforpediatricvisionscreening.pdf
6. Inal A, Ocak OB, Aygit ED, Yilmaz I, Inal B, Taskapili M, Gokyigit B. Comparison of visual acuity measurements via three different methods in preschool children: Lea symbols, crowded Lea symbols, Snellen E chart. Int Ophthalmol. 2018;38(4):1385-91.
7. Black JM, Jacobs RJ, Phillips G, Chen L, Tan E, Tran A, et al. An assessment of the iPad as a testing platform for distance visual acuity in adults. BMJ Open. 2013;3(6):20130620.
8. Vasudevan B, Baker J, Miller C, Feis A. Analysis of the reliability and repeatability of distance visual acuity measurement with EyeSpy 20/20. Clin Ophthalmol. 2022;16:1099-108.
9. Rosenthal E, O'Neil J, Hoyt B, Howard M. Inter-rater reliability of eyespy mobile for pediatric visual acuity assessments by parent volunteers. Clin Ophthalmol. 2024;18:235-245.
10. Instituto Brasileiro de Geografia e Estatística (IBGE) IBdGeE. Censo 2022. [citado 2025 Ago 31]. Disponível em: https://censo2022.ibge.gov.br/2022
11. American Association for Pediatric Ophthalmology and Strabismus (AAPOS). Vision Screening Guidelines. [cited 2025 Aug 31]. Available from: aapos.org/members/vision-screening-guidelines.
12. Tjp. Jamovi. (Version 1.6) [Computer Software]. Jamovi; 2020 [cited 2025 Aug 31]. Available from: https://www.jamovi.org
13. RCT. R: A Language and environment for statistical computing. (Version 4.0) [Computer software]. [cited 2025 Aug 31]. Available from: https://cran.r-project.org. (R packages retrieved from MRAN snapshot 2020-08-24).
14. Dobson V, Clifford-Donaldson CE, Miller JM, Garvey KA, Harvey EM. A comparison of Lea Symbol vs ETDRS letter distance visual acuity in a population of young children with a high prevalence of astigmatism. J AAPOS. 2009;13(3):253-7.
15. Gräf MH, Becker R, Kaufmann H. Lea symbols: visual acuity assessment and detection of amblyopia. Graefes Arch Clin Exp Ophthalmol. 2000;238(1):53-8.
16. Falkenstein IA, Cochran DE, Azen SP, Dustin L, Tammewar AM, Kozak I, et al. Comparison of visual acuity in macular degeneration patients measured with snellen and early treatment diabetic retinopathy study charts. Ophthalmology. 2008;115(2): 319-23.
17. Baker CW, Josic K, Maguire MG, Jampol LM, Martin DF, Rofagha S, et al.; DRCR retina network. comparison of snellen visual acuity measurements in retinal clinical practice to electronic ETDRS Protocol Visual Acuity Assessment. Ophthalmology. 2023;130(5):533-41.
18. Bastawrous A, Rono HK, Livingstone IA, Weiss HA, Jordan S, Kuper H, et al. Development and validation of a Smartphone-Based Visual Acuity Test (Peek Acuity) for clinical practice and community-based fieldwork. JAMA Ophthalmol. 2015;133(8):930-7.
19. Thirunavukarasu AJ, Mullinger D, Rufus-Toye RM, Farrell S, Allen LE. Clinical validation of a novel web-application for remote assessment of distance visual acuity. Eye (Lond). 2022;36(10): 2057-61.
Submitted for publication:
April 14, 2025.
Accepted for publication:
August 26, 2025.
Approved by the following research ethics committee: Universidade Federal de São Paulo – UNIFESP (CAAE: 54089421.2.0000.5505)
Data Availability Statement: The datasets generated and/or analyzed during this study are available from the corresponding author upon request.
Edited by
Editor-in-Chief: Newton Kara-Júnior
Associate Editor: Camila Koch
Funding: This study received no specific financial support.
Disclosure of potential conflicts of interest: The authors declare no potential conflicts of interest.

How to cite this article:
 ABO is licensed under a Creative Commons Attribution-NonComercial 4.0 Internacional.