Arq. Bras. Oftalmol. 2019; 82 (1): 10.5935/0004-2749.20190015
Total: 1711
Berna Dogan; Melih Akıdan; Muhammet Kazım Erol;, Deniz Turgut Coban; Elcin Suren
DOI: 10.5935/0004-2749.20190015
ABSTRACT
A 33-year-old male presented to our clinic with low vision in both eyes that started during the previous week. Visual acuity was 20/63 in the right eye and 20/50 in the left eye. Fundus examination revealed signs of hypertensive retinopathy; thus, a multidisciplinary approach was adopted for the diagnosis and treatment of this patient. We consulted the nephrology and cardiology departments on this case. Upon diagnosing malignant hypertension and renal failure, the patient was put on hemodialysis. His visual acuity was 20/20 at 6 months, whereas foveal assessment on optical coherence tomography angiography revealed neither marked superficial and deep capillary density loss and foveal avascular zone enlargement nor a decrease in disc flow and radial peripapillary capillary density. Early diagnosis and treatment of malignant hypertension are critical in preventing progression of end-organ damage including the eyes. Optical coherence tomography angiography may be useful in cases when fundus fluorescein angiography is relatively contraindicated (e.g., renal failure).
Keywords: Malignant hypertension; Tomography, optical coherence; Fluorescein angiography; Hypertensive retinopathy
RESUMO
Um homem de 33 anos apresentou-se à nossa clínica com baixa visão em ambos os olhos que começou uma semana antes. A acuidade visual foi de 20/63 no olho direito e 20/50 no olho esquerdo. O exame de fundo de olho revelou sinais de retinopatia hipertensiva; então, adotou-se uma abordagem multidisciplinar para o diagnóstico e tratamento desse paciente. Consultamos os departamentos de nefrologia e cardiologia neste caso. Ao diagnosticar hipertensão maligna e insuficiência renal, o paciente foi colocado em hemodiálise. Sua acuidade visual era 20/20 aos 6 meses, enquanto a avaliação foveal com angiotomografia de coerência óptica não revelou perda de densidade capilar superficial e profunda acentuada e aumento da zona avascular foveal nem uma diminuição no fluxo de disco e na densidade capilar peripapilar radial. O diagnóstico precoce e o tratamento da hipertensão maligna são fundamentais na preveção da progressão de danos nos órgãos-alvo, incluindo os olhos. A Angiografia por tomografia de coerência óptica pode ser útil nos casos em que a angiografia com fluoresceína do fundo de olho é relativamente contraindicada (por exemplo, insuficiência renal).
Descritores: Hipertensão maligna; Tomografia de coerência óptica; Angiofluoresceínografia; Retinopatia hipertensiva
INTRODUCTION
Malignant hypertension (MHT) is the most severe form of hypertensive retinopathy with regard to end-organ damage, whereas optical neuropathy is usually concomitant with choroidopathy and maculopathy(1). Changes in retinal pigment epithelium (RPE), such as Elschnig spots and Siegrist streaks as well as pigment epithelial detachment and subretinal fluid (SRF), may develop because of choriocapillaris necrosis. In MHT, both the visual prognosis and end-organ damage in the brain, heart, and kidneys are closely related to blood pressure and elapsed time. Therefore, early diagnosis and a multidisciplinary approach are essential.
Optical coherence tomography angiography (OCTA, Optovue, Inc., Fremont, CA, USA) is an imaging method for the in-depth evaluation of retinal and choroidal vessels and may be useful in cases when fundus fluorescein angiography (FFA) is relatively contraindicated (e.g., renal failure).
We aimed to present the results of OCTA, FFA, spectral-domain optical coherence tomography (SD-OCT, Cirrus HD-OCT 5000, Carl Zeiss Meditec Inc., Dublin, CA, USA) in our patient diagnosed with MHT.
CASE REPORT
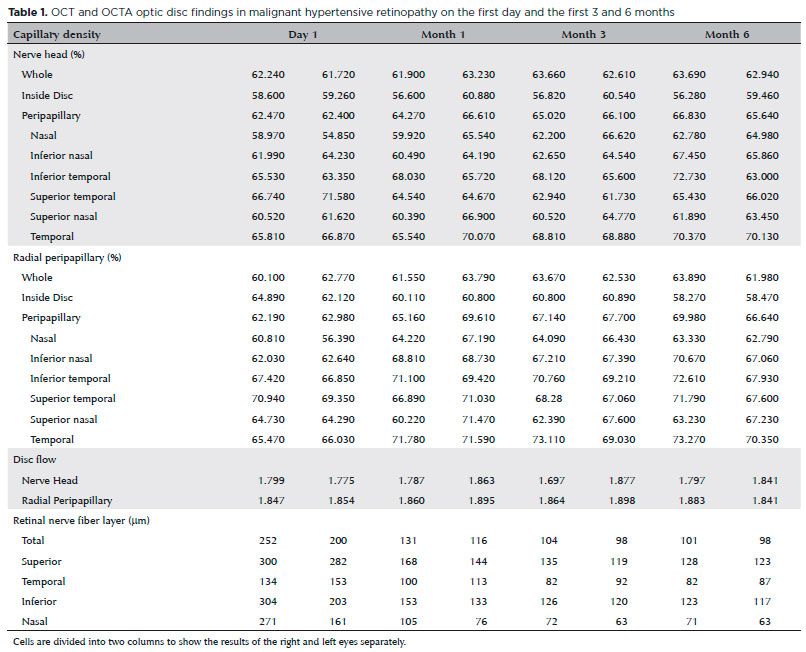
A 33-year-old male presented to our clinic with low vision in both eyes that had started during the previous week. Visual acuity was 20/63 in the right eye and 20/50 in the left eye. Intraocular pressure was 13 mmHg in both eyes, and examination of the anterior segment was normal. Fundus examination showed bilateral optic disc edema, star-like hard exudates around the optic disc and fovea, arteriovenous changes, and a few flame-shaped hemorrhages (Figure 1 A, D). In addition, RPE changes including Elschnig spots were visible outside the arcuate. FFA revealed bilateral optic disc hyperfluorescence increasing in the late phase and hypofluorescence in the zones we thought to be Elschnig spots (Figure 1B, E). Macular thickness measurements using SD-OCT revealed increased thickness. Increased reflectivity and SRF were seen on the nasal side of the macula because of the hard exudates (Figure 1 C, F). Measurements of subfoveal choroidal thickness measurements were performed using enhanced depth imaging optical coherence tomography (EDI-OCT). Retinal nerve fiber layer (RNFL) measurements revealed an increase in each quadrant in favor of optical disc edema (Table 1). OCTA macula was used to evaluate superficial, deep capillary density and en face images (Figure 1 G, H, I). OCTA disc was used to evaluate the nerve head, radial peripapillary capillary density, and en face images (Figure 1 J, K). Vascular flow was assessed in both the macular and disc regions (Tables 1 and 2).
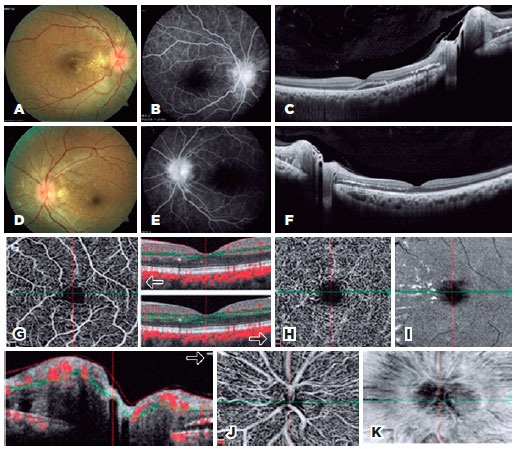
Blood tests revealed a creatinine level of 6 mg/dL and blood urea nitrogen (BUN) level of 65 mg/dL. Serology results were negative. Cardiologic evaluation revealed that his systolic blood pressure was 260 mmHg, and diastolic blood pressure was 140 mmHg. Neurological evaluation was normal. Following the nephrology consultation, the patient was diagnosed with MHT and chronic renal failure and thus put on dialysis.
At 6-month follow-up, bilateral visual acuity was 20/20. Fundus autofluorescence imaging revealed regression in the signs of MHT (Figure 2 A, B, D, E), and FFA was not performed on the advice of the nephrology department. SD-OCT macular thickness measurements revealed thinning and total resolution of SRF (Figure 2 C, F). RNFL measurements showed regression of optical disc edema in all quadrants (Table 1). Subfoveal choroidal thickness in the right eye was 337 µm on the first day and 328 µm at 6 months and in the left eye was 402 µm on the first day and 343 µm at 6 months.
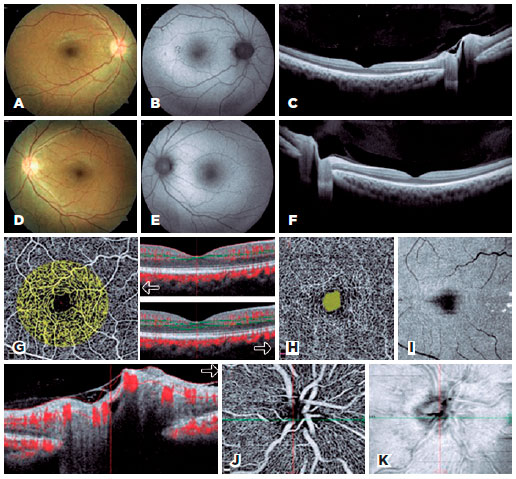
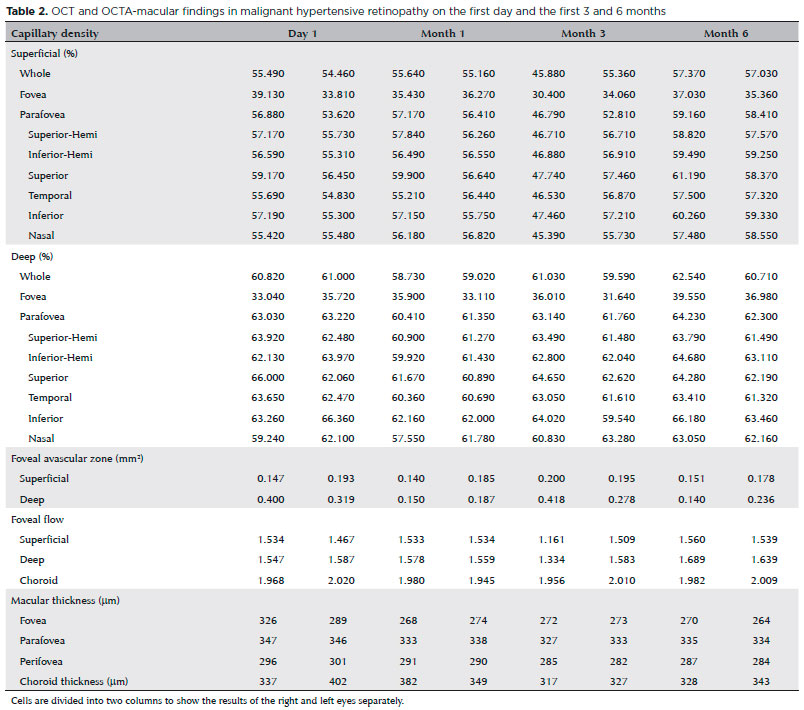
OCTA macula and disc were used to evaluate flow, foveal avascular zone (FAZ), density, and en face images at 6 months (Figure 2G, H, I). OCTA macula measurements did not show capillary density loss. OCTA foveal flow measurements were increased in all segments except the outer segment (Table 2). No enlargement was found either in the superficial or deep FAZ. OCTA disc measurements did not show a marked nerve head or loss of radial peripapillary capillary density (Figure 2 J, K). Flow measurements revealed increased choroidal flow and no perfusion loss in the other segments (Table 1).
At 6-month follow-up, a systemic assessment of the patient revealed that blood pressure was normal, creatinine was 3.2 mg/dL, and BUN was 38 mg/dL. Renal transplantation was performed at an external center.
DISCUSSION
In systemic hypertension, vascular endothelial structure, blood-retina barrier, and autoregulation mechanism are affected. Retinopathy evaluation assesses damage to other organs. In their study, Ahn et al., used fundoscopy and OCT in combination and reported that visual prognosis was correlated with SRF level rather than fundoscopic images in patients with severe hypertension, and blood pressure control also resulted in regression of retinal and choroidal thickness(2).
Manjunath et al. found that choroidal thickness in healthy individuals measured 272 ± 81 µm, and Osmanbasoglu et al. obtained measurements of 308.7 ± 64.5 µm(3,4). In our case, subfoveal choroidal thickness in the right eye measured 337 µm on the first day and 328 µm at 6 months and in the left eye 402 µm on the first day and 343 µm at 6 months. Following the improvement in blood pressure and decrease in choroidal permeability, we observed a fast regression in SRF and reduced retinal and choroidal thickness.
OCTA is a new imaging system that allows in-depth evaluation of retinal and choroidal microvascular structures without the use of contrast agent. In more common ischemic cases such as diabetic retinopathy, arterial-venous occlusions, FAZ enlargement, and capillary density loss were detected quantitatively using OCTA. As in the study by Falavarjani et al., OCTA also can perform vascular calibration measurements, but no specific study has used it for measuring hypertension(5).
Ghassemi et al. reported that superficial FAZ measured 0.22 ± 0.08 mm2 and deep FAZ was 0.31 ± 0.11 mm2 in normal eyes in their study(6). In our case, superficial FAZ was 0.147 mm2 on the first day and 0.151 mm2 at 6 months in the right eye, and it was 0.193 mm2 on the first day and 0.178 mm2 at 6 months in the left eye. Deep FAZ measured 0.400 mm2 on the first day and 0.140 mm2 at 6 months in the right eye, and it was 0.319 mm2 on the first day and 0.236 mm2 at 6 months in the left eye. No significant superficial and deep phase enlargement was observed after 6 months of follow-up.
Coscas et al. evaluated macular density and flow in healthy subjects using 3 × 3 mm OCTA examinations. Their findings included superficial layer-whole 53.91 ± 2.09 and deep layer-whole 59.36 ± 1.74(7). In our case, capillary density loss was not significant at the end of the sixth month, and there was no decrease in OCTA disc density and flow measurements at the end of the sixth month.
Rotsos et al. assessed choroidal blood flow at Elschnig points with OCTA and reported the results at 1 month(8). Similarly, Saito et al. compared focal choroidal ischemic areas and reperfusion in hypertensive choroidopathy following treatment with en face OCTA images(9). Both studies did not assess capillary density, FAZ, or flow. Grossi et al. compared OCTA results between the arterial hypertensive and normotensive group. Patients in the normotensive group had thicker choroids, whereas no vascular density differences were found(10). They emphasized that OCTA was potentially useful for detecting early pathological damage and assessing progression.
We followed our patient regularly for 6 months. His ocular symptoms improved, and no loss of vascular density or flow reduction was observed. We believe that our study will contribute to our current knowledge regarding MHT with OCTA results such as angiodisc and capillary density. Further studies on using OCTA more effectively for the diagnosis, staging, treatment, and prognosis of hypertensive retinopathy are needed.
REFERENCES
1. Stryjewski TP, Papakostas TD, Eliott D. Multimodal imaging of elschnig spots: a case of simultaneous hypertensive retinopathy, choroidopathy, and neuropathy. Semin Ophthalmol. 2017;32(4):397-9.
2. Ahn SJ, Woo SJ, Park KH. Retinal and choroidal changes with severe hypertension and their association with visual outcome. Invest Ophthalmol Vis Sci. 2014;55(12):7775-85.
3. Manjunath V, Taha M, Fujimoto JG, Duker JS. Choroidal thickness in normal eyes measured using cirrus-hd optical coherence tomography. Am J Ophthalmol. 2010;150(3):325-9.
4. Osmanbasoglu OA, Alkın Z, Ozkaya A, Ozpınar Y, Yazıcı AT, Demirok A. Diurnal choroidal thickness changes in normal eyes of turkish people measured by spectral domain optical coherence tomography. J Ophthalmol. 2013;2013:687165.
5. Falavarjani KG, Al-Sheikh M, Darvizeh F, Sadun AA, Sadda SR. Retinal vessel calibre measurements by optical coherence tomography angiography. Br J Ophthalmol. 2017;101(7):989-92.
6. Ghassemi F, Mirshahi R, Bazvand F, Fadakar K, Faghihi H, Sabour S. The quantitative measurements of foveal avascular zone using optical coherence tomography angiography in normal volunteers. J Curr Ophthalmol. 2017;29(4):293-9.
7. Coscas F, Sellam A, Glacet-Bernard A, Jung C, Goudot M, Mierre A, et al. Normative data for vascular density in superficial and deep capillary plexus of healty adults assessed by optical coherence tomography angiography. Invest Ophthalmol Vis Sci. 2016;57(9):211-23.Comment in: Invest Ophthalmol Vis Sci. 2016;57(15):6713.
8. Rotsos T, Andreanos K, Blounas S, Brouzas D, Ladas DS, Ladas ID. Multimodal imaging of hypertensive chorioretinopathy by swept-source optical coherence tomography and optical coherence tomography angiography. Medicine. 2017;96(39):e8110.
9. Saito M, Ishibazawa A, Kinouchi R, Yoshida A. Reperfusion of the choriocapillaris observed using optical coherens tomography angiography in hypertensive choroidopathy. Int Ophthalmol. 2017 Sep 11, doi: 10.1007/s10792-017-0705-1.
10. Grossi A, Agostinis M, Moretti S, Tandurella N, Cavalaro G, Pierobon V, et al. Optical coherence tomography angiography and arterial hypertension: a role in identifying early vascular damage?. J Hypertension [Internet]. 2017;35. [cited 2018 may 24]. doi:10.1097/01.hjh.0000523746.72523.be.
Submitted for publication:
March 7, 2018.
Accepted for publication:
July 24, 2018.
Funding: No specific financial support was available for this study
Disclosure of potential conflicts of interest: None of the authors have any potential conflicts of interest to disclose

How to cite this article:
 ABO is licensed under a Creative Commons Attribution-NonComercial 4.0 Internacional.