

Jocelyn Faubert1; François Bellavance2
DOI: 10.1590/S0004-27492003000600010
ABSTRACT
We assessed temporal modulation visual fields (TMFs) for 91 observers including controls, Parkinson patients and members of the James Bay Cree community of Northern Québec suspected of being chronically exposed to relatively low levels of methyl-mercury. The main goal was to establish the feasibility of using such procedures to rapidly evaluate visual function in a large field study with the James Bay Cree community. The results show clear normal aging effects on TMFs and the pattern of loss differed depending on the flicker rates used. Group data comparisons between the controls and the experimental groups showed significant effects only between the Cree and normal controls in the 40 to 49 year-old age category for the low temporal frequency condition (2 Hz). Examples of individual analysis shows a Cree observer with severe visual field constriction at the 2 Hz condition with a normal visual field at the 16 Hz condition and a reverse pattern was demonstrated for a Parkinson's patient where a visual field constriction was evident only for the 16 Hz condition. The general conclusions are: Such a technique can be used to evaluate the visual consequences of neuropathological disorders and it may lead to dissociation between certain neurotoxic and neurodegenerative effects depending on the parameters used; this technique can be used for a large field study because it is rapid and easily understood and performed by the subjects; the TMF procedure used showed good test-retest correlations; normal aging causes changes in TMF profiles but the changes will show different patterns throughout the visual field depending on the parameters used.
Keywords: Neurotoxicology; Parkinson's disease; Visual fields; Aging; Neurobehavioral tests
RESUMO
Assessou-se os campos visuais de modulação temporal (CMTs) de 91 observadores incluindo controles, pacientes parkinsonianos e membros da comunidade de James Bay Cree do norte de Quebec, suspeitos de terem sidos expostos cronicamente a níveis relativamente baixos de metil-mercúrio. O objetivo principal foi estabelecer a possibilidade de utilização de tais procedimentos para avaliar rapidamente a função visual em um amplo estudo de campo com a comunidade de James Bay Cree. Os resultados mostraram claros efeitos normais do envelhecimento nos CMTs e o padrão de perda diferiu dependendo da taxa de piscamento utilizada. As comparações de dados de grupo entre os grupos-controle e os grupos experimentais mostraram efeitos significativos somente entre os Cree e os controles normais na categoria de 40 a 49 anos de idade para as condições de baixa freqüência temporal (2 Hz). Exemplos de análises individuais mostraram um observador Cree com constrição severa do campo visual na condição de 2 Hz, mas com campo visual normal na condição de 16 Hz, e um padrão invertido para um paciente parkinsoniano para o qual uma constrição do campo visual foi evidente somente para a condição de 16 Hz. As conclusões gerais foram: tal técnica pode ser empregada para avaliar as conseqüências visual de transtornos neuropatológicos e pode conduzir à dissociação entre certos efeitos neurotóxicos e neurodegenerativos, dependendo dos parâmetros empregados; esta técnica pode ser empregada em estudos de campo amplos porque é rápido e facilmente entendido e realizado pelos sujeitos; o procedimento de CMT empregado apresentou boas correlações teste-reteste; envelhecimento normal causou mudanças nos perfis CMT, mas as mudanças irão apresentar diferentes padrões ao longo do campo visual dependendo dos parâmetros empregados.
Descritores: Neurotoxicologia; Doença de Parkinson; Campo visual; Envelhecimento; Testes neurocomportamentais
INTRODUCTION
Context
In 1994, the Cree Board of Health and Social Services of James Bay (CBHSSJB), headed by Dr. Charles Dumont, the scientific director, approached Jocelyn Faubert to inquire on the possibility of participating in a large, multidisciplinary study, on the effects of longterm exposure to methyl-mercury by the James Bay Cree community. Specifically, the role was to determine the feasibility of developing visual assessment procedures that were fast, reliable, and specific enough to establish differential effects of chronic methyl-mercury exposure. The ultimate goal was to perform a large epidemiological field study at the James Bay site in northern Québec (Canada) where several teams including neurologists, kinanthropologists, and visual psychophysicists would evaluate members of the Cree community for possible neurotoxic effects from chronic methyl-mercury exposure. Here we present the results of this feasibility study of the visual psychophysics that included the testing of normal aging controls, Parkinson patients, and Cree observers.
Literature review related to methyl-mercury exposure and vision
Little systematic assessment of visual function has been performed in the evaluation of methylmercury poisoning. This is particularly true for the James Bay Cree where the assessments performed as part of studies during the late 1970s have been visual acuities and visual fields with conventional methods using devices such as the Goldmann perimeter(1,2). These results have been nconclusive, likely because the evaluation of visual acuities and luminance threshold visual fields are limited in their assessment of visual functions. There are many examples of loss of visual function due to neuropathologies of vision in the absence of acuity and field loss(3-5).
Based on results from studies of non-human primates, evaluation of the ability to see objects of various sizes and contrasts (spatial vision) and to see objects varying in time and contrasts (temporal vision) appears to detect neurotoxic effects of methyl-mercury much earlier than other visual and motor dysfunctions(6-7). Further, there is evidence that the assessment of peripheral vision may be critical for early detection of methyl-mercury neurotoxicity(6). This makes the evaluation of the visual fields necessary to optimize functional evaluation. However, data on methyl-mercury exposure demonstrates that large doses are generally necessary to observe a visual field constriction for standard luminance detection tasks (i.e. a loss of sensitivity in the peripheral visual field and relative sparing of central vision). For the reasons mentioned above and based on data obtained from other patient populations where visual field assessments are critical in early diagnosis and monitoring (e.g. glaucoma, multiple sclerosis and optic neuritis) we propose to combine the method of visual field assessment and temporal sensitivity by assessing temporal modulation visual fields (TMF).
Two models of methyl-mercury exposure and visual performance
The acute exposure model:
The initial studies of methyl-mercury exposure in Minamata, Japan and Iran have demonstrated that vision is very much affected by methyl-mercury neurotoxic effects. The general pattern has been an initial loss of the peripheral visual field (side vision loss or visual field constriction) and ultimately blindness(8). Merigan(6) developed a non-human primate model of acute and large exposure levels of methyl-mercury and found evidence, as in the reports on the Minamata incident, for visual field constriction. He also tested the ability to perceive contrast for temporally modulated (flickering) stimuli (temporal contrast sensitivity) and found that the contrast required to detect higher temporal frequencies (fast flicker) was higher for the monkeys exposed to the neurotoxin as opposed to the controls.
The chronic exposure model:
The problem with the model above is that it does not adequately represent the population of interest for the present study. In fact, most human populations exposed to methyl-mercury, such as the Cree of James Bay, are exposed to low levels of methyl-mercury for long time periods (chronic exposure). To address this problem Rice and colleagues(7,9) developed a chronic non-human primate model where experimental monkeys were exposed to low levels of methyl-mercury for longer periods. The results show that the ability to see contrast was also affected but for low temporal frequencies as opposed to higher temporal frequencies in the acute Merigan model. What was particularly interesting in the Rice studies is that, even after exposure was terminated for many years, the monkeys which initially demonstrated visual deficits were the ones which ultimately developed neuro-motor symptoms of neurotoxicity several years later.
Neurophysiological mechanisms of the visual system
The differences in response patterns between the chronic and acute models mentioned above lead us to explore the possible underlying neurophysiological mechanisms that may be responsible for these selective impairments.
Parvocellular (sustained) and Magnocellular (transient) Pathways:
The mammalian visual system is segregated early in the retina where alpha and betatype ganglion cells have evolved specialized functions for spatio-temporal stimuli. The alpha type cells project to the ventral or magnocellular (M) layers of the Lateral Geniculate Nucleous (LGN) of the Thalamus whereas the beta type cells project to the dorsal layers of the LGN also called parvocellular (P) layers(10). Thus it has been suggested that when information reaches the cortex via the separate M and P layers of the LGN a division has occurred between the processing of pattern-color, on the one hand, and motion, depth and spatial orientation, on the other(11) although it is now widely acknowledged that the two pathways cannot be considered parallel for processing different visual attributes(12).
Studies in monkeys indicate that selective damage to the P pathway produces visual acuity deficits(13) and reduces contrast sensitivity to medium to high spatialfrequency and low temporal frequency stimuli(13,14). Studies of selective M pathway lesions indicate that high temporal-frequency and low spatial frequency vision depends on the M instead of the P pathway(13-15).
In summary, if neurotoxicity from methyl-mercury produces a selective damage to the sustained system (P pathway) we should expect a decrease in contrast sensitivity for medium to high-spatial frequency and low temporal frequency stimuli (smaller objects flickering slowly). If a selective damage to the transient system (M pathway) results from neurotoxicity then a selective contrast sensitivity deficit for low-spatial and high temporal targets is expected (large objects at high flicker rates). As will be mentioned later, the development of the test used in the present study was based on these underlying principles.
Limitations in test development and test requirements
The present study was implemented to assess whether a rapid, reliable test could be developed for a large, multidisciplinary, field study to be done at a later stage where each participant has a very limited time to perform the evaluations. For this reason we had several factors to account for when designing the test.
One consideration was that the test used measured actual visual deficits which might occur from methyl-mercury exposure considering the different models proposed in the literature and from what we know of the visual system. The test had to be as little as possible contaminated by extrinsic or intrinsic factors such as optics of the visual system, cultural differences, etc., while testing under natural viewing conditions. Another major consideration in designing the test was the limitation of time allotted for each type of measurement in the final, multidisciplinary, field study. We were allotted a maximum of only 30 minutes for visual assessments. Like any good test, it has to be reliable from one evaluation to the next. It must also be reasonably void of fatigue effects.
Temporal modulation visual fields (TMF)
As mentioned above, we wanted a test which could allow us to measure the following visual characteristics simultaneously; 1) the visual field because of the evidence for initial visual field constriction losses observed in methyl-mercury poisoning; 2) contrast sensitivity for smaller and slowly flickering targets as would be suggested from the chronic monkey model(9); 3) contrast sensitivity for larger targets with high flicker rates to assess the possible effects which were evident in the acute model(6).
Standard color testing and standard perimetry excluded
If time permitted, color and standard visual field tests would normally have been included in the testing battery. However, the goal of the present study was to develop a testing procedure that would maximize the information in a relatively short testing time. For this reason, and due to the limitations mentioned below in regards to color and standard visual fields, we determined that TMFs was the most appropriate measure.
Although there is evidence that color vision is affected by neurotoxicity it was excluded from the present study for a number of reasons. First, it does not allow us to measure the visual field and contrast sensitivity (with the standard testing procedures) which are the two measures that have been demonstrated to be affected in the two models mentioned above. It does not allow us to contrast the pathophysiological characteristics mentioned above since it measures essentially the function of the P pathway alone. More importantly, it is affected by several extraneous factors such as visual optics and cultural differences. It is well known that differences of the optics of the eye affect our perception of color. We know relatively little about the optics of the Cree of James Bay and it would be very difficult to control individual differences on site in the large, multidisciplinary, field study that would follow.
Standard perimetric procedures were also excluded for similar reasons. First, they do not allow us to contrast the two systems mentioned above. Further, to do a reasonable test the procedures are generally long and complicated for the observer. Standard perimetry testing, particularly in the central visual field, is also much affected by the optics of the eye. Finally, the standard perimetric devices are generally large and difficult to transport in remote areas.
TMFs:
Temporal modulation fields evaluate the contrast sensitivity of an individual throughout the visual field for different spatio-temporal combinations(16-17). It has been previously demonstrated that the assessment of TMFs will detect early peripheral loss in glaucoma(4,18), multiple sclerosis(19-21), and central loss in optic neuritis and other visual pathologies(5,22). In all these studies TMF has detected precocious damage prior to all other standard ophthalmological assessments such as standard visual field measurements with Goldmann perimeters, automated perimeters (Humphrey and Octopus) and visual acuity measures. Further, TMFs were abnormal in ocular hypertensive patients at risk of developing glaucoma, particularly in the peripheral visual field, while other functions were normal(4). TMF results also correlate with measurements of the neuro-retinal rim area of the optic nerve head which represents anatomical damage of the optic nerve axons(18).
There are other reasons for assessing TMFs over standard visual field assessments in this study. One is that TMFs are fairly robust and are little affected by poor refraction: under certain conditions a temporal stimulus can be defocused for up to 10 diopters without affecting sensitivity(23,24). Further, the most detrimental optical aberration in degrading visual performance is the transverse chromatic aberration (TCA). TCA is naturally present to a varying degree in the eye and can also be induced by corrective lenses. This aberration can degrade visual performance twice as much as optical blur on spatial contrast sensitivity but has little effect on temporal modulation sensitivity(25). Another reason for using the TMF procedure is that one can bias the response to either of the two main visual mechanisms mentioned above by manipulating target size and, particularly, temporal frequency(14). Using slower flicker rates would favor the sustained mechanism (smaller cells) and using a larger target at a higher temporal rate would bias the transient system (larger cells).
METHOD
Apparatus and Software:
TMF assessments are not available as ready-made tests. All the studies previously mentioned were performed with equipment specially developed in a laboratory for this usage(16). We developed such a setup on a Macintosh IIcx (also works with Powerbook portable models) computer system with customized software developed by JF. The software was developed to assess temporal modulation throughout a 40 deg visual field. A standard 13" Macintosh computer screen was used as stimulus display. This monitor size was selected for two reasons. The first is because it is a light monitor and easily portable. The second is because these monitors tend to be much more stable in chromaticity and luminance than large screen monitors. A forehead and chin rest was used to stabilize the head and maintain fixation position. A small camera with viewing monitor was used to track eye position of the observer.
TMF Characteristics and Procedure:
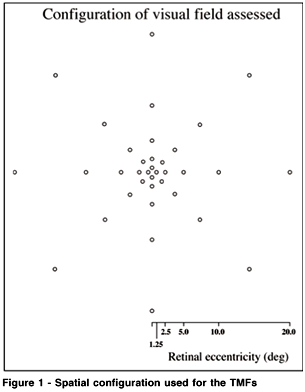
The configuration of the visual field assessed is demonstrated in Figure 1. Eight points were assessed for each of five retinal eccentricities used which are 1.25, 2.5, 5.0, 10.0, and 20.0 deg of visual angle respectively for a total of 40 retinal positions (See Figure 1). These eccentricities were proposed because they have been widely used in the assessment of TMFs in normal and neuro-ophthalmological pathology groups(4,5,16,18-20). The stimulus was modulated in time about a mean luminance. The dependent measure is the depth of modulation or the amount of contrast necessary between the dark and bright points of a temporal sinusoidal function to detect a flicker (see Figure 2). Each potential test point was randomly selected. When selected, an auditory signal indicated a trial. For each trial a random delay of 500 to 3000 ms was used to avoid a conditioned time based response bias. Fixation was controlled by viewing eye position with a camera system.
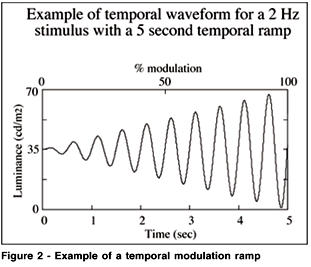
The CRT background was maintained at a mean luminance of 35 cd/m2. Testing was always performed in a dark room with the monitor as the only source of light. A slow temporal ramp (60 sec) was used to avoid interactions with the temporal component of the stimulus, one of the independent variables, and the actual onset and offset of the temporal stimulus and to minimize the effect of reaction times. Previous research has shown that this procedure produces reliable results(16). Once all the points were collected, an automated statistical procedure determined deviant points and these points were automatically repeated in random order. This was performed to eliminate obvious deviations that may have occurred due to blinking or other distractions. The replications were taken as the correct value for future analysis. A statistically deviant point was defined as a point representing a sensitivity of two standard deviations (sd) away from the geometrical mean of its given eccentricity or two sd away from the geometric mean of all the points in the field. Finally, data was automatically stored. Two parameter combinations were assessed. The first consisted of a 1.0 deg target size flickering at 2 Hz and the second consisted of a 2.0 deg target flickering at 16 Hz.
Specific calibration routines:
One of the most critical and often misunderstood aspects of developing a computerized psychophysical testing procedure is the process used to determine the appropriate calibration of the combined computer and CRT systems. In this particular instance, the system was calibrated using a sophisticated procedure that allows us to have a good control over the luminance, and chromaticity of our screen at all times. First, no linearity and independence of the guns was assumed(16). Thousands of DAC (digital to analog converter values) combinations obtained from the three guns were assessed for their exact luminance and chromaticity using a photometer/chromameter (Minolta chromameter CS-200). The photometer/chromameter system is necessary because it allows us to determine both the chromaticity and luminance of the gun combinations (shifts in chromaticities alone can cause different sensitivity values). Based on the obtained values, functions were generated for each gun to allow precise interpolation of the desired luminance and chromaticity on the computer screen. The spectroradiometric characteristics of the individual red, green, and blue guns, and the standard D-65 white of the Trinitron P22 phosphor used in this study have been reported elsewhere(27,28).
Subjects:
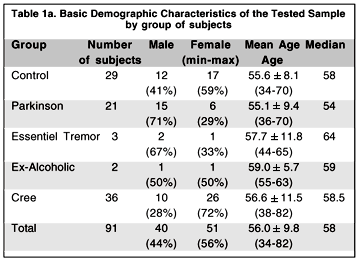
We tested three groups of subjects in two phases. In the first phase a group of 29 normal controls and a group of 21 observers diagnosed as having Parkinson's disease were tested in the Department of Kinanthropology at the Université du Québec à Montréal. In the second phase, which took place five months later, a group of 36 Cree observers participated in the study and were tested in the office of the CBHSSJB in Montréal. The Parkinson and Cree groups were approximately the same age as the control group (see Table 1a for demographic information of the different groups and Table 1b for the level of mercury exposure of the Cree subjects). We also tested two ex-alcoholics and three subjects with "essential tremor" in the first phase. Because there is no expected difference between the essential tremor and control subjects as far as visual sensitivity is concerned (this in fact was confirmed by their responses that were well within normal ranges) we have incorporated them in the control group data. The group of ex-alcoholics was too small to be included in any comparison analysis.

General study procedure:
Upon arrival of the subject, the examiner briefly explained what the task was. In this case the subject was simply instructed to press a computer mouse when he/she saw a flickering light which could be presented at any location on the screen at any given time. The subjects were shown what the stimulus looked like before the actual testing. In the case of the Cree subjects, the instructions were given by a translator (when necessary) to the subjects. All subjects were told to fixate straight ahead and eye movements were monitored with a video eye monitoring system. Only the right eye was tested for all subjects. The Cree subjects appeared to understand the procedures quite well and there were no instances where the testing was not completed because of miscomprehension.
Test re-test:
In the first phase, the normal control and the Parkinson groups were tested twice on each condition while the Cree were tested only once in the second phase because of time constraints. Hence, we established the effect of test re-test and fatigue within the same session in the first phase only. For a given subject in the control and Parkinson groups we randomly selected one of the two temporal frequency conditions (2 Hz vs. 16 Hz) as the first testing sequence. We counterbalanced the testing so that the conditions were always interlaced. That is, if the 2 Hz condition was initially selected, the next testing sequence consisted of the 16 Hz condition followed by the 2 Hz condition again to finish with the 16 Hz condition. i.e. the sequence was 2 Hz, 16 Hz, 2 Hz, 16 Hz. If the initial TMF condition was 16 Hz then the next condition was 2 Hz etc. i.e. the sequence was 16 Hz, 2 Hz, 16 Hz, 2 Hz. This allowed us to determine whether there were fatigue effects, in which case the re-test session would be worse than the first, or practice effects, where the re-test condition would be better than the first.
RESULTS
I - Validity of the testing procedure
1) Feasibility:
The main purpose of this pilot study was to establish whether it was possible to develop a TMF testing system that was portable, reliable, and was well accepted by the population of interest for the large-scale study. The specifics of the results are presented below and confirm both that the test is reliable and portable given that all the testing was done outside of our own laboratories. In regards to the acceptability of the testing procedure by the Cree population, 31 of the Cree subjects tested were briefly interviewed by a translator after the testing session and the following results were obtained: 97% said that the explanations were clear; 65% found the tests easy; the length of the testing session was perceived short by 19% of them, correct by 55% and long by 26%. Therefore, the responses of the subjects to the three questions show that the tests were generally well received and understood by the Cree observers and that a field study at the James Bay with the Cree population could be conducted.
2) Test-retest reliability:
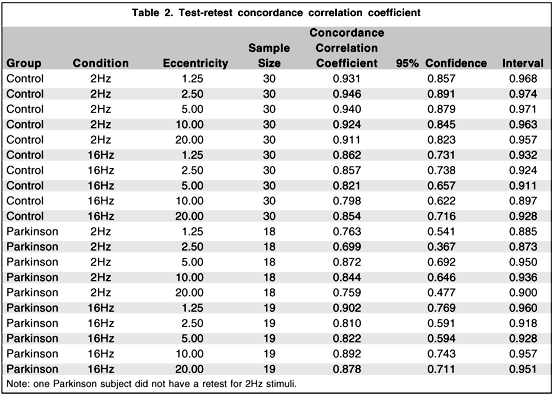
The test-retest procedure done on the normal controls and the Parkinson group, for each condition and eccentricity, shows good agreement between the first and the second testing as demonstrated by high concordance correlation coefficients(29) varying from .699 to .946 (Table 2).
3) Normal aging effect:
Given that the measure of TMFs, like many visual functions(30,31), could be affected by aging we must first establish whether there is a selective effect of age on TMFs. Because we had very few subjects that were below the age of 40 years and above the age of 70 years, these subjects were excluded from the following analysis. This includes one subject from the normal group, three subjects from the Cree group, and one subject from the Parkinson group. Furthermore, two additional subjects in the Parkinson group were excluded from the analysis. One subject could not maintain central fixation appropriately during testing because of a back problem and there was an error in data recording with another subject. One subject in the control group was also excluded from the analysis because he/she was not tested on all conditions. We therefore included 78 subjects in the final analysis. To evaluate the effect of normal aging on TMFs we have broken down the sample into three separate decades: 40-49, 50-59, and 60-70. The final subject distribution in the respective decade categories mentioned above includes; seven, ten, and 13 subjects respectively in the control group for a total of N=30; nine, eight, and 13 subjects respectively in the Cree group for a total of N=30; and four, six, and eight subjects respectively in the Parkinson group for a total of N=18.
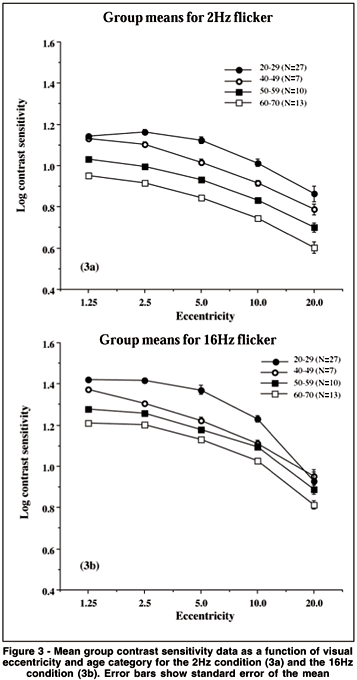
Figure 3a demonstrates the effect of age for the 2 Hz condition and figure 3b represents the effect of age on the TMFs obtained for the 16 Hz condition in the control group. The results are presented as contrast sensitivity values (y-axis) as a function of visual eccentricity from fixation (x-axis). For comparison, we also plotted in figures 3a and 3b values obtained for a younger age group (20-29, N=27) in another study, which were tested under similar conditions (same mean luminance and testing protocol)(26). The data clearly show that all subjects perform better (i.e. higher log contrast sensitivity values) for the higher temporal frequency condition (16 Hz) than the lower temporal frequency condition which confirms previous results(16). The figures further show that the effect of age on temporal contrast sensitivity is represented as an overall loss of sensitivity in the visual field for the lower temporal frequency condition (2 Hz). At the higher temporal condition (16 Hz) we find that the decrement may first appear in the central visual field and then extends out in the periphery. This aging effect is another factor that attests of the validity of the TMF measurements. When comparing the present data with that of younger observers from a previous study(26) we can observe that the initial loss of sensitivity observed for the 40 year-old group is not central (at the fovea) but appears first in the periphery or midperiphery. This would imply a neural component as opposed to an optical one.
II - Secondary analyses: Comparison of the three groups of subjects
Although the main objective of this research project was the development of a portable and reliable TMF testing system with testing procedures easily understood and accepted by the Cree population, it is of interest to perform secondary analyses comparing levels of contrast sensitivity among the three groups of subjects who participated in the study. Table 3 presents the mean and standard deviation of the log contrast sensitivity for each group by age condition and eccentricity. A four-way analysis of variance (ANOVA) model with repeated measures on two-factors was conducted to evaluate the effect of these different factors. The main results and selected contrasts are summarized in Table 4. The main effect of age is statistically significant (p < .01) while the group and the group by age interaction do not show statistically significant effects.
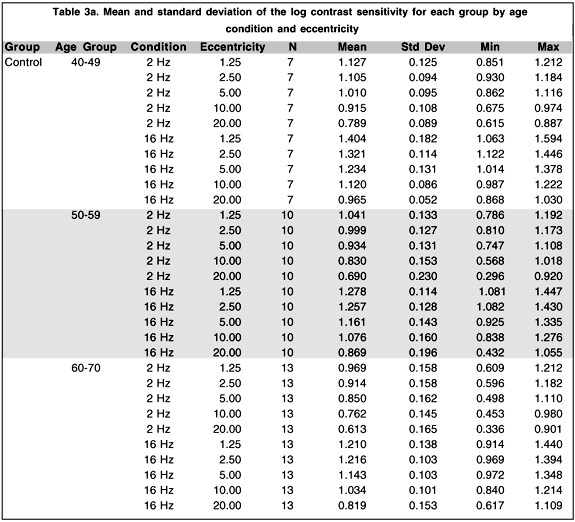
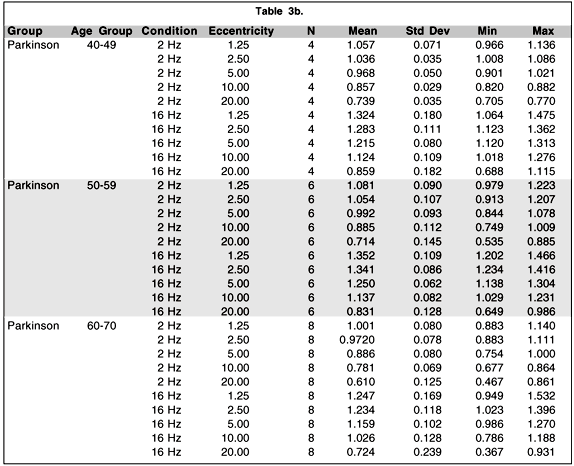
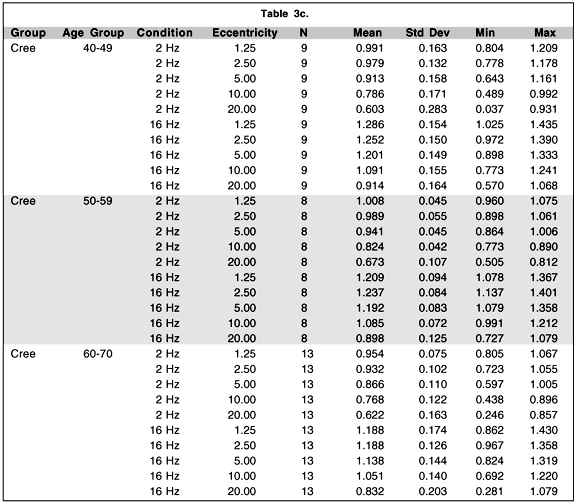
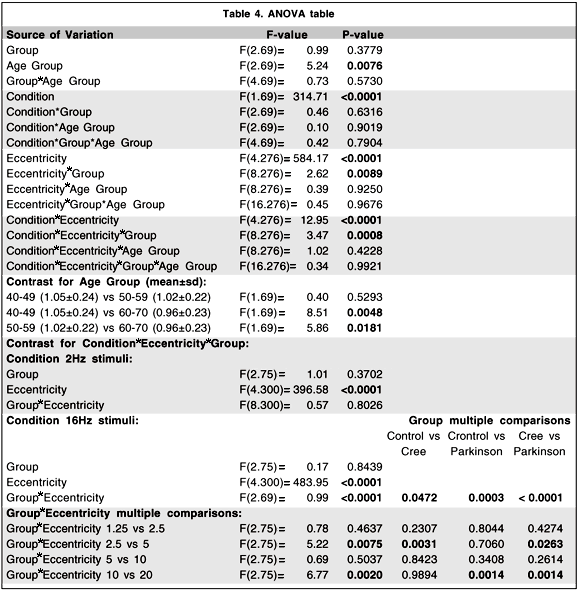
The conditions of temporal frequency (p < .0001) and eccentricity (p < .0001) show, as expected, significant differences. Interestingly, two interactions show statistically significant effects: The eccentricity by group interaction (p < .01) and the temporal frequency by eccentricity by group interaction (p < .001).
When we break down the temporal frequency by eccentricity by group interaction we find that the contrasts which distinguish the groups significantly are contained within the 16 Hz condition. In this condition we find that there are significant group by eccentricity interactions (control vs. Cree, p < .05; control vs. Parkinson, p < .001, Cree vs. Parkinson, p < .0001). If we break it down even further we find that it is the difference between the sensitivity obtained for the 2.5 and 5.0 deg eccentricities that best distinguishes the Cree from the other two groups (Cree vs. control, p < .01; Cree vs. Parkinson, p < .05) while it is the difference between the 10 and 20 deg conditions that best distinguishes the difference between the Parkinson group and the other two groups (Parkinson vs control, p < .01; Parkinson vs. Cree, p < .01).
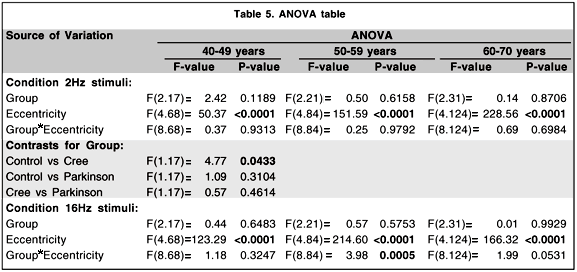
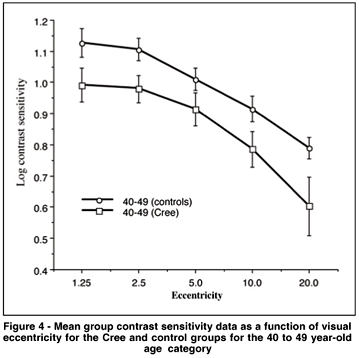
Additional ANOVAs which focus on the differences between groups for the specificage categories (see Table 5) show that the difference which is apparent between the Cree group and the controls for the younger age category illustrated in figure 4 is statistically significant (p < .05).
A group analysis such as an ANOVA can override individual cases of obvious visual sensitivity loss that may have clinical significance. To best visualize the individual results of the Cree group vs. the controls, and the Parkinson group vs the controls, we represent the individual data as compared to a 95% confidence interval calculated from all our subjects over the age of 40 from the control group. The 95% confidence interval here is calculated as the mean ± 2 sd. These data are shown in Figures 5 to 8 for all the testing conditions. We chose all subjects over 40 to establish the range because we should ultimately get more subjects in each age category to establish meaningful confidence intervals. In this way we are being very conservative about deciding that the cases which fall beyond this confidence range represent abnormal sensitivity profiles.
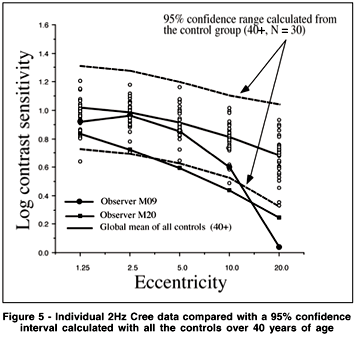
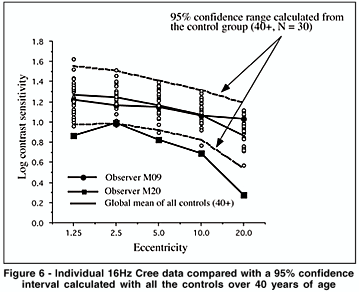
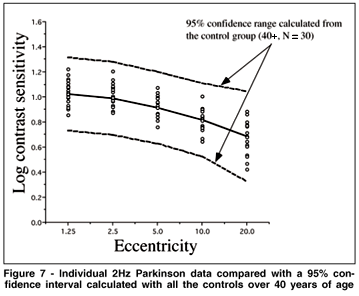
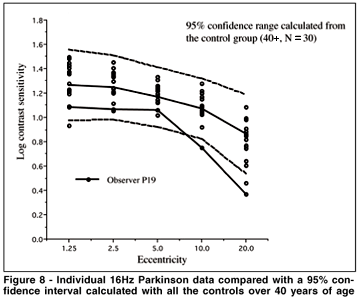
We can see in Figure 5 that subject M09 of the Cree group shows a clearly abnormal curve for the 2 Hz condition and a normal sensitivity curve for the 16 Hz condition (Figure 6). This selective loss is particularly interesting because it represents a classic case of visual field constriction because we observe a sharp fall-off with eccentricity while the central visual field remains within normal range. Subject M20 shows abnormal sensitivity for both temporal frequency conditions. The Parkinson group generally falls within the normal confidence range for the 2 Hz condition but some observers start falling out of the range for the 16 Hz condition (for example, subject P19).
To illustrate the extent of the selective visual loss incurred by subject M09 (Cree) for the 2 Hz flicker and subject P19 (Parkinson) for the 16 Hz flicker, we have plotted grey scale maps with the point-by-point representation of the values. These maps are plotted on an octave scale so that every eccentricity shown represents twice the previous distance in visual angle. In figure 9, we compare the data from M09 to that of the mean data for the same age group (40-49). In the top of the figure we can observe the mean control map for the 2 Hz condition on the left and the individual M09 data for the same condition on the right. The bottom row follows the same sequences for the 16 Hz data. What is striking is that there is a severe constriction of the visual field for the 2 Hz M09 data and no constriction for the 16 Hz data. Figure 10 shows the exact reverse pattern for subject P19 where a constriction is most evident for the 16 Hz condition.
GENERAL DISCUSSION
Clearly, the results of the pilot study show that the process was a success in relation to the initial specific goals set by the research team for this initial phase. These goals were that the tests administered would be portable, reliable, repeatable, relatively short in testing time and well accepted by the subject population of interest. In this sense, it is clear that the testing procedure presently developed could be implemented in the James Bay area or any other place where study subjects are located.
Another important result obtained from this preliminary study is the effect of normal aging processes on TMF sensitivities. This implies several things. The first implication is that our method for measuring visual sensitivity throughout the visual field is quite sensitive. The subject population that composed our control group all had good functional vision given that our criterion was that they could read newspaper print comfortably. Nevertheless, there is a clear trend for sensitivity reduction between the three age groups as evidenced in figures 3 and 4. Furthermore, the difference by decade appears constant for the 2 Hz condition while the changes are first evident in the fovea and then generalize to the periphery for the 16 Hz condition. This also implies that we are indeed stimulating two different visual mechanisms when we are using such parameters. We also know that these results cannot be accounted for by optical density differences between the age groups given that it has been clearly demonstrated that optical distortions from blur or chromatic dispersion do not significantly affect temporal contrast sensitivity measurements for our parameter conditions(24-25).
These aging results also imply that the difference (or lack of difference) observed in our different subject groups, as compared to the controls, is not due to lack of sensitivity of TMF measurements. If we propose that neurotoxicity effects should represent some form of premature aging, then these measurements should be very sensitive to methyl-mercury poisoning.
Another implication of the aging results is that we must absolutely obtain a normative sample for a wide range of ages before we can directly apply this method for case by case analysis of methyl-mercury poisoning.
A surprising result is the lack of a group effect of Parkinson on visual sensitivity. Given that our method is so sensitive to the effect of normal aging, it should definitely be sensitive to any other changes due to neurological dysfunction. However, Parkinson is generally a disorder related to neuro-motor functions and not to visual sensitivity changes that may explain why no low-level changes in visual sensitivity were observed in this group. It is interesting that the evidence of loss observed for the individual analysis may show a selective transient-cell type visual sensitivity loss which has been previously suggested for Parkinson cases(32).
The results of the present study show no direct link between the known levels of methyl-mercury poisoning and TMF sensitivity. The group differences were not significant as a whole and a subgroup analysis between Cree subjects exposed to either high or low levels of mercury do not show any systematic link between dosage and sensitivity.
However, the younger group (40-49) clearly shows lower sensitivity as compared to the normal controls at the 2 Hz condition. Specifically, one subject clearly shows what is considered as a visual field constriction for the lower temporal frequency condition. What these results correspond to is not clear at this point. It may represent a demographic difference between the Cree group and the controls where the Cree sensitivity levels for the 40-49 group resemble the sensitivity profiles of older controls. This seems unlikely as being the reason and further studies must be done to confirm this effect.
The individual analysis in Figures 5 and 6 shows that two observers have abnormal sensitivity profiles. The most interesting case is that of subject M09, which shows a selective 2 Hz condition visual field constriction. This is noteworthy for three reasons. First it represents a selective frequency loss. Secondly, this loss is also selective for retinal eccentricity therefore representing a true visual field constriction as observed for the original Mynamata disease cases. Furthermore, it follows the profile predicted by the chronic exposure model presented in the introduction for methyl-mercury poisoning.
Finally, we have to stress that the Cree subjects who participated in this study were selected based on their general good health status because of the travel involved. A serious selection bias may have occurred and one needs to be cautious in the interpretation of the results of this small sample of Cree subjects.
CONCLUSIONS
In conclusion we have clearly demonstrated that our method is portable, reliable, well accepted by Cree subjects and very sensitive to age-related effects on visual thresholds which generally represent subtle changes in visual function(30-31). Therefore, these tests are ideally suited for assessing visual dysfunction produced by neurotoxicity effects. Furthermore, the different patterns of aging effects on the 2 Hz and 16 Hz conditions confirm the notion that we are indeed measuring two mechanisms with these parameters that may allow us to distinguish between separate visual pathways.
The present pilot study has demonstrated that the tests that we have designed are sensitive to subtle visual changes, have good test-retest reliability, and are easy to perform by subjects from a variety of populations including the Cree population. The conclusion is that such an assessment would prove useful and reliable if we were to assess a large population for neurotoxic effects from methyl-mercury exposure or exposure to any other neurotoxic substance. Future studies will have to establish a larger normative base to allow the use of such assessments in clinical environments.
REFERENCES
1. McKeown-Eyssen GE, Ruedy J, Neims A. Methylmercury exposure in northern Quebec I. Neurologic findings in adults. Am J Epidemiol 1983;118: 461-9.
2. Spitzer WO, Baxter DW, Barrows HS, Thomas DC, Tamblyn R, Wolfson CM, Dinsdale HB, Dauphinee WD, Anderson DP, Roberts RS, Palmer WH, Hollomby D, Reiher J, Alleyne BC, Helliwell BE. Methylmercury and the health of autochthons in northwest Quebec. Clin Invest Med 1988;11:71-97.
3. Bodis-Wollner I. Visual acuity and contrast sensitivity in patients with cerebral lesions. Science 1972;178:769-73.
4. Faubert J, Balazsi AG, Overbury O, Brussell EM. Multi-flash campimetry and other psychophysical tests in glaucoma. Doc Ophthalmol Proc Ser 1987; 49:425-32.
5. Overbury O, Brussell EM, White CW, Jackson WB, Anderson DP. Evaluating visual loss with multi-flash campimetry. Can J Ophthalmol 1984;19: 255-60.
6. Merigan WH. Visual fields and flicker thresholds in methylmercury-poisoned monkeys. In: Merigan WH, Weiss B, editors, Neurotoxicity of the visual system. New York: Raven Press; 1980, p.149-63.
7. Rice DC, Gilbert SG. Effects of developmental exposure to methylmercury on spatial and temporal visual function in monkeys. Toxicol Appl Pharmacol 1990;102:151-63.
8. Tsubaki T, Irukayama K. Minamata disease methylmercury poisoning in Minamata and Niigata, Japan. New York: Elservier; 1977.
9. Rice DC. Delayed neurotoxicity in monkeys exposed developmentally to methylmercury. Neurotoxicol 1989;10:645-50.
10. Livingstone M, Hubel DH. Connections between layer 4B of area 17 and thick cytochrome oxidase strips of area 18 in the squirrel monkey. J Neurosci 1987;7:3371-7.
11. Linvingstone M, Hubel DH. Segregation of form, color, movement, and depth: anatomy, physiology, and perception. Science 1988;240:740-9.
12. Merigan WH, Maunsell JHR. How parallel are the visual pathways? Annu Rev Neurosci 1993;16:369-402.
13. Merigan WH. P and M pathway specialization in the macaque. In: Valberg A, Lee BB, editors, From Pigments to Perception. New York: Plenum; 1991.
14. Merigan WH, Eskin TA. Spatio-temporal vision of macaques with severe loss of Pb retinal ganglion cells. Vision Res 1986;26:1751-61.
15. Merigan WH, Maunsell JHR. Macaque vision after magnocellular lateral geniculate lesions. Vis Neurosci 1990;5:347-352.
16. Faubert J. Effect of target size, temporal frequency and luminance on temporal modulation visual fields. In: Mills RP, Heijl A, editors, Perimetry Update 1990/91. Amsterdam/New York: Kugler Publications; 1991, p.381-90.
17. Casson EJ, Johnson CA, Nelson-Quigg JM. Temporal modulation perimetry: the effects of aging and eccentricity on sensitivity in normals. Invest Ophthalmol Vis Sci 1993;34:3096-102.
18. Faubert J, Balazsi AG, Muermans M, Brussell EM, Kasner OP. Multi-flash campimetry and optic nerve structure in early chronic open angle glaucoma. In: Heijl A, editor, Perimetry Update 1988/89. Amsterdam/New York: Kugler Publications; 1989, p.349-58.
19. Brussell EM, White CW, Bross M, Mustillo P, Borenstein M. Multi-flash campimetry in multiple sclerosis. Curr Eye Res 1981/82;1:671-7.
20. Mustillo P, Brussell EM, White CW, Anderson DP. Monitoring demyelination in multiple sclerosis with multi-flash campimetry. Int Ophthalmol 1984; 7:75-86.
21. White CW, Brussell EM, Overbury O, Mustillo P. Assessment of temporal resolution in multiple sclerosis by multi-flash campimetry. In: Breinin GM, Seigel IM, editors, Advances in diagnostic visual optics. Berlin: Springer-Verlag; 1983, p.239-46.
22. Galvin RJ, Regan D, Heron JR. Impaired temporal resolution of vision after acute retrobulbar neuritis. Brain 1976;99:255-68.
23. Lachenmyer BJ, Gleissner M. Flicker perimetry resist retinal image degredation. Invest Ophthalmol Vis Sci 1992;33:3539-42.
24. Tyler CW. Analysis of normal flicker sensitivity and its variability in the visuogram test. Invest Ophthalmol Vis Sci 1991;32:2552-60.
25. Faubert J, Simonet P, Gresset J. Effects of induced transverse chromatic aberration from an ophthalmic lens on spatio-temporal thresholds. Ophthalmic Physiol Opt 1999;19:336-46.
26. Faubert J. Visual processing throughout the visual field. In: IEEE Computer Society Press. Proceedings of the International Simposium on Computer Graphics, Image Processing and Vision. October 20-23, Rio de Janeiro, Brazil; 1998, p.2-9.
27. Faubert J. Seeing depth in colour: more than just what meets the eyes. Vision Res 1994;34:1165-86.
28. Faubert J. Colour induced stereopsis in images with achromatic information and only one other colour. Vision Res 1995;35:3161-7.
29. Lin L. A concordance correlation coefficient to evaluate reproducibility. Biometrics 1989;45:255-68.
30. Faubert J. Aging and visual perception. Can J Exp Psychol 2002;in press.
31. Spear PD. Neural bases of visual deficits during aging. Vision Res 1993;33:2589-609.
32. Arakawa K, Tobimatsu S, Kato M, Kira J. Parvocellular and magnocellular visual processing in spinocerebellar degeneration and Parkinson's disease: an event-related potential study. Clin Neurophysiol 1999;110:1048-57.
Correspondence to
Jocelyn Faubert
École d'Optométrie, Université de Montréal 3744
Jean-Brillant, Montréal, Québec, Canada, H3T 1P1
email: [email protected]
phone: 514-343-7289 / Fax: 514-343-7289.