INTRODUCTION
Pterygium is a wing-shaped ocular surface lesion described as an invasion of the bulbar conjunctiva onto the cornea(1). From the histopathological point of view, pterygium is a hyperplastic, centripetally directed growth of modified limbal epithelial cells accompanied by BL dissolution, epithelial mesenchymal transition, and activation of fibroblastic stroma associated with inflammation, neovascularization, and matrix remodeling, all of which are mediated through the combined actions of cytokines, growth factors, and matrix metalloproteinases(1,2).
The most often-cited factors suggested to have a role in the pathogenesis of pterygium are genetic factors, proinflammatory cytokines, and ultra-violet (UV) light(1-3). UV irradiation in the cornea has been shown to induce mutations in TP53 tumor suppressor genes in limbal basal cells and to upregulate many cytokines, angiogenic, and fibrogenic growth factors, such as interleukin (IL)-1, IL-6, IL-8, and tumor necrosis factor-α production(3,4). In addition, the expression of proteases, such as matrix metalloproteinases (MMPs), that degrade basement membrane and BL have been found to be elevated in the leading edges of pterygia(5). These proteases released by pterygium cells facilitate invasion by degrading basement membrane components, and dissolving BL and adjacent stromal matrix(5,6).
According to Hsu et al.(7) the above steps in the formation of a pterygium could also induce changes even in the deeper layers of the cornea, such as the Descemet membrane and endothelium. Current evidence published in 2014 regarding the deleterious effect of pterygium on corneal endothelium suggests that pterygium is related to a decrease in corneal endothelial cell density (ECD). However, only one paper has been published on this subject. The primary aim of this study was to investigate the effects of pterygium on corneal ECD.
METHODS
Study design
A cross-sectional study was conducted between September 1, 2015 and July 31, 2016 in accordance with the ethical principles of the Declaration of Helsinki and the principles of current Good Clinical Practices. The study protocol was approved by the local Institutional Review Board. All patients provided written informed consent. The study was designed by all the authors. The last author ensured the completeness and accuracy of the data and analyses of the study.
Study population
Patients were enrolled at only one site in Brasilia, DF, Brazil. Eligible patients were ≥18 years of age with unilateral pterygium and a good-quality endothelial cell count image assessed by noncontact specular microscopy. The contralateral eye of each patient served as a control. A comprehensive ophthalmic examination, including best corrected visual acuity, slit-lamp examination, Goldmann applanation tonometry, and fundus examination, was performed for all participants. The mean corneal power (KM) and corneal astigmatism (AST) in the 3.00-mm central zone were also evaluated for each patient by using a Zeiss Atlas 995 corneal topographer. The exclusion criteria were previous ocular surgery, trauma, uveitis, contact lens use in either eye, central cell count of <1800 cells/mm2, keratitis, glaucoma or intraocular pressure of >21 mmHg, and diabetes mellitus.
Color images of each eye with pterygium were acquired by using a slit-lamp-mounted camera phone (iPhone 5S; Apple, Inc.). The corneal surface area covered by the pterygium was estimated using the measuring tool of AutoCAD® software (version 19.1, Autodesk Inc., CA, USA) (Figure 1).
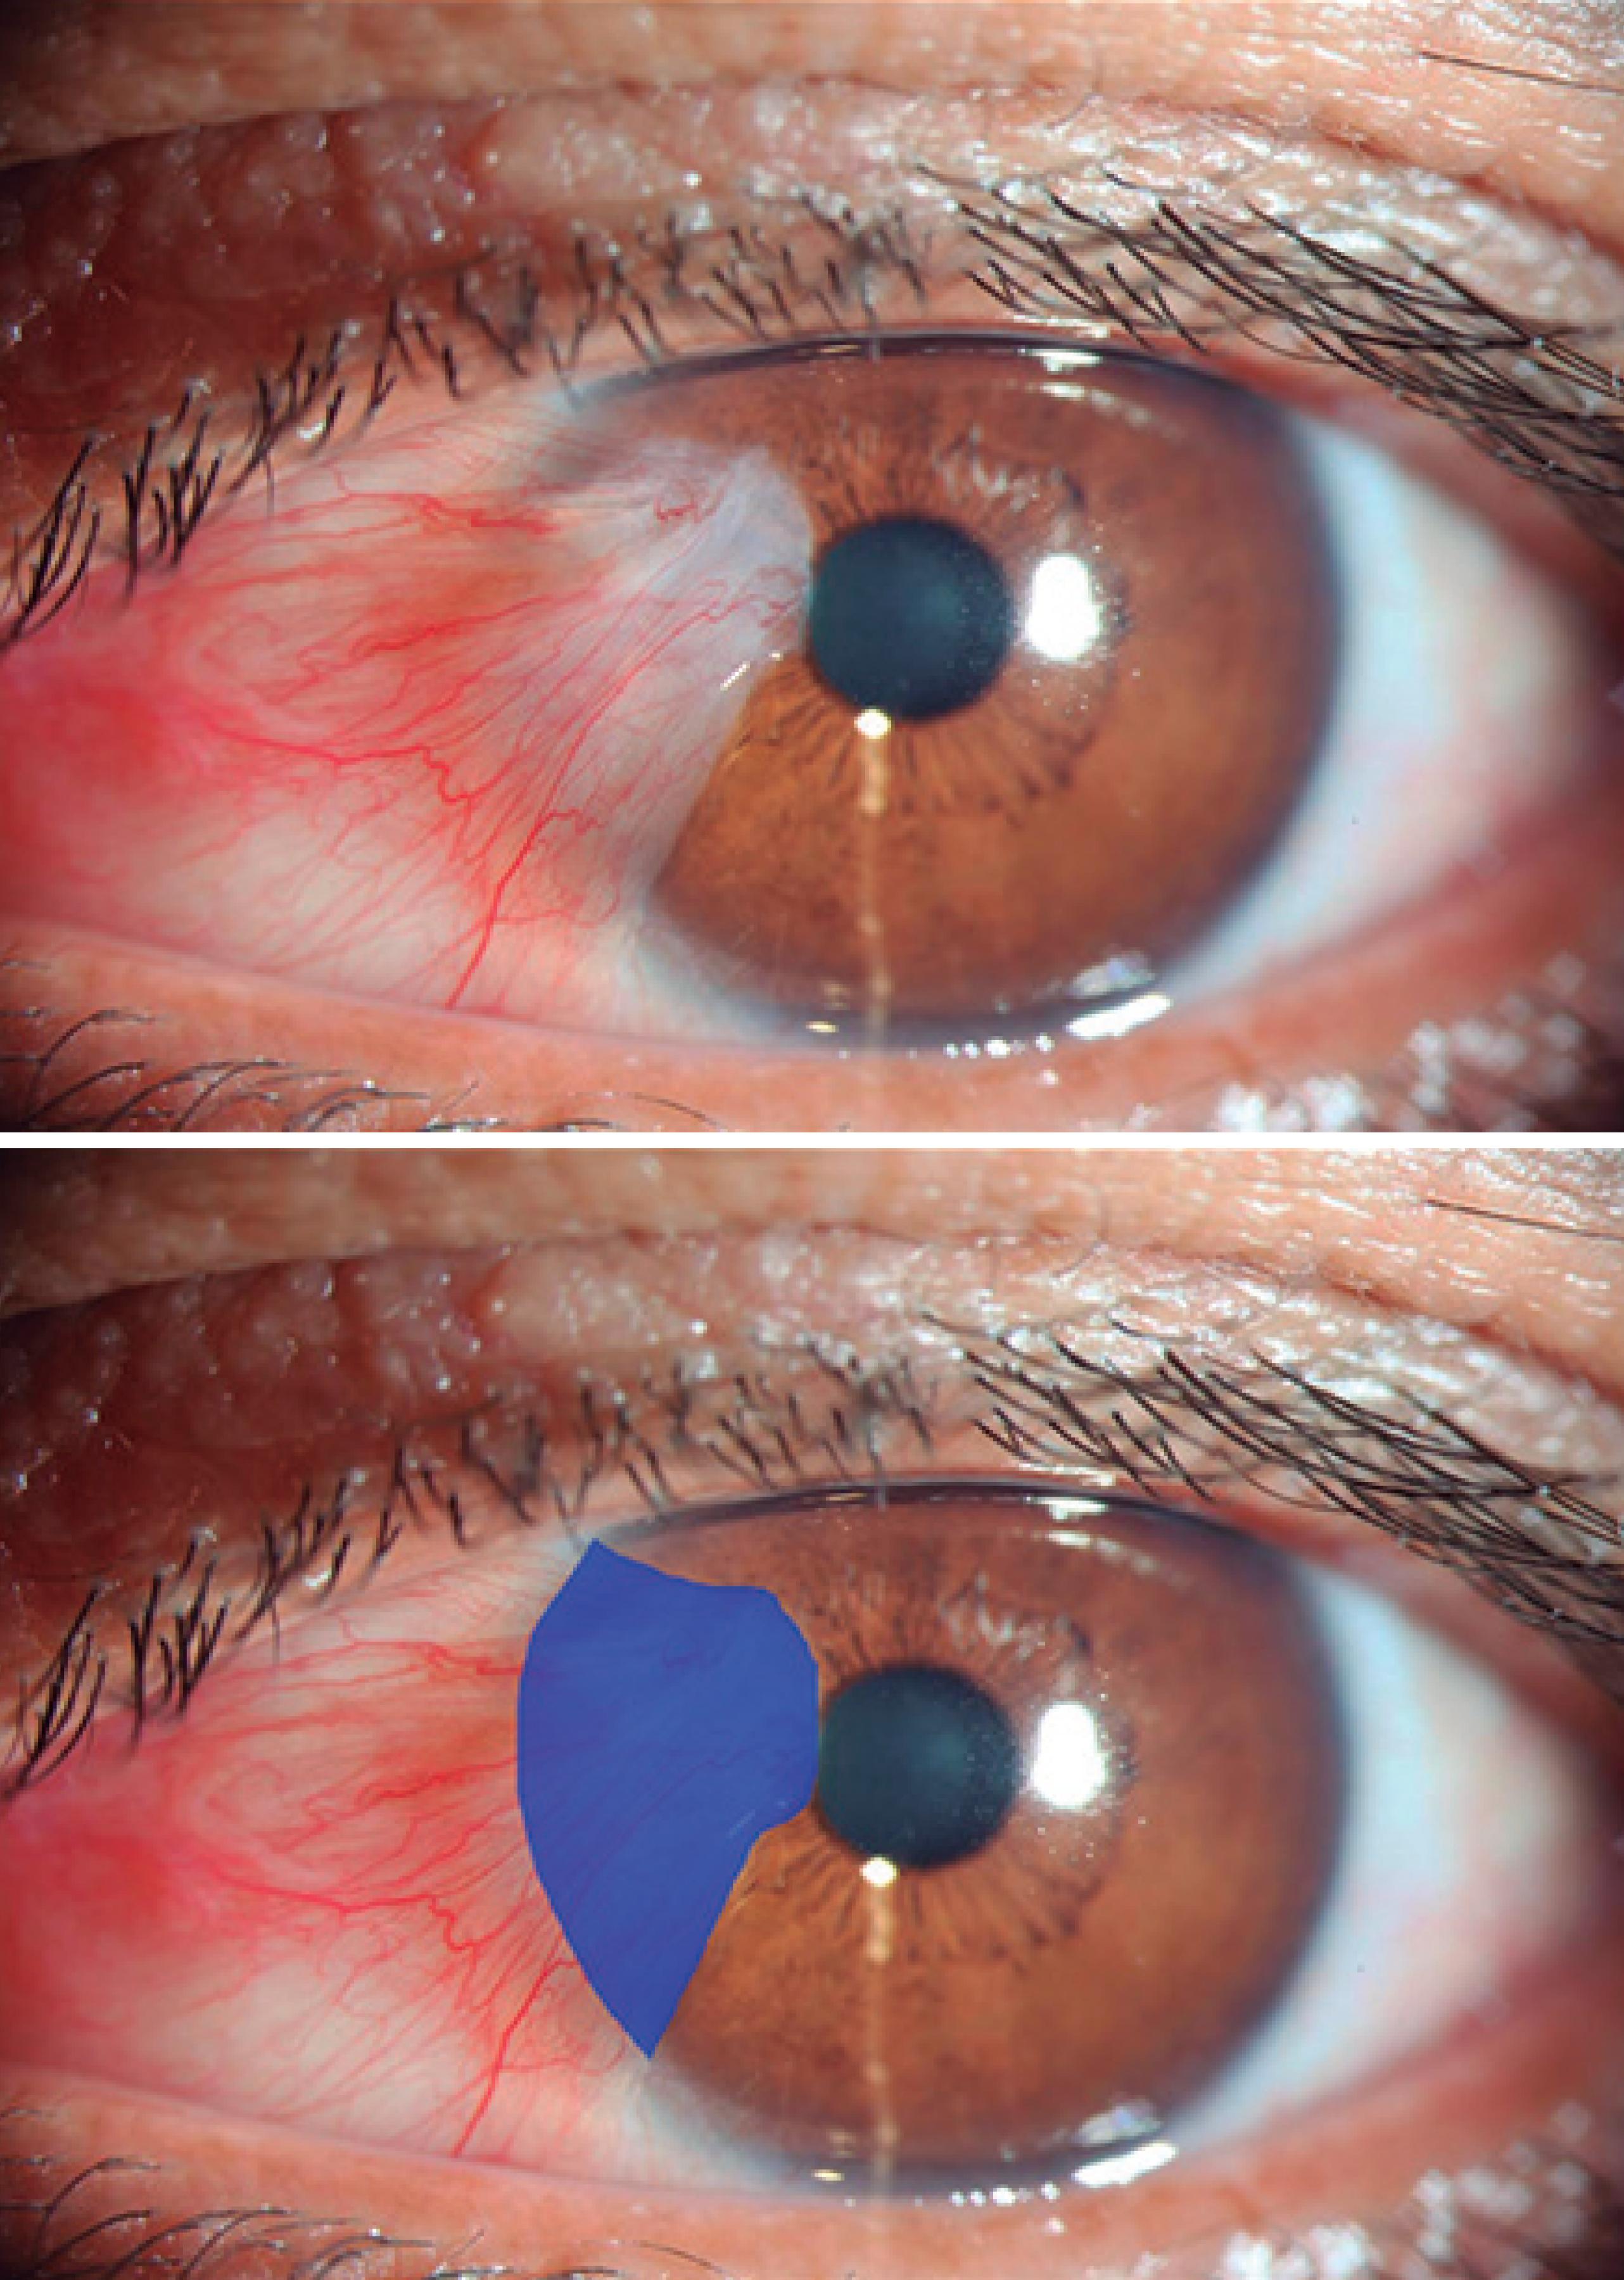
Figure 1 Photograph showing estimation of the pterygium surface on the cornea. The actual surface area as calculated by software (AutoCAD® software, version 19.1, Autodesk Inc., CA, USA) is shown in blue.
Endothelial cell count was measured at the central cornea using a noncontact specular microscope at a resolution of 640 x 480 pixels (ROBO; Konan Storage System KSS 300; Konan Medical, Hyogo, Japan). Three endothelial measurements were obtained for each patient, and the average was taken as the mean. All measurements were made by one person at a single clinical site. To ensure reliability in assessing the corneal endothelium, a cell count ≥75 cells measured from the central cornea should be obtained to allow detection of a 2% difference between groups of data(8).
Statistical analysis
We calculated the sample size from pilot study observations and accounted for a potential dropout rate of 10%. The sample size was calculated from the observed difference and pooled standard difference (SD) from a previous study that assessed human corneal ECD with a sensitivity capable of detecting a 10% reduction(7,8). A power of 80% and confidence level of 95% yielded a sample size of ≥22 per arm. The primary null hypothesis was no between-group difference in the endothelial cell count. The alternative hypothesis was that the endothelial cell count would be lower in the pterygium group than in the contralateral eye group (without pterygium). Given the sample of ≥60 patients, the study had a power of almost 90% to show the primary end point. The normal distribution of each continuous variable was assessed by performing the Shapiro-Wilk test. We used Student’s t-test for two independent samples to compare the ECD. Quantitative data were described as the mean ± standard deviation (range). A two-sided p value of <0.05 was considered as indicating statistical significance. The Pearson correlation test and regression analysis method were used to study the association between the percentage of pterygium invasion of the cornea and a decrease in the ECD. All data analyses were performed by using the SPSS statistical program (version 17.0; SPSS, Inc, Chicago, Illinois, USA).
RESULTS
From September 2015 through July 2016, 73 patients were enrolled in the study. Eleven of these patients were ineligible at baseline (5 had previous ocular surgery, three had contact lens use, two had diabetes mellitus, one had glaucoma, and one had a central cell count of <1800 cells/mm2). After exclusions, a total of 122 eyes of 61 patients were eligible for the study. Twenty-nine (47.5%) were men and 32 (52.5%) were women. The mean age of the patients was 50.84 years (range, 25-77 years; SD, ± 13.8 years). All patients had unilateral pterygium. The percentage of pterygium that invaded the cornea ranged from 4.87% to 24.59%, with a median of 9.70% ± 4.99%.
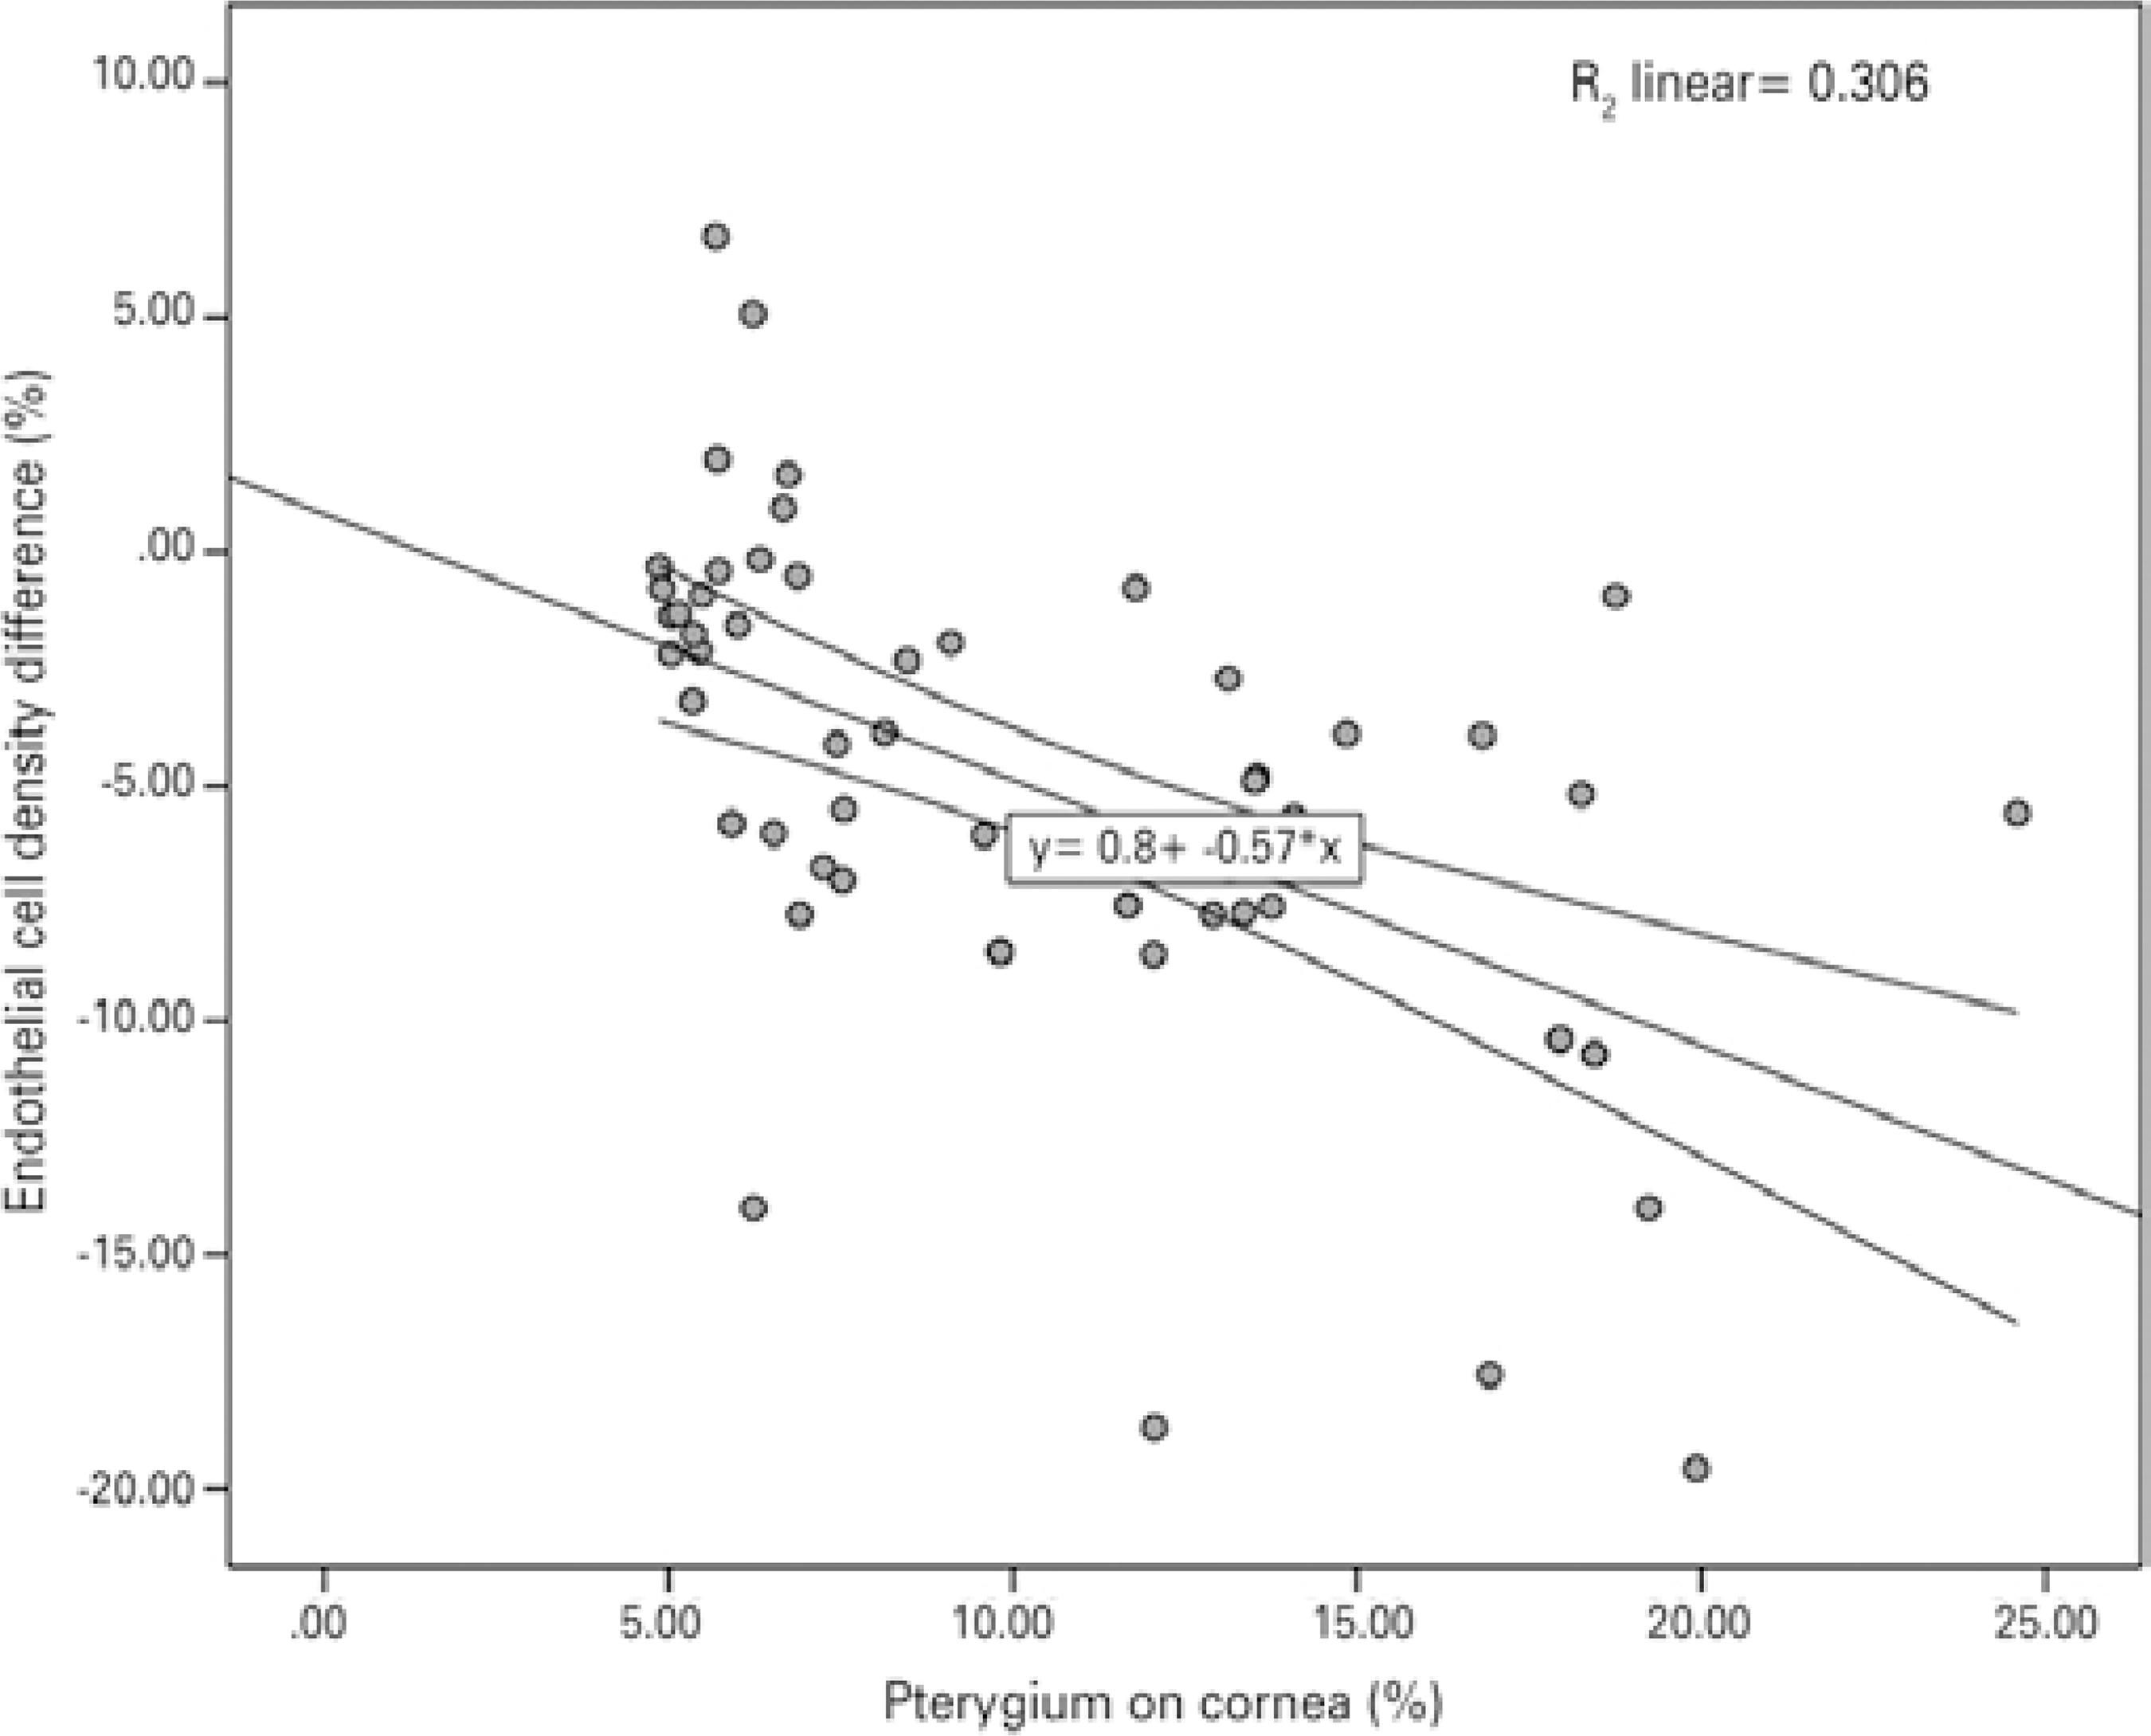
Table 1 compares the outcome measures between the patients and controls. The mean corneal ECD (cells/mm) was lower in the pterygium eyes (cases) than in the controls (2451.83 ± 284.96 vs. 2549.95 ± 268.94; p=0.04). No differences were observed between cases and controls with regard to the mean CV of cell size, hexagonality, and central corneal thickness. The difference in the corneal ECD between eyes with pterygium and control eyes ranged from +6.72 to -19.56, with a median of -5.18%. The Pearson correlation test showed a significant negative linear relationship between pterygium invasion and ECD [p<0.001, n=61, r=-0.553 (95% CI, -0.34 to -0.73)] (Figure 2).
Table 1 Basic demographic data of the 61 patients with unilateral pterygium
| Eyes with pterygium | Control eyes | P value | |
|---|---|---|---|
| (n=61) | (n=61) | ||
| KM (D) mean (SD) | 0043.18 ±002.13 | 0044.08 ± 001.70 | 0.018 |
| AST (D) mean (SD) | 0002.93 ± 003.41 | 0000.95 ± 000.71 | 0.001 |
| Pterygium % range (median) | 0009.70 ± 004.99 | None | - |
| 4.87%-24.59% | |||
| ECD mean (SD) range | 2451.83 ± 284.96 1841-3070 | 2549.95 ± 268.94 1934-3291 | 0.040 |
| CV (%) mean (SD) | 0036.83 ± 006.27 | 0037.96 ± 006.35 | 0.430 |
| 6A (%) mean (SD) | 0054.86 ± 016.85 | 0055.46 ± 014.42 | 0.830 |
| Pachymetric results (µm) mean (SD) | 0528.25 ± 040.08 | 0526.01 ± 034.76 | 0.740 |
KM= mean corneal power in the 3.00 mm central zone; AST= corneal astigmatism in the 3.00mm central zone; ECD= endothelial cell density; CV= coefficient of variation; 6A= hexagonality.
DISCUSSION
This is the second study to evaluate the association between pterygium and the corneal ECD. Our cross-sectional study involving 61 patients demonstrated a significant decrease in ECD related to pterygium involvement in the cornea. We also found a negative correlation between the corneal ECD and the percentage of pterygium invasion of the cornea.
Despite advances in understanding of its complex pathogenesis, the origin of pterygia is still not clearly understood. Common histological characteristics include an invasive front of the pterygium epithelium that suddenly transitions into corneal epithelium at the advancing edge. At the junction between the normal cornea and pterygium, the stroma has been frequently characterized by feeder blood vessels that preceded the fibroblastic stroma and intravascular inflammation(9). Different studies have provided information indicating the presence of inflammatory cells in pterygia. Several cytokines, such as basic fibroblast growth factor, tumor necrosis factor, platelet-derived growth factor and abundant levels of enzymes, such as MMPs, collagenases, and gelatinases, have also been localized in pterygium cells(9,10).
For that reason, it is possible that all of these chronic inflammatory components and angiogenesis act in concert to degrade BL, a characteristic feature of pterygia, and all of the other tissue structural components. Therefore, it is not unreasonable to propose that pterygium invasion may induce even deeper changes in the cornea at the level of the endothelium and Descemet membrane, which could explain the lower corneal ECD in the eyes with pterygium than in the controlateral eye (control group) found in our study.
Evidence that the presence of pterygia is associated with deep corneal changes at the level of the endothelium and Descemet membrane was first described by Mootha et al.(11). They found deep corneal marks in long-standing nasal pterygium in seven elderly patients. The authors at that time hypothesized a lower ECD in eyes with pterygium. Recently, in a retrospective comparative study performed by Hsu et al.(7), an analysis of 90 patients with unilateral pterygium revealed a significant between-group diference, with a decrease in the corneal ECD in eyes with pterygium involvement. In our study, the corneal ECD was also negatively associated with pterygium invasion. These findings reinforce the suggestion that pterygium invasion exerts possible deep layer changes in the cornea.
Different corneal measurements could have a direct impact on the analysis of ECD values at the central corneal surface(12). The corneal parameter that has most commonly been assessed for its effect on ECD is corneal thickness. According to the literature, a lower ECD value would be expected in thinner corneas. In our study, there was no statistically significant difference in pachymetric results between eyes with pterygium and control eyes. Besides corneal thickness, ECD also has been reported to be lower in steeper corneas. In the present study, steeper corneas were observed in the control group than in the pterygium group (44.08 D in the control group vs. 43.18 D in the pterygium group, p=0.018). It could be argued that the effects of these corneal measurements in the current study were not relevant to the ECD observed.
Studies have been conducted to assess corneal astigmatism induced by pterygium(13,14). In another cross-sectional study in 2008, Mohammad-Salih et al.(13) studied the relationship between pterygium size and corneal astigmatism in eyes with unilateral primary pterygium. As in our study, the authors observed that the mean value of corneal astigmatism was significantly higher in the pterygium group than in the control group (p<0.001). Induced astigmatism is in most cases characterized as “with-the-rule astigmatism” resulting from localized flattening of the cornea caused by the contractile effect exerted by the pterygium.
Our study had some limitations. First, this was a cross-sectional study and there was no follow-up, so we cannot document the long-term endothelial changes that may become evident over the long term. Second, we were able to identify associations but could not determine cause and effect; therefore, we have not provided an explanation of our findings. Third, the effect of the pterygium thickness on corneal endothelium was not considered because this type of measure is very difficult to perform.
In summary, this cross-sectional study showed that pterygium was associated with a decrease in corneal ECD. It is important that further longitudinal studies be conducted to confirm this association between these two variables.

