INTRODUCTION
Corneas of diabetic patients undergo several structural, morphological, and physiological changes such as altered epithelial(1) and endothelial barrier function(2), corneal edema(3), increased corneal thickness(4), abnormalities of the basement membrane(2), greater polymegathism and pleomorphism of endothelial cells(4,5), and lower endothelial cell density(5). These changes, along with the disturbances to the tear film(6), crystalline lens(7), and vitreous body(8) observed in diabetic patients, result in changes in the optical performance of the eye that reduce the quality of the retinal image(8).
The cornea(9) and crystalline lens(10) scatter light, particularly when their transparency has been significantly affected(11). Corneal transparency is determined by the corneal structure and is affected by changes in metabolism(9,10). In patients with diabetes mellitus (DM), hyperglycemia can inhibit Na+/K+-ATPase activity, increasing corneal thickness and hydration, thereby affecting corneal transparency(3). The loss of this activity therefore results in an increase in the light backscattered by the cornea(9,10).
Light backscatter is measured in clinical practice through the di gital analysis of images obtained with several types of device, including slit lamps(9), optical tomography(11), and Scheimpflug cameras(12), and is used to assess the quality of ocular tissues, particularly the opacity and cataract classification of the crystalline lens(13). Previous studies with diabetic patients have shown an increase in corneal epithelial basement membrane light backscatter compared to control subjects(14,15). This was related to the severity of diabetic retinopathy(14).
Scheimpflug imaging uses light backscattered from ocular tissues to image the anterior segment of the eye noninvasively, allowing the acquisition of multiple photographs of this segment. Scheimpflug images provide structure-related data and allow the assessment of information regarding the transparency of ocular tissues. The cornea is a source of light backscatter when its transparency has been significantly affected(16); corneal haze with reduced corneal transparency is therefore associated with increased ocular scattering. Clinically, corneal haze is assessed as corneal backscatter observed by slit lamp examination or the use of a Scheimpflug camera(17,18). The software of Pentacam Scheimpflug device analyzes the corneal area of interest, and the output image is expressed in grayscale units for the imaging analysis. Thus, Scheimpflug imaging has previously been used to measure central corneal backscatter in patients with diabetic retinopathy(19), but as yet it has not been applied to detecting the general changes in corneal backscatter that result from DM.
The aim of the present pilot study was to determine the usefulness of Scheimpflug image analysis for detecting corneal backscatter changes due to DM and to assess its potential for the detection and monitoring of corneal changes related to DM.
METHODS
Subjects
Eighteen right eyes from 18 subjects with DM (15 men and 3 women) and sixteen right eyes from 16 control subjects (4 men and 12 women) were included in the study. The patients and control subjects were recruited from the Department of Ophthalmology of Vithas Medimar International Hospital, Alicante, Spain. All patients provided written informed consent before undergoing any procedures and the study was conducted in accordance with the World Medical Association's Declaration of Helsinki. Institutional Review Board approval was obtained prior to starting the study.
The inclusion criterion was age 30-70 years. Exclusion criteria for both the diabetic patients and the controls were previous corneal and/or ocular surgery, corneal or ocular disease, retinal photocoagulation, clinical corneal changes, and contact lens wear. All subjects had no other ocular or systemic complications.
All diabetic patients were diagnosed according to the guidelines of American Diabetes Association. All had stable and well-controlled blood glucose levels and were classified into insulin-dependent DM (IDDM, n=7) and non-insulin-dependent DM (NIDDM, n=11) groups. Diabetic retinopathy (DR) was assessed by an ophthalmologist and graded according to the Early Treatment Diabetic Retinopathy Study classification(20).
Both the diabetic patients and the control subjects underwent a thorough ophthalmic examination that also included the measurement of best-corrected visual acuity (BCVA) by Snellen chart, a slit-lamp examination, and Pentacam imaging. Visual acuity (VA) was recorded on the logarithm of the minimum of angle resolution (logMAR) scale.
Scheimpflug imaging
The Scheimpflug imaging was performed using a Pentacam rotating Scheimpflug camera (Oculus Inc., Germany), which uses the Scheimpflug principle to acquire cross-sectional images of the an terior segment of the eye.
All measurements followed a standardized procedure to minimize external sources of variability. The patient's head was carefully positioned on the chin and forehead rests, and the patient was asked to fixate on an internal target. A real-time image of the eye appeared on the computer screen, allowing the examiner to change and optimize the focus and centration. All measurements were made in the morning, and the mean of seven measurements taken in seven different meridians was calculated for each subject. Images of the anterior segment of the eye were obtained using the 25 scans setting. All cross-sectional images were saved in jpeg format. The central corneal thickness (CCT) and anterior chamber depth were also measured.
Scheimpflug imaging analysis
Imaging analysis was performed using NIH Image J v1.47 medical imaging software (National Institutes of Health, Bethesda, MD)(21).
Seven meridians for each eye, with orientations ranging from 70° to 110°, were analyzed. The image for each meridian was first converted into an 8-bit image (Figure 1 A) and then contrast-reversed (Figure 1 B). Finally, the "Invert LUT" tool was applied, which reversed the image contrast and pixel values of the image (Figure 1 C), resulting in pixels with a value of 0 being white and pixels with a value of 255 being black. The grayscale image was calibrated in optical density units (o.d.u.) by the Optical Density Calibration tool of the Image J software. This tool provided a calibrated optical density step table (with a density range of 0.05 to 3.05 o.d.u.) to calibrate grayscale images. We measured the mean gray value to the white background at the left end of each image using the same rectangular selection. We obtained 19 measurements; these were automatically entered into the software's calibrate dialog box and the Image J software then gene rated and displayed the calibration curve. As a result, the image was calibrated to optical density, with white pixels representing the highest optical density (3.05 o.d.u.) and black pixels the lowest (0.05 o.d.u.).

Figure 1 Image processing using Image J. A) An 8-bit image in which pixels with a value of zero are black and those with a value of 255 are white. B) The contrast-reversed 8-bit image. C) The 8-bit image with contrast and pixel values reversed; pixels with a value of zero are now white and those with a value 255 are black. D) Determination of the 3-mm central region. E) Determination of the width of the central region. F) Outline of the 3-mm central region.
The scale was defined by determining the size in pixels of a parameter of known size. A measure of ACD in the center of the image was carried out with the assistance of the "finde edges" tool. As a result, 1mm corresponded to 36,36 pixels.
To determine a 3-mm central region, a central line 3-mm long was drawn and delimited with two vertical lines (Figure 1 D). This region of interest was replicated in each eye. To select the width of the area to be analyzed, and to avoid as far as possible the inclusion of the tear film in the corneal backscatter measurements, we established as a reference point the limit between the corneal endothelium and the aqueous humor, making this reference line coincide with an ellipse that was drawn to delimit the second surface of the cornea, and a band with the CCT value to delimit the first surface of the cornea (Figure 1 E). Finally, the 3-mm central region was outlined (Figure 1 F). The same procedure was performed for the central 5-mm region.
If an image was not properly centered or there were any external artifacts (shadows) that could affect the measurements, the image was excluded.
Statistical analysis
In this study, only the right eyes were analyzed. The central backscatter was calculated for each eye as the mean value from the seven meridians measured. Normality of the data distributions for the different groups was determined using the Kolmogorov-Smirnov test. When parametric analysis was possible, the independent samples Student's t -test was used for comparisons between the diabetic patients and control subjects. When parametric analysis was not possible, the Mann-Whitney U test was used to assess such differences. The homogeneity of these measures was defined by the coefficient of variation (CV). Differences between the 3-mm and 5-mm central zones were determined using paired Student's t -tests.
Differences in central corneal backscatter among the IDDM patients, NIDDM patients, and healthy controls, and among the stages of DR, were assessed with the Kruskal-Wallis test. To determine which pairwise comparisons were responsible for the overall difference between groups, separate Mann-Whitney U tests were performed on each pair (3 tests), assessing significance as p<0.0167 (i.e., 0.05/3).
Correlation coefficients (Pearson or Spearman) were used to assess the correlations between variables. Except when specified otherwise, we considered values of p<0.05 to be statistically significant in all of the statistical tests. The statistical analysis was performed using SPSS software (version 19, IBM Corp., Armonk, NY).
RESULTS
The mean age of the diabetic patients was 51.33 ± 10.63 years (range 33-68 years) and that of the control subjects was 49.44 ± 9.34 years (range 38-64 years) (p>0.05). Both diabetic groups were then compared with age-matched control subjects (Table 1). The difference in duration of diabetes between the IDDM patients (210.86 ± 150.97 months, range 24-244 months) and NIDDM patients (128.82 ± 136.74 months, range 1-480 months) was not found to be statistically significant (p=0.246), although the statistical power in this pilot study was not high enough to determine the significance of the difference in this parameter.
Table 1 Comparison of characteristics between the patients with diabetes and age-matched controls
| IDDM | Controls | NIDDM | Controls | |||
|---|---|---|---|---|---|---|
| Characteristics | Mean ± SD | p-value§ | Mean ± SD | p-value* | ||
| Number | 7 | 6 | 11 | 10 | ||
| Sex | 6 M, 1 F | 3 M, 3 F | 9 M, 2 F | 1 M, 9 F | ||
| Age (yr) | 42.29 ± 9.57 | 40.00 ± 1.26 | 0.94 | 57.09 ± 6.59 | 55.10 ± 7.03 | <0.56 |
| BCVA (logMAR) | 0.06 ± 0.11 | 0 | 0.23 | 0 | 0 | - |
| CCT (µm) | 594.71 ± 19.58 | 577. 83 ± 32.54 | 0.37 | 588.18 ± 47.03 | 555.30 ± 52.24 | <0.28 |
| ACD (mm) | 2.68 ± 0.41 | 2.75 ± 0.27 | 0.94 | 2.60 ± 0.29 | 2.71 ± 0.34 | <0.43 |
| Diabetes duration (months) | 210.86 ± 150.97 | - | 128.82 ± 136.74 | - | ||
| Central backscatter 3 mm (o.d.u.) | 0.266 ± 0.097 | 0.197 ± 0.021 | <0.05 | 0.327 ± 0.167 | 0.218 ± 0.040 | <0.05 |
| Central backscatter 5 mm (o.d.u.) | 0.259 ± 0.090 | 0.194 ± 0.022 | <0.05 | 0.325 ± 0.165 | 0.214 ± 0.039 | <0.05 |
§Mann-Whitney U test;
*Unpaired t test.
IDDM= insulin-dependent diabetes mellitus; NIDDM= non-insulin-dependent diabetes mellitus; BCVA= best corrected visual acuity; ACD= anterior chamber depth; o.d.u.= optical density units.
In the IDDM group, three patients had moderate non-proliferative diabetic retinopathy (DRNP II) and one patient had severe non-proliferative diabetic retinopathy (DRNPS). In the NIDDM group, only one patient showed mild non-proliferative diabetic retinopathy (DRNP I). Apart from DR, the diabetic patients did not show any complications caused by DM.
The mean central corneal backscatter was calculated for each eye from the seven different meridians analyzed (range 70° to 110°). Differences in corneal backscatter between the diabetic and control groups were statistically significant for the 3-mm central zone (diabetic patients, 0.303 ± 0.144 o.d.u; controls, 0.210 ± 0.034 o.d.u.; p=0.016), and the 5-mm central zone (diabetic patients, 0.299 ± 0.142 o.d.u.; controls, 0.207 ± 0.034 o.d.u.; p=0.014). However, the difference in CCT values between the diabetic patients (590.72 ± 38.04 µm) and the control subjects (563.75 ± 46.02 µm) was not statistically significant (p=0.071); nor was there a statistical difference in BCVA values (diabetic patients, 0.022 ± 0.071; controls 0.00 ± 0.00; p=0.422).
For corneal backscatter of the 3-mm central zone, the mean CV for the diabetic patients was 2.1% (range 1.0%-5.0%) and for the control subjects was 2.3% (range 0.8%-6.6%).
Table 1 shows the mean values of central corneal backscatter obtained for the 3-mm and 5-mm central zones in the IDDM patients, NIDDM patients, and aged-matched control subjects. Values were significantly higher for both the IDDM patients and the NIDDM patients than for their age-matched control subjects for both central zone diameters.
Corneal backscatter for the 3-mm central zone was significantly higher than for the central 5-mm in the control subjects (p<0.001) but not in the diabetic patients (p>0.05) (paired Student's t -test). Corneal backscatter did not differ significantly between the IDDM and NIDDM diabetic patients for either zone analyzed (p>0.05 in both cases).
The Kruskal-Wallis test indicated that for central backscatter there was a significant effect of the presence of DM in both central zones (3 mm: χ2=13.546, df=2, p=0.001; 5 mm: χ2=13.626, df=2, p=0.001) (Figures 2 and 3). However, there were no statistically differences for central backscatter between the different stages of DR in either central zone (3 mm: χ2=2.547, df=3, p=0.467; 5 mm: χ2=2.547, df=3, p=0.467).
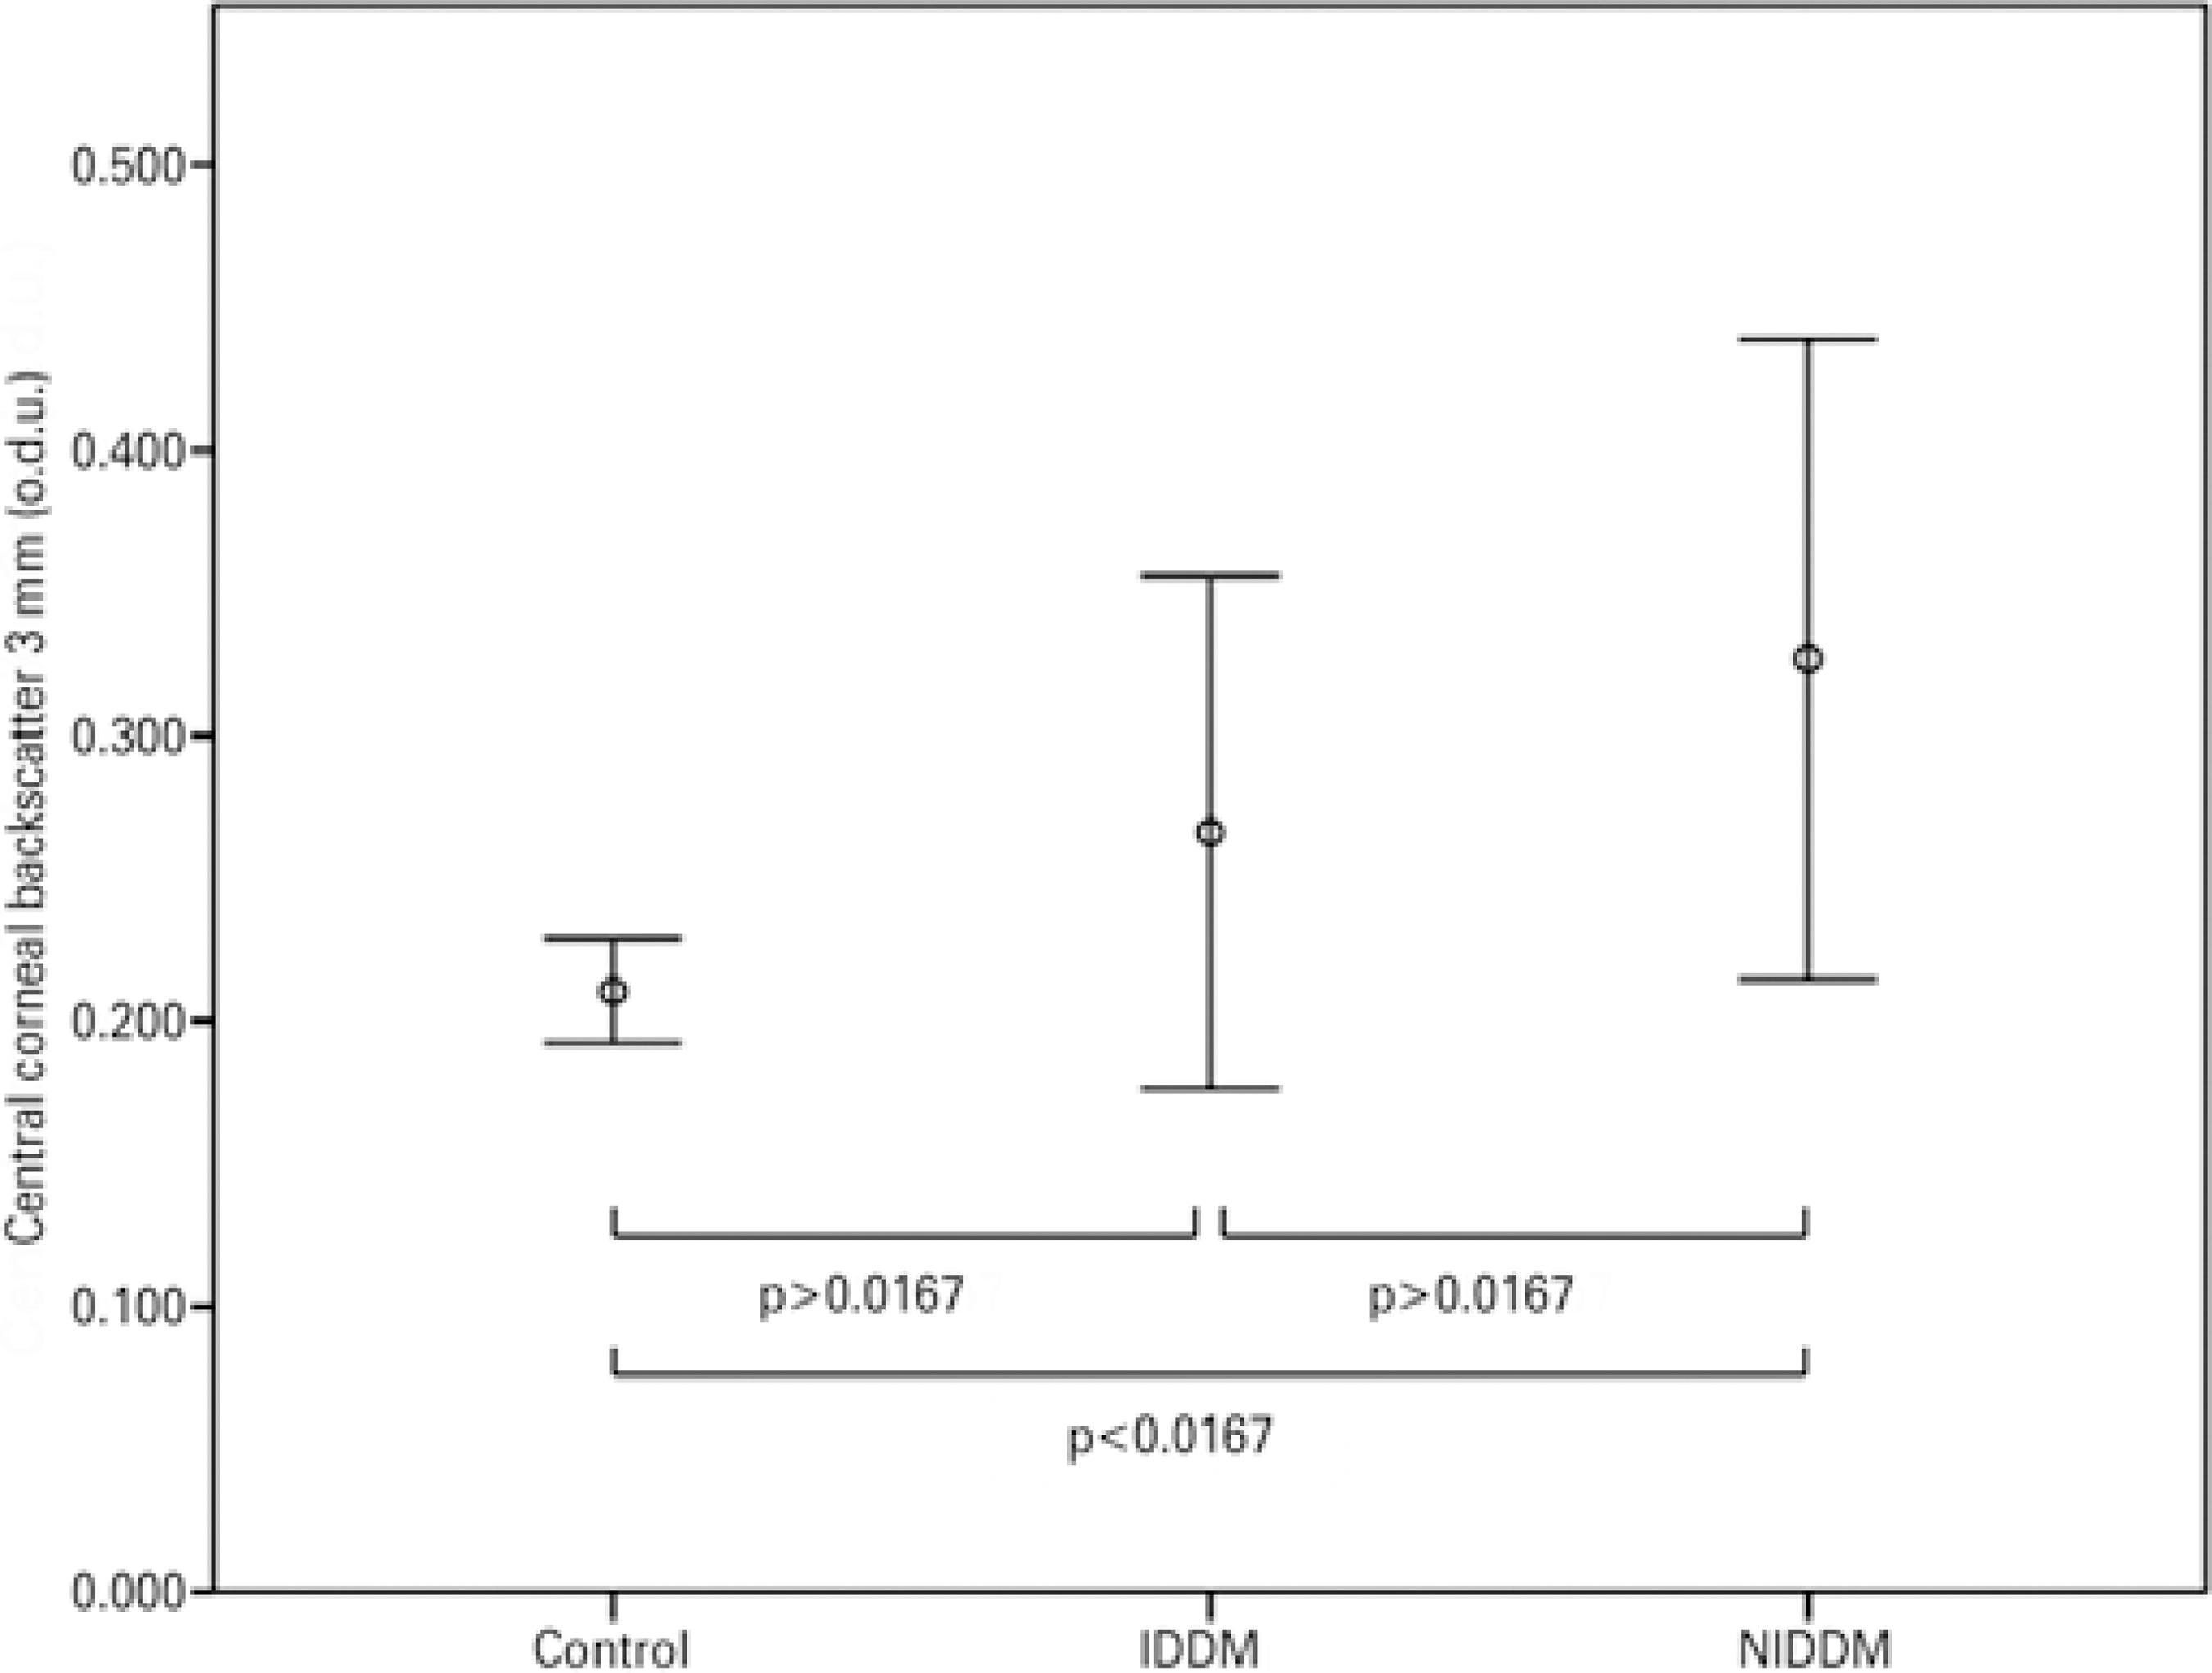
Figure 2 Mean values of corneal backscatter (for the central 3 mm) in patients with insulin-dependent diabetes mellitus (IDDM) or non-insulin-dependent diabetes mellitus (NIDDM), and control subjects. Error bars represent the 95% confidence interval (CI).
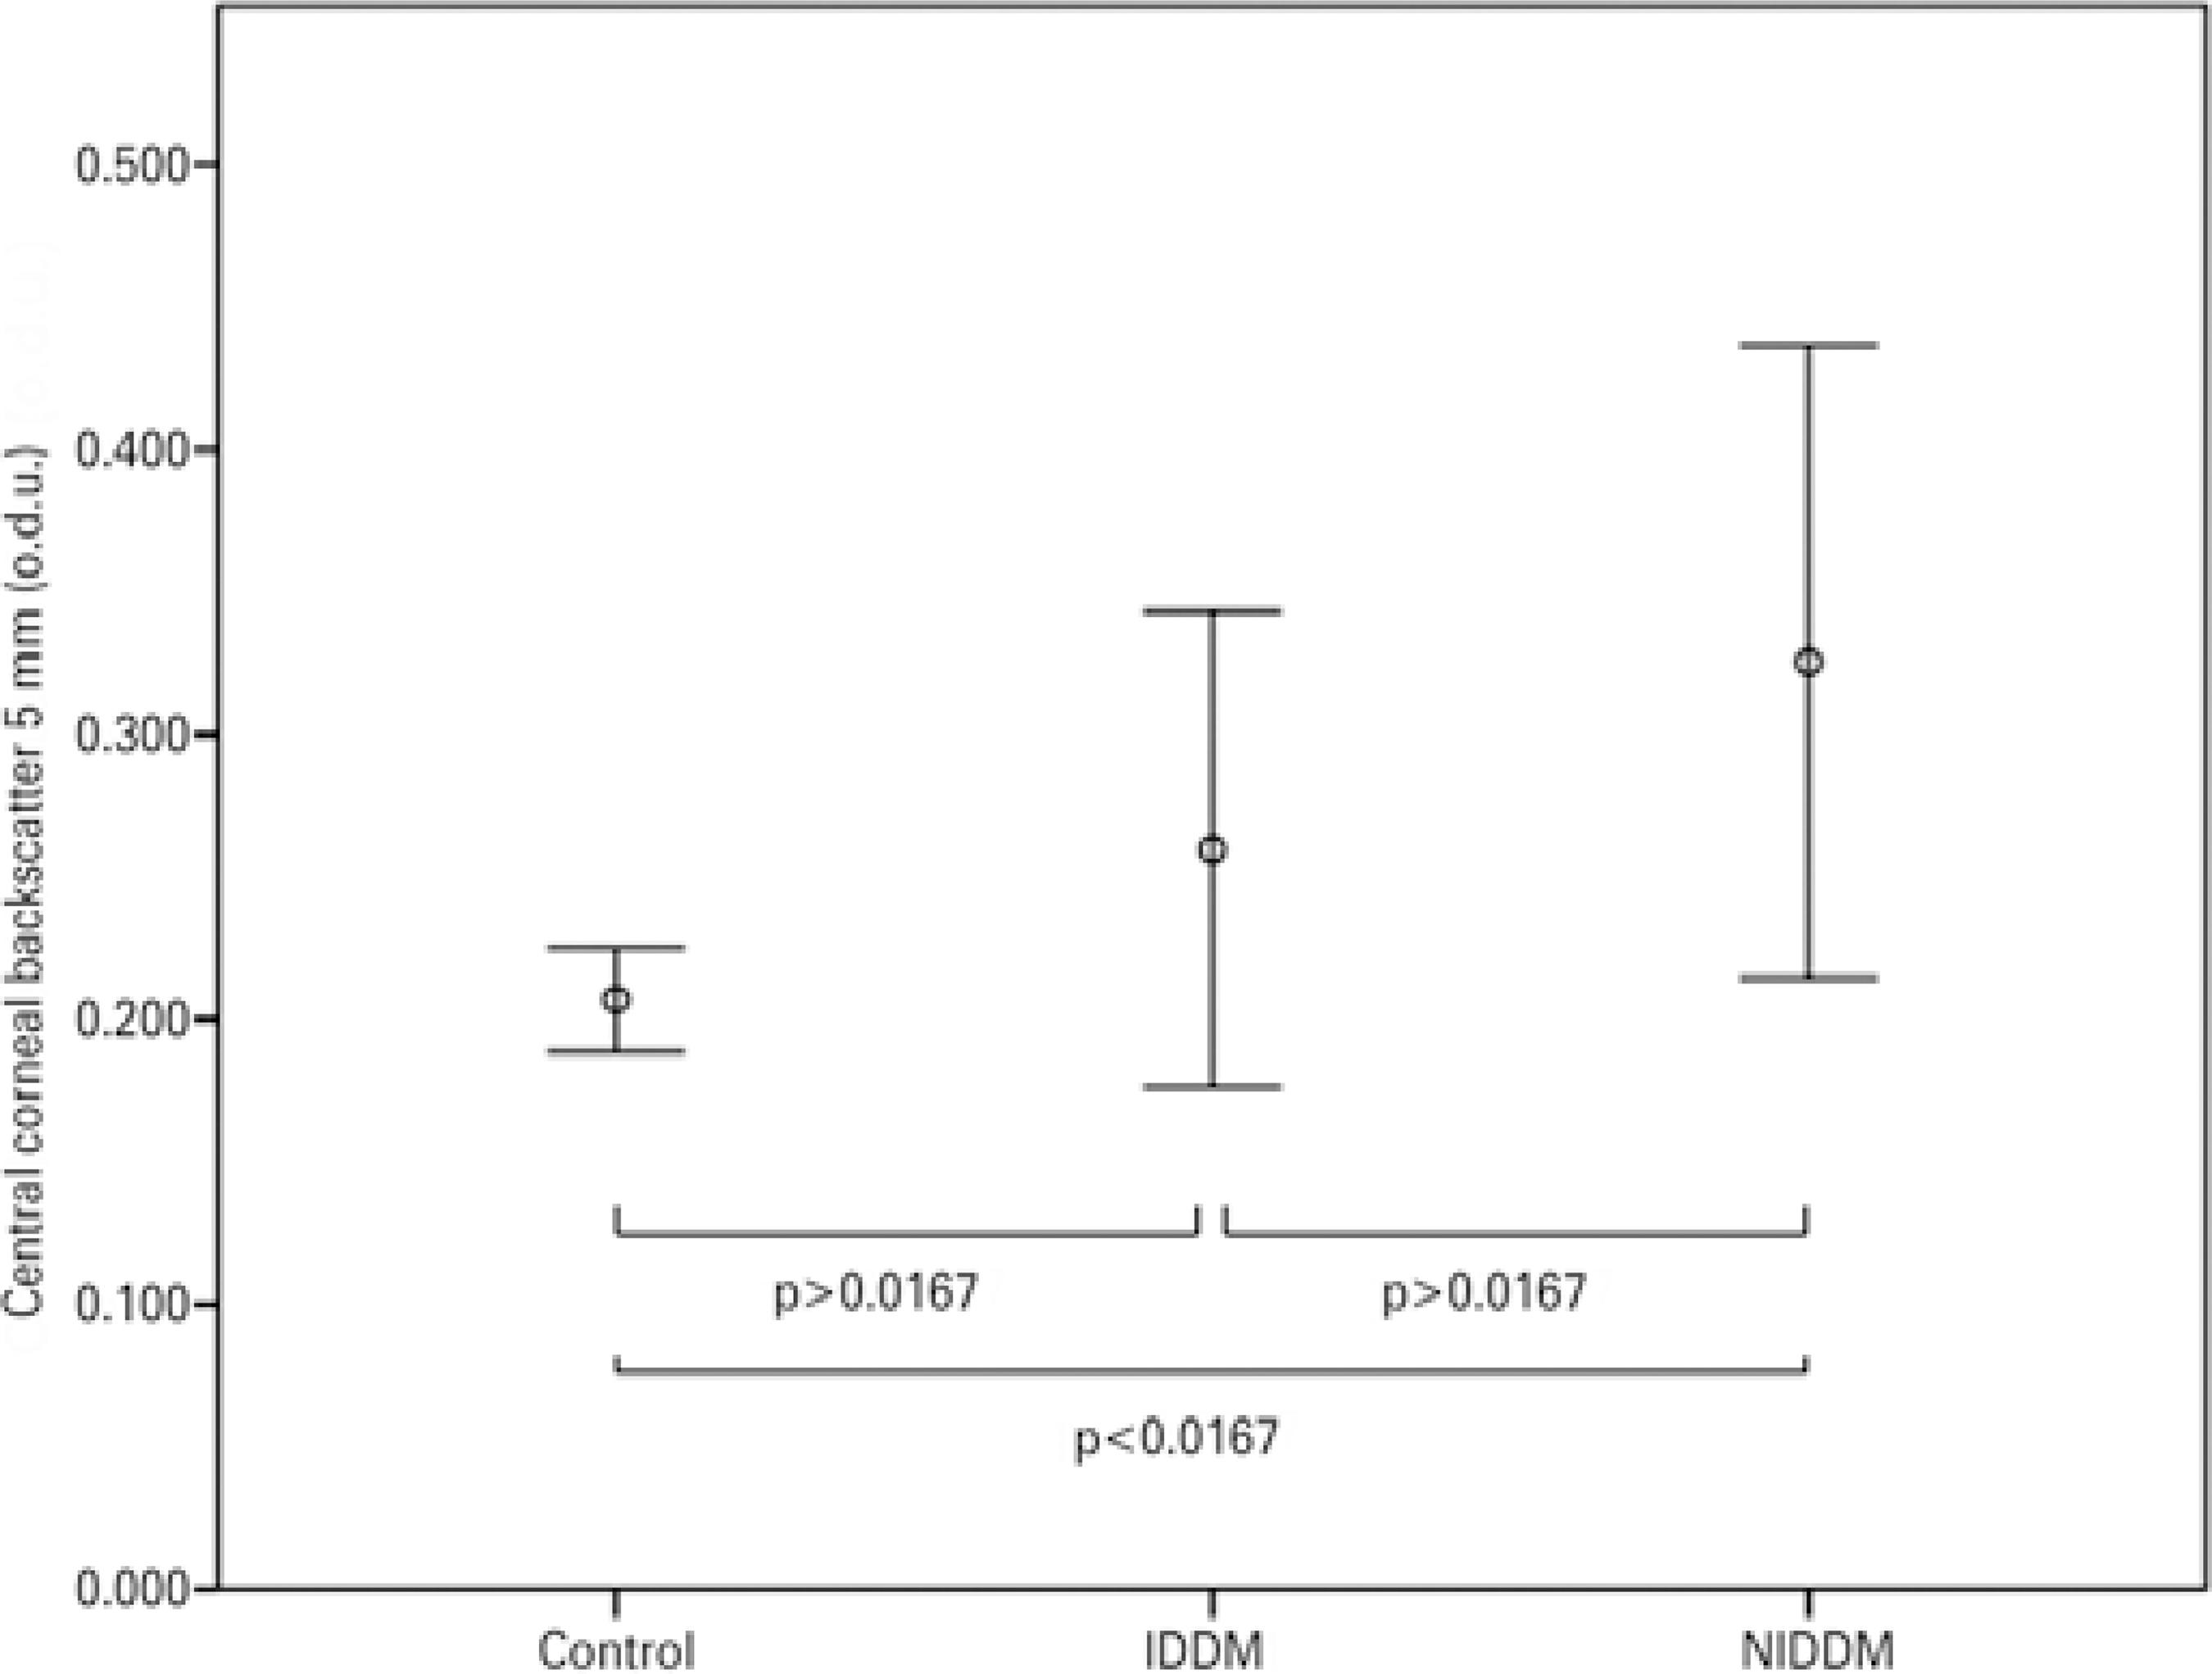
Figure 3 Mean values of corneal backscatter (for the central 5 mm) in patients with insulin-dependent diabetes mellitus (IDDM) or non-insulin-dependent diabetes mellitus (NIDDM), and control subjects. Error bars represent the 95% confidence interval (CI).
For the IDDM patients, Spearman correlation analysis showed that central backscatter was not correlated with age for both central zone diameters (3 mm: r=0.523, p=0.114; 5 mm: r=0.523, p=0.114); it was also the case for CCT (3 mm: r=-0.071, p=0.440; 5 mm: r=-0.071, p=0.440) (Figures 4 and 5). No significant correlations were found between diabetes duration and either central zone (3 mm: r=0.288, p=0.265; 5 mm: r=0.288 p=0.265), or DR stage and the central zones (3 mm: r=-0.077, p=-0.173; 5 mm: r=-0.077, p=-0.173).
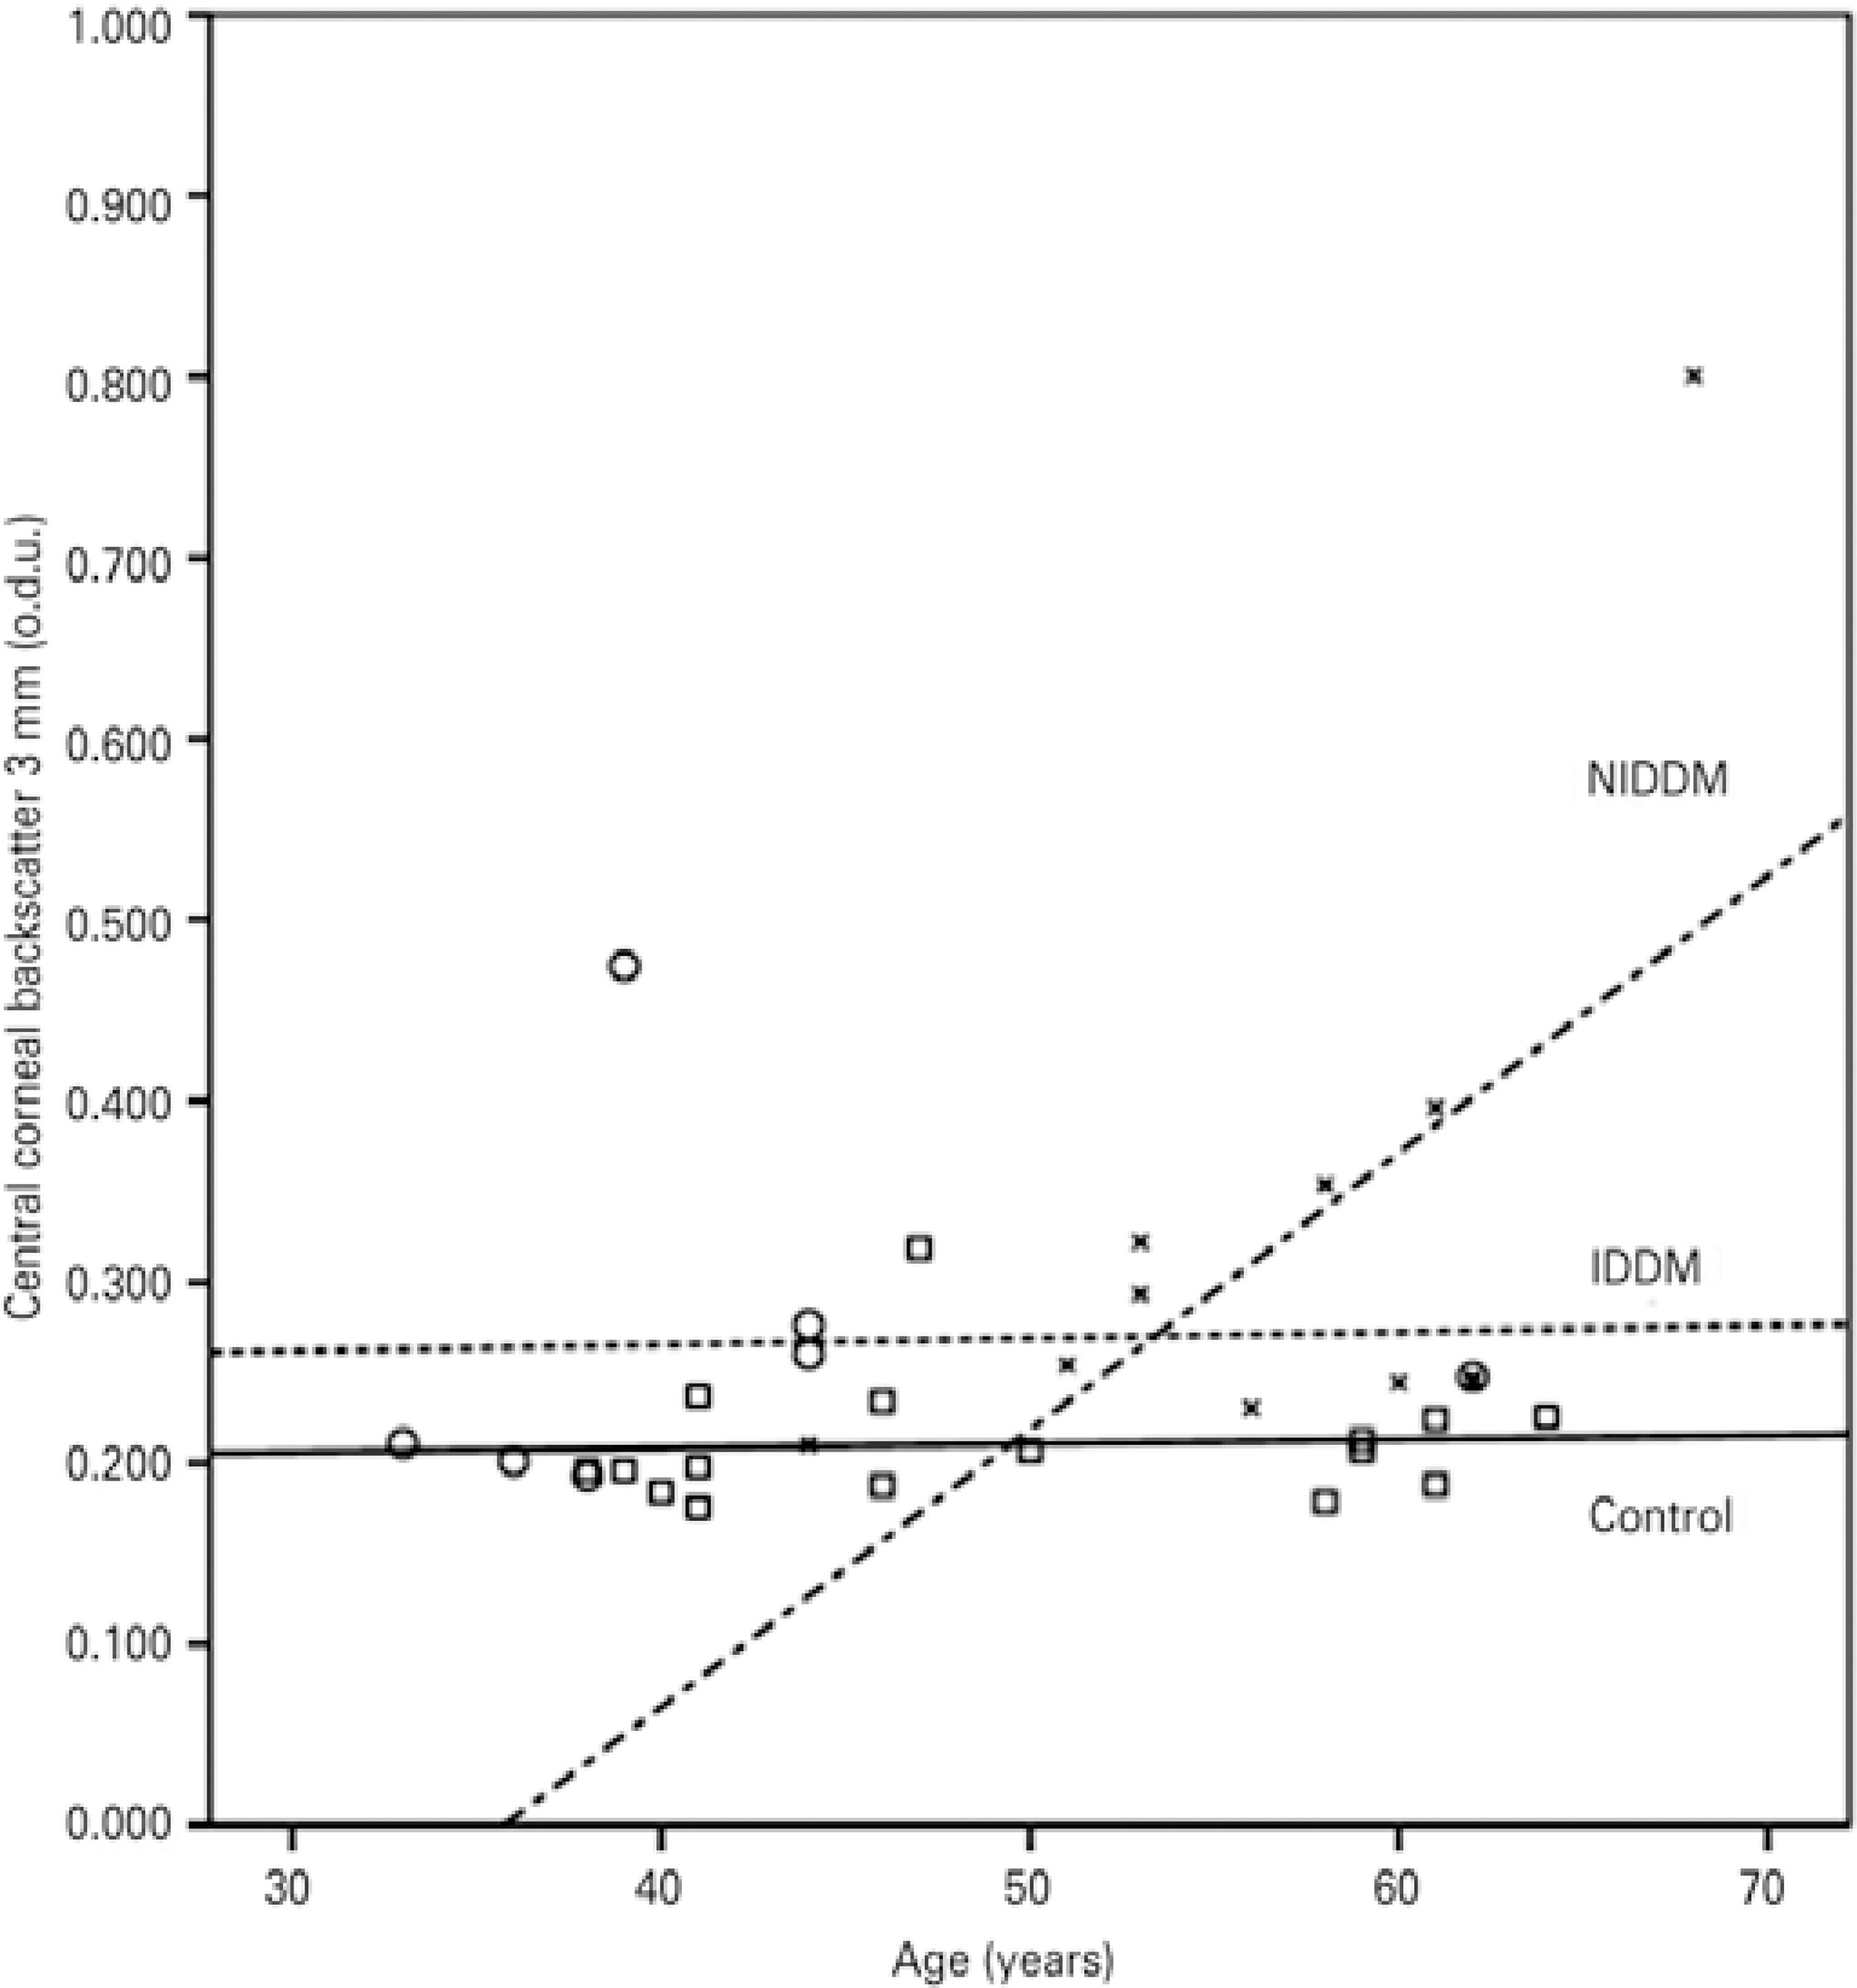
Figure 4 Correlations between corneal backscatter for the central 3 mm and age in the control subjects (squares and solid line; r=0.062; p>0.05), the patients with insu lin-dependent diabetes mellitus (IDDM) (circles and dotted line; r=0.523; p>0.05), and the patients with non-insulin-dependent diabetes mellitus (NIDDM) (blades and dotted/dashed line; r=0.604; p<0.05).
For the patients with NIDDM, Pearson´s correlation analysis revealed that backscatter for the central 3-mm zone presented a significant positive correlation with CCT (r=0.641, p=0.017) and age (r=0.604, p=0.025); backscatter for the central 5 mm was also significantly correlated with age (r=0.614, p=0.022) and CCT (r=0.671, p=0.012) (Figures 4 and 5).
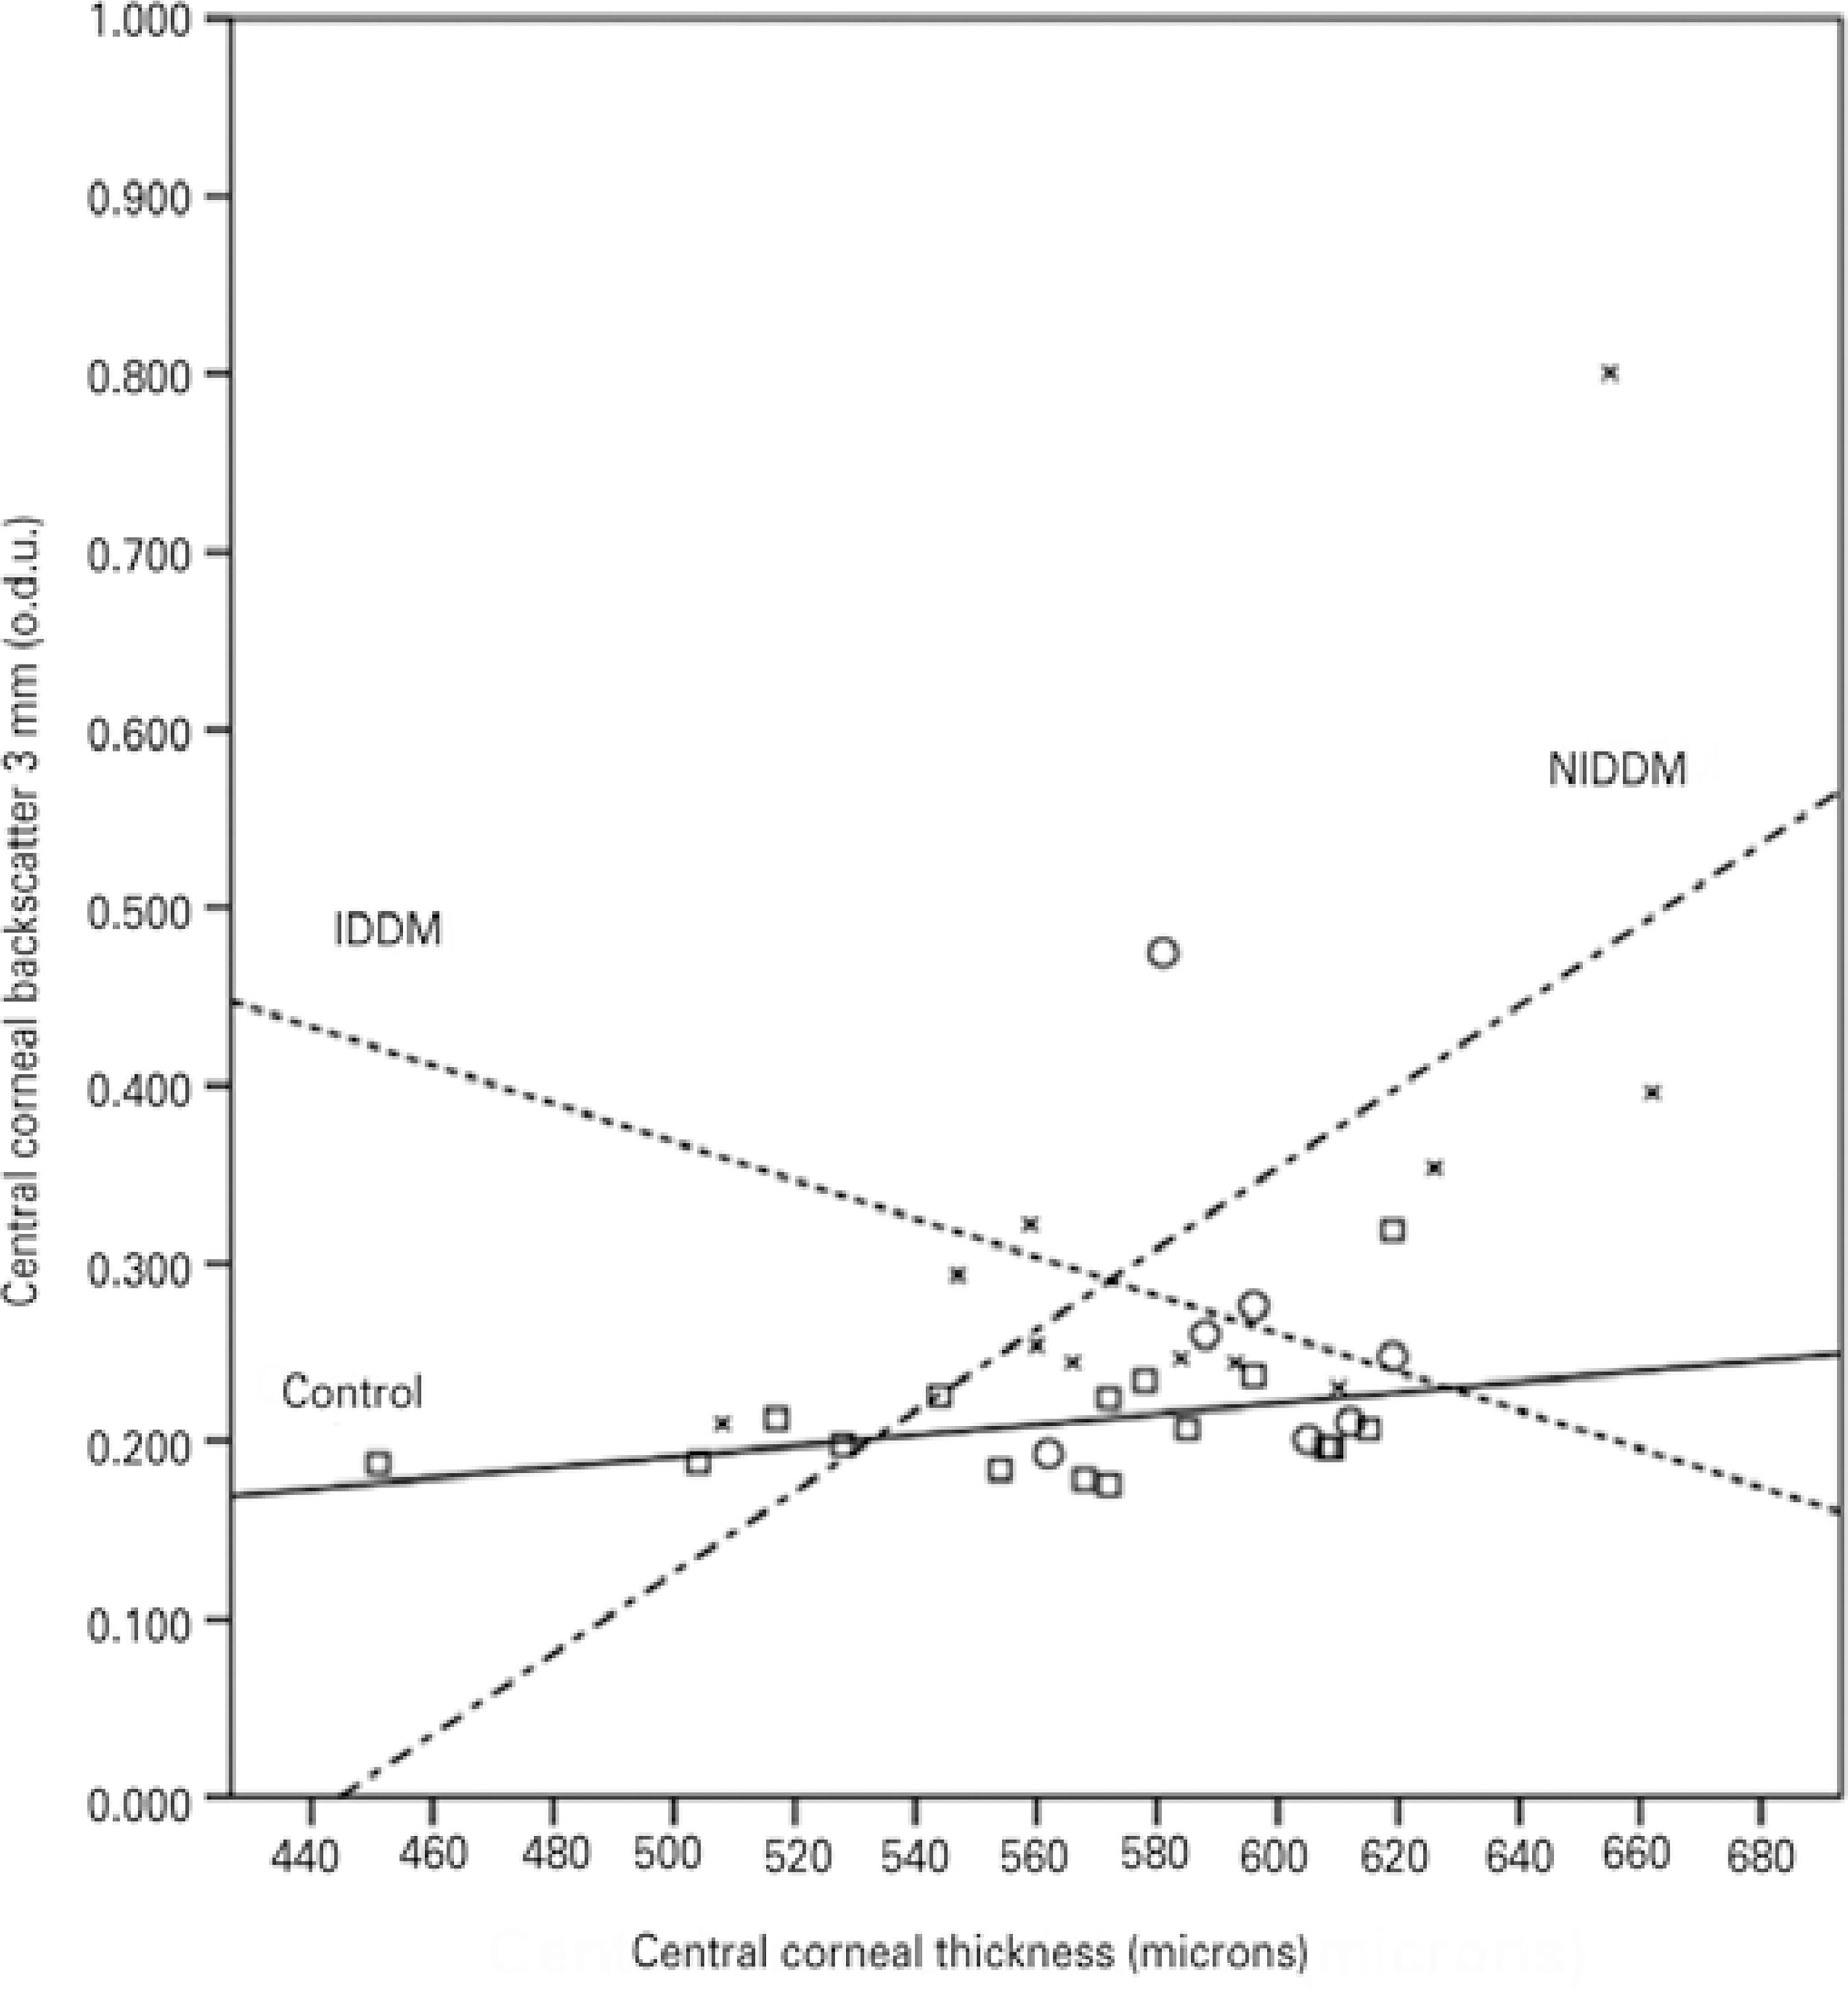
Figure 5 Correlations between corneal backscatter for the central 3 mm and central corneal thickness in the control subjects (squares and solid line; r=0.400; p>0.05), the patients with insulin-dependent diabetes mellitus (IDDM) (circles and dotted line; r=-0.071; p>0.05), and the patients with non-insulin-dependent diabetes mellitus (NIDDM) (blades and dotted/dashed line; r=0.641; p<0.05).
Figure 6 shows the optical density profiles of IDDM and NIDDM patients and their age-matched controls. All participants had a higher peak of optical density that decreased axially across the corneal thickness. This peak was particularly high for the NIDDM and IDDM patients.
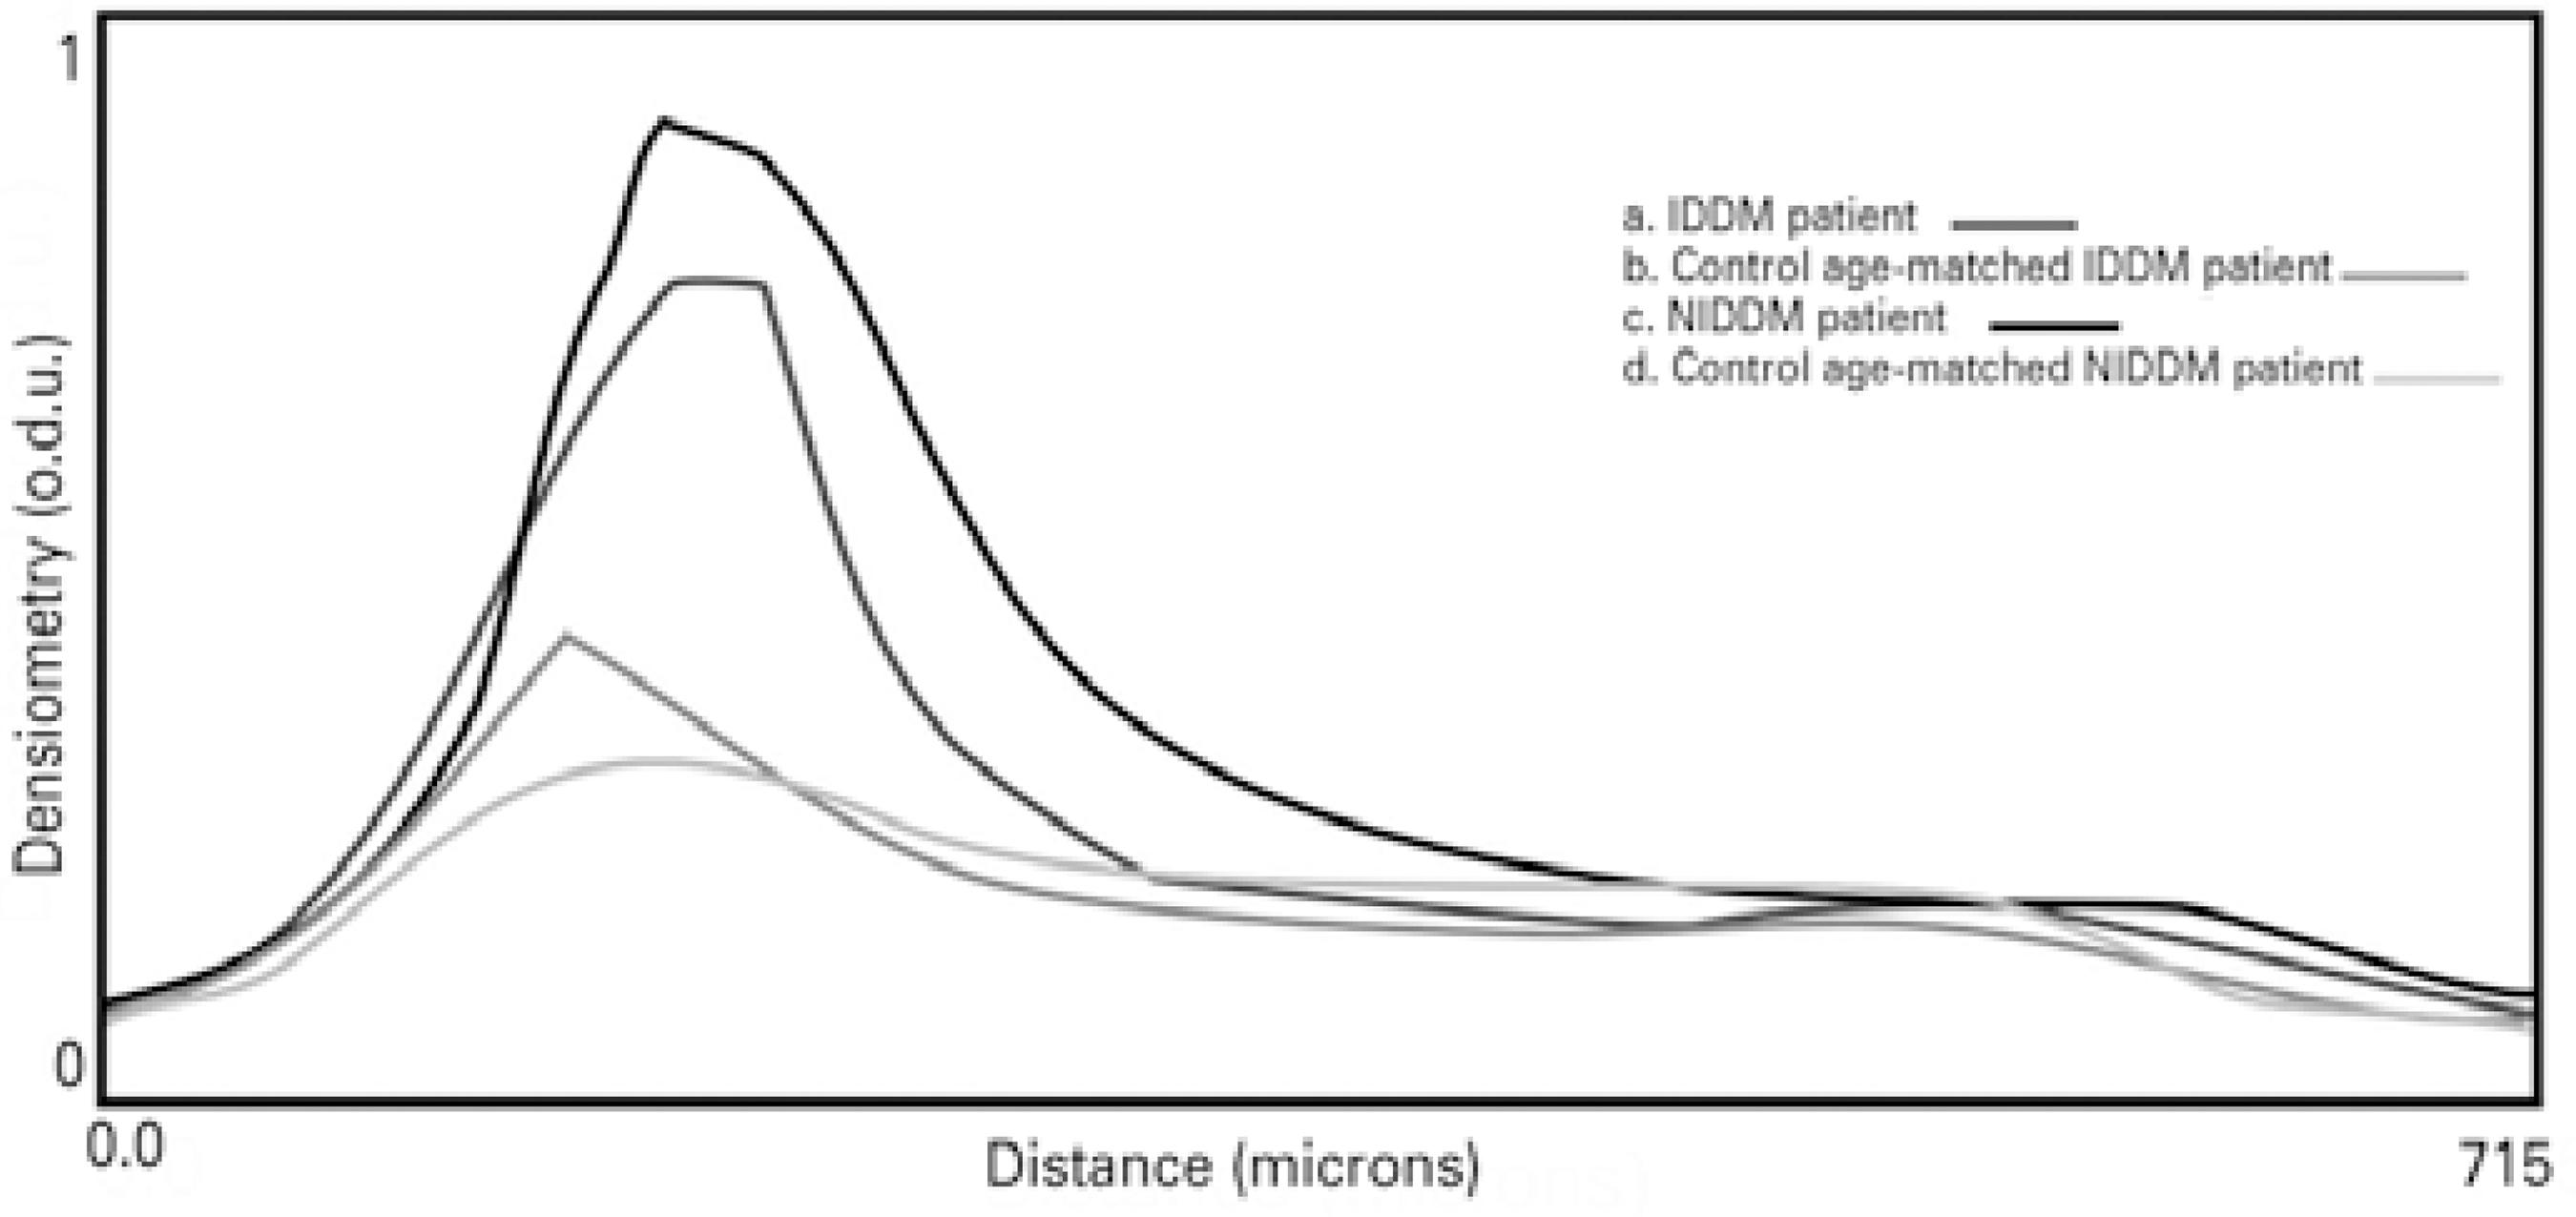
Figure 6 Corneal images from Scheimpflug photography and corneal densitometry profiles for the diabetic patients and age-matched controls. a. Patients with insulin-de pendent diabetes mellitus (IDDM). b. Control subjects age-matched to the IDDM patients. c. Patients with non-insulin-dependent diabetes mellitus (NIDDM). d. Control subjects age-matched to the NIDDM patients.
DISCUSSION
Scheimpflug imaging has been widely used to assess the quality of transparent tissues of the anterior segment of the eye by measuring light backscatter. The optical quality of these ocular diopters can be affected by aging(22), ocular/refractive surgery(23,24), or diseases such as DM(14,15,25,26).
In healthy subjects, an increase in corneal light scattering has been shown to be related to disruption of the orientation of collagen fibers with age(9) and to fluctuations in the refractive indices of edematous corneas(27). In addition to these age-related changes, corneal changes due to DM have been studied in detail, with abnormalities of the basement membrane(2,4), alterations of epithelial(1) and endothelial barriers function(2), corneal edema(3), increased corneal thickness(4), and polymegathism or pleomorphism observed in diabetic patients(4,5). These structural, physiological, and morphological changes can potentially increase the light backscattered by the cornea.
To determine whether these diabetes-related abnormalities cause changes in the optical quality of the cornea, the present pilot study determined using a external software central corneal backscatter through the image analysis of Scheimpflug images. Diabetic patients showed higher values of optical density than the age-matched control subjects for both the 3-mm and 5-mm central zones (Table 1).
The presence of DM had a significant effect on corneal backscatter (Figures 2 and 3), but CCT and BCVA values did not differ significantly between the diabetic and control groups (Table 1). Although the statistical power of the present study was not sufficiently high to de termine the significance of differences in CCT values, a previous study by the authors assessed the effect of diabetes duration and glycemic control over endothelial cell density (ECD) and CCT with a larger sample size and found that diabetic patients with more than 10 years of diabetic duration and poor glycemic control (based on a 7.5% cut-off value of HbA1c) showed significantly increased CCT(28).
Previously, Holden et al. did not observe differences in central corneal backscatter between patients with IDDM of at least 10 years' duration (n=22) and control subjects (n=29) using the Ocular Modular Cataract Image Analysis System (OMCIAS)(19). The disagreement with the results of the present study could be due in part to their control subjects being statistically older than the diabetic patient sample as they did not use age-matching.
An increase in light scattering in the corneal epithelial basement membrane has been observed in diabetic patients(14,15). Smith et al. suggested that the greatest scatter was observed in areas where there was a large change in refractive index, such as the epithelial and endothelial surfaces(12). Morishige et al. identified three peaks in the tissue reflectivity diagram (14). These peaks corresponded to the interface between the tear film and the corneal epithelium, between the epithelial basal cell layer and the anterior stroma, and between the posterior stroma, Descemet's membrane, and the endothelium with aqueous humor. The stroma was located between the second and third interfaces(14). Due to the limited resolution of the Scheimpflug imaging system used in the present study, the tear film and the different corneal layers could not be differentiated. Corneal backscatter was not evenly distributed along the corneal axis. A peak of light backscatter was observed in the anterior corneal layers, which may have corresponded to the interface between the tear film and the epithelium-Bowman's membrane. This peak was higher in most of the diabetic patients compared to the control subjects (Figure 6). Thus, an increase of backscatter may be caused not only by corneal changes related to DM, but also by changes in tear film composition(6); dry eye as consequence of diabetes could contribute to this increase. The optical quality and thickness of the tear film were not considered in the Scheimpflug imaging analysis in the present study, nor was dry eye analysis. Our diabetic patients did not report dry eye symptoms, although this condition is strongly linked to diabetes(29,30).
The peaks of optical density corresponding to the anterior cornea were similar to those observed by Takahashi et al. and Morishige et al.(14,15). In their studies, the patients presented with different stages of DR and they also showed high peaks of light backscattering corresponding to the interface of Descemet's membrane and endothelium with aqueous humor. This increase in backscatter in the posterior cornea has not been reported in healthy subjects(31,32). We observed that none of the participants enrolled in the present study showed high peak values at the level of the posterior surface interface.
Even though we did not obtain ECD values in this study, in a pre vious study diabetes duration and poor glycemic control caused a significant reduction in ECD in patients with a diabetes duration of more than 10 years(28). It is possible that ECD values were reduced in this study because the duration of diabetes of our patients was longer than 10 years. Age-related corneal changes are more evident in the corneal periphery than in the central zone(12). Although, in this study, no significant differences were found between the two zones in the diabetic patients, in the NIDDM patients only, patients' age was correlated with the central 5-mm corneal backscatter. It is possible that corneal changes caused by DM are more important in the central zone than in the periphery. The combination of age-related and DM-related changes resulted in aging of the overall cornea without differences between the zones. We observed that backscatter from the central 3 mm was higher than from the 5-mm zone in the control subjects, implying a decrease in corneal backscatter from the apex towards the periphery in these subjects. Rozema et al. determined this decrease may be due to an artifact resulting from the angle under which the cornea was illuminated in the peripheral areas.(31).
In the present study, backscatter from both central zones, 3 mm and 5 mm, showed correlations with age and CCT (Figures 4 and 5). The increase in central corneal backscatter with CCT could be due to an increase of corneal hydration, although Smith et al. presented evidence that variations in corneal thickness were caused by changes in the mass content rather than the water content of the cornea(12). The increasing corneal backscatter with age may be due to structural, physiological, and morphological changes undergone by the corneas of diabetic patients, as NIDDM patients showed higher corneal backscatter values than the age-matched control group and age did not differ statistically between the groups. However, diabetes duration and the severity of DM did not correlate with central corneal backscatter from either zone in the NIDDM patients. This may be due to the wide variation in the duration of the disease in the sample (from 1 month to 40 years). The increase in corneal central backscatter in the IDDM patients was not correlated with age, CCT, diabetes duration, or the severity of DM.
Although previous studies have shown an increase in corneal backscatter with the severity of DM(14,15), this relationship was not observed in the present study, perhaps because of the pilot character of the study, and thus the reduced sample size, or because representation of the different stages of DR was not considered in this study.
The measurements of corneal backscatter using optical density analysis showed homogeneity in both groups of participants. The CV was 2.1% for the diabetic patients and 2.3% for the control subjects.
The main limitation of this study was its small sample size. Another limitation was the fact that DR stages were not considered. All findings should therefore be interpreted with care. Although the sample size was small and the methods used to quantify corneal backscatter have not yet been validated, the results obtained from this pilot study suggest the possibility of conducting further studies to confirm and consolidate these results in larger cohorts of diabetic patients with different ranges of diabetes duration and stages of DR, as well as in prediabetic and healthy subjects.
In summary, the use of Scheimpflug imaging and external software for optical density calibration enabled the detection of significant differences in central corneal backscatter between diabetic patients and healthy subjects. These results show the potential of optical quality measurements for monitoring changes caused by DM.


 English PDF
 Print
Print
 Send this article by email
 How to cite this article
 Submit a comment
 Mendeley
 Scielo
 Pocket
 Share on Linkedin

