INTRODUCTION
Melanocytic choroidal nevi are the most common intraocular tu mors(1-4), with a prevalence of 6.5% in Caucasian populations(2).
Most choroidal nevi do not undergo malignant transformation throughout the patient's life, but some can grow during adulthood (1 in every 160 cases in 5 years)(5) and/or undergo malignant transformation to choroidal melanoma, with an incidence of approximately 1 in 8000 cases per year(3). Several studies reported risk factors for the malignant transformation of choroidal nevi as follows: thickness >2 mm, presence of adjacent subretinal fluid, orange pigmentation, nevus margin located ≤3 mm from the optic disc, presence of associated symptoms(2,4-6), presence of lesions detected via A-mode ultrasound (US) characterized by medium/low homogeneous internal reflectivity and the absence of choroidal hollowing(6), and the absence of retinal drusen(6). The presence of three or more risk factors indicates a >50% probability of tumor growth within 5 years(2,6).
The detection of growth in the early stages is the most reliable predictive factor for lesion transformation into a melanoma. Considerably, US has an important role as it allows the accurate measurement of the height of lesions and size comparisons at different time intervals (every 6 months to 1 year)(4). One of the disadvantages of US is the inability to detect flat or minimally elevated nevi (<1 mm in height)(7).
Other complementary methods such as fluorescein angiography, autofluorescence imaging, and optical coherence tomography (OCT) are important during the evaluation and follow-up of choroidal nevi(2,8-11). OCT can identify factors that increase the risk of malignant transformation, including subretinal fluid (even when the volume to be clinically detected is small), cystoid macular edema, and changes in the retinal pigment epithelium; however, it does not infer much importance during the diagnosis itself(9,10).
The use of OCT to measure choroidal thickness has been studied in both normal eyes(12) and those with complications(13-15). The use enhanced depth imaging (EDI)-OCT is an additional, innovative diagnostic imaging modality implemented in the SPECTRALIS(r) OCT apparatus. The EDI mode is a modality enabling high-resolution OCT imaging of external retinal layers, the choroid, and the lamina cribrosa. It allows the detection of structural changes "beyond the RPE" in a reproducible manner, which is difficult to achieve using standard OCT. EDI-OCT measures the distance between the RPE and the chorioscleral interface to obtain the choroidal thickness.
This study aimed to compare measurements of lesions clinically diagnosed as choroidal nevi using SD-OCT and 10- or 20-MHz US.
METHODS
This prospective study, which was conducted between May and December 2011, evaluated patients from the Ocular Oncology Sector of Universidade Federal de São Paulo, who received a clinical diagnosis of choroidal nevus as assessed by two experts in ocular oncology using photographic documentation of the lesion (retinography) and ocular US.
The study was approved by the Ethics Committee of the University, and all patients read and signed a consent form.
All eyes exhibited optical transparency, and the location of the lesion permitted OCT examination.
US images were obtained using A- and B-mode 10- and 20-MHz transducers (Ultrascan(r), Alcon, Fort Worth, TX, USA). The examinations were performed with the patient in the supine position with standardization of instrument parameters and examination techniques. For the 10-MHz transducer, the transpalpebral technique was adopted, which involved the application of gel on the closed eyelid with a gain of 60 dB and depth of 40 mm, to identify the lesion and measure the anteroposterior (AP) and transverse (T) basal diameters and height. Using the 20-MHz transducer, the direct contact technique was adopted under topical anesthesia, and it involved the application of gel over the conjunctiva with a gain of 65 dB to identify the lesion and determine its size. In both techniques, a gain of 75 dB and depth of 30 mm were used to assess the vitreous cavity.
After mydriasis, all eyes were examined using SD-OCT (Spectralis, Heidelberg Engineering, Inc.) in the EDI mode with a 20 × 30 degree field, a linear section with a length of 9 mm, a resolution of 100 sections, and a total of 1536 scans per second in the A-mode to generate an axial resolution of 7 microns, as described previously(15).
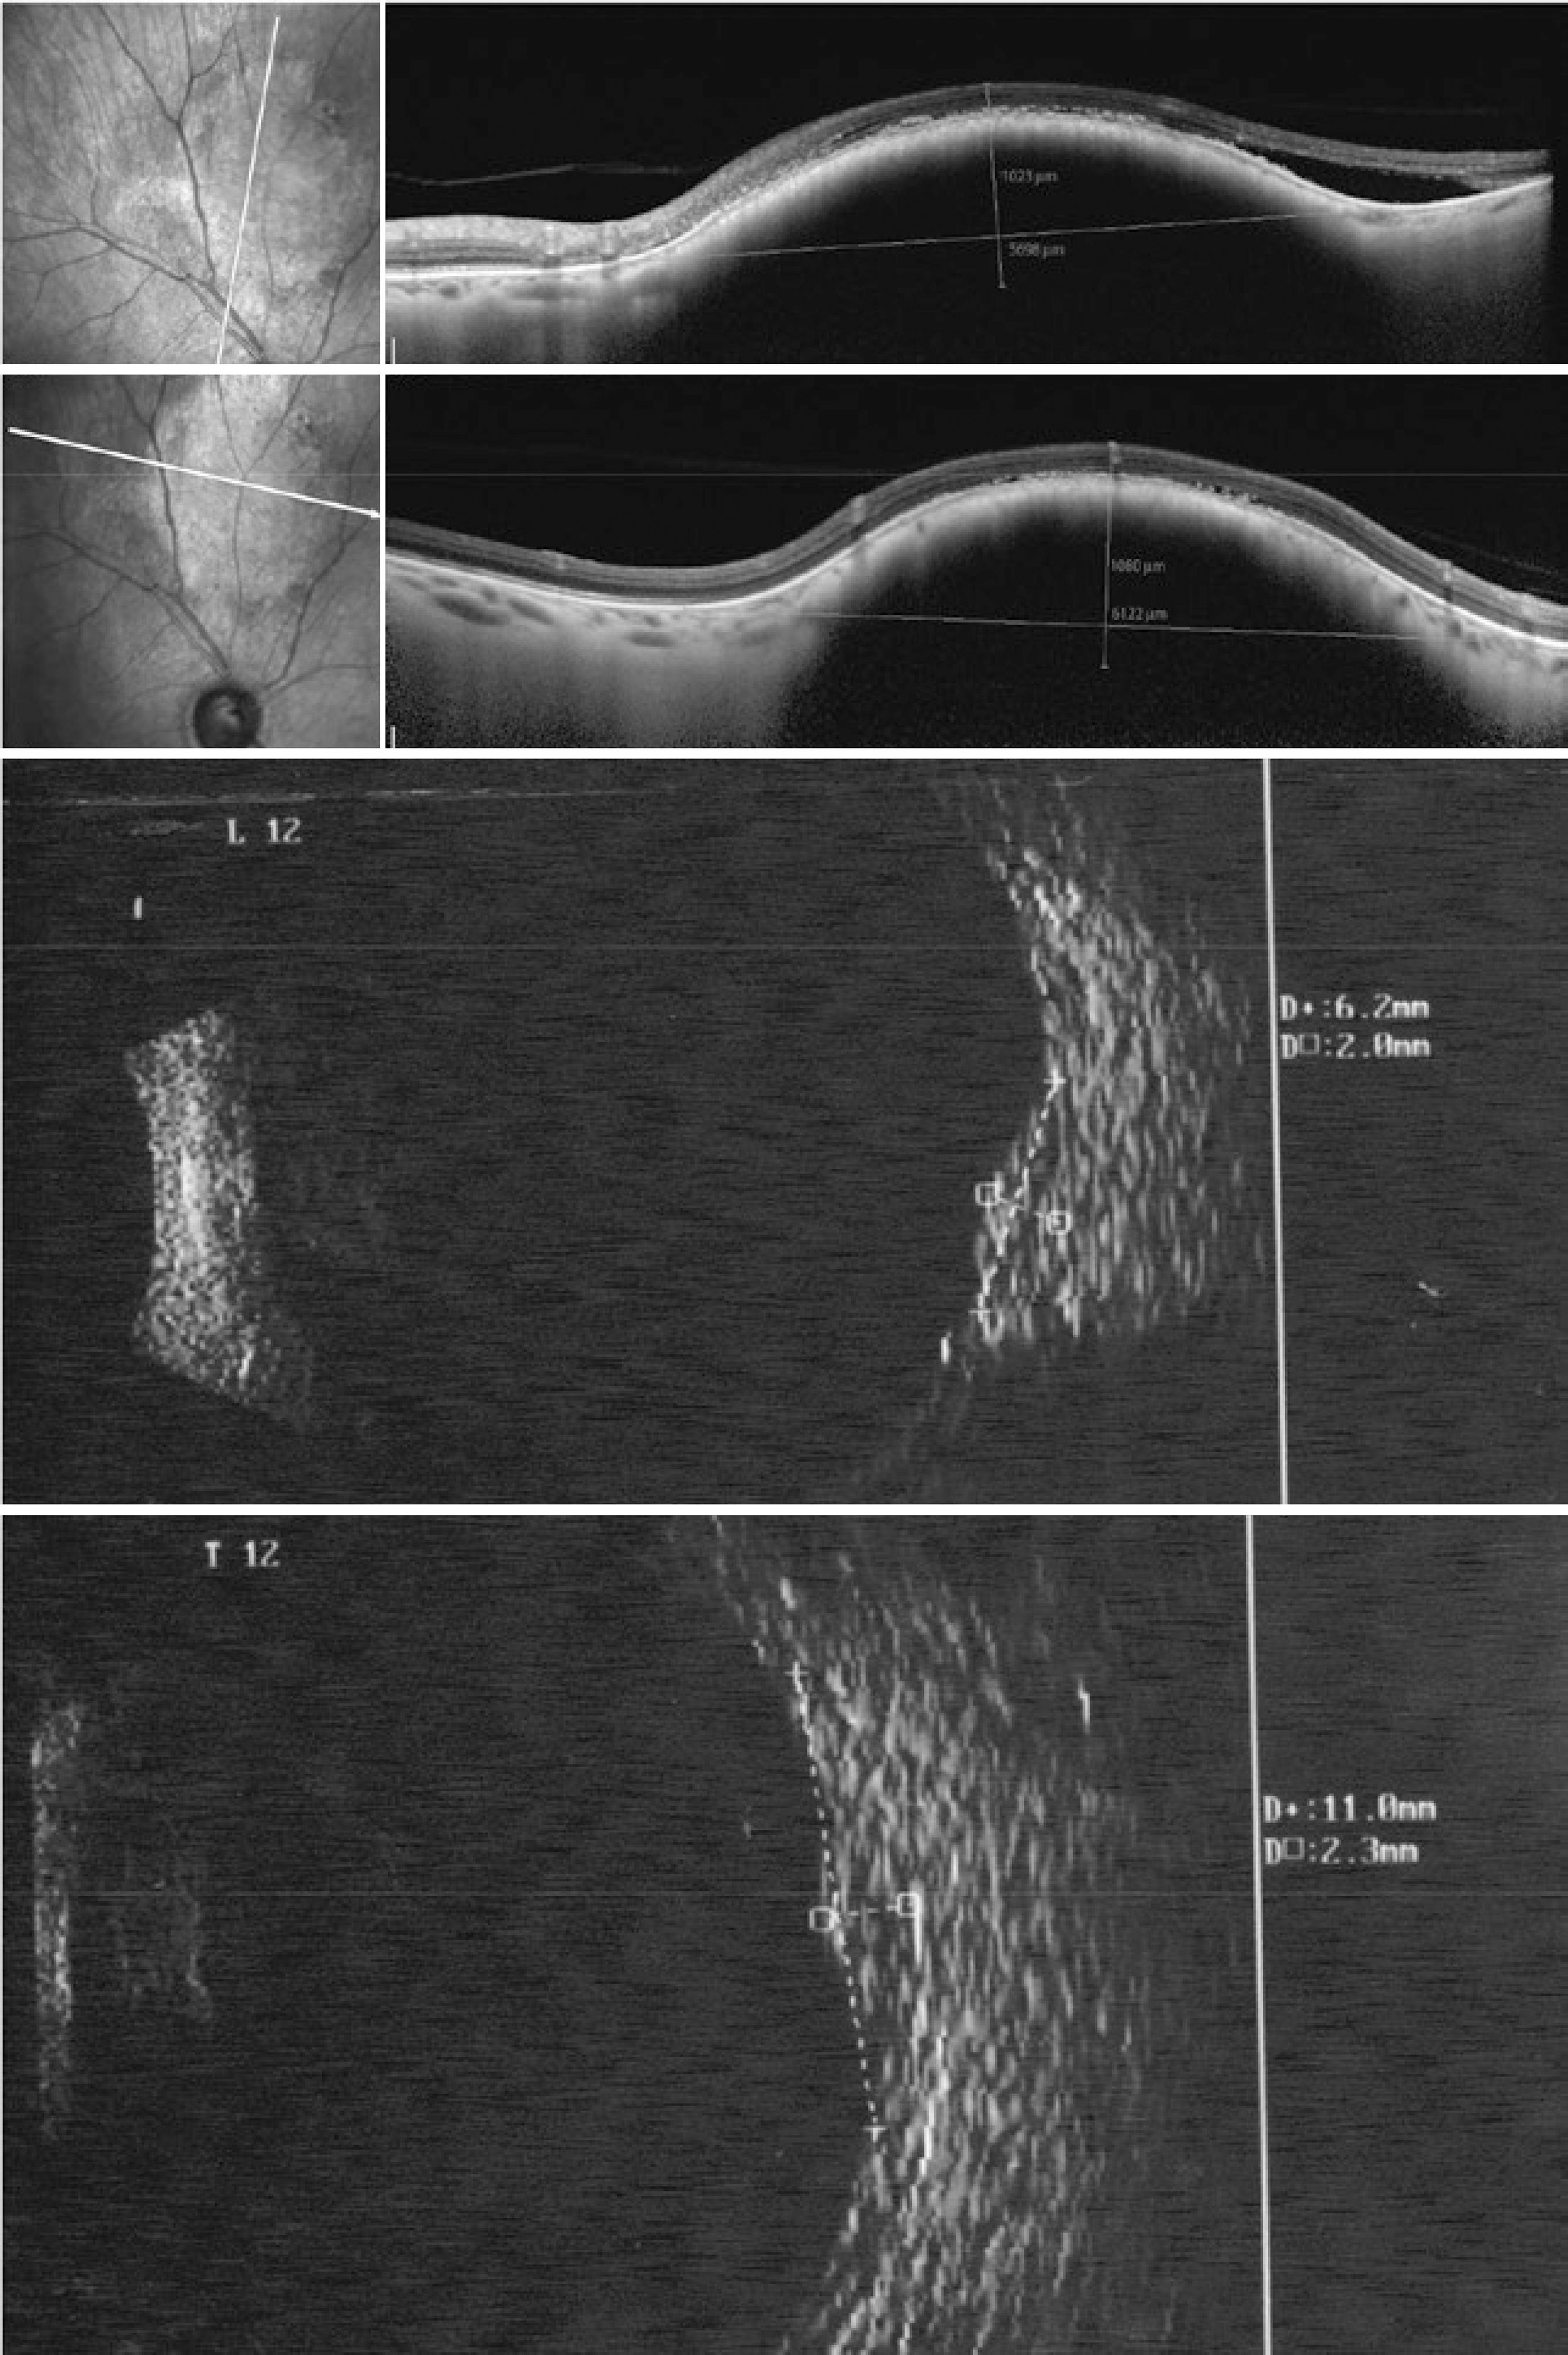
Measurements were obtained by both methods (US and OCT) in the same manner. The AP diameter was measured from the optic nerve toward the periphery, the transverse (T) basal diameter was acquired perpendicular to the AP, and height was measured between the internal limiting membrane and the top of the sclera. When it was impossible to see the sclera on OCT due to the shadow caused by the high internal reflectivity of the nevus, an imaginary line was drawn to join the images from the origin of the adjacent sclera, and this line was considered the posterior limit of the lesion (Figure 1).

Figure 1 Choroidal nevus located at the posterior pole. Anteroposterior diameter, 6.2 (20-MHZ ultrasound , lower left) and 5.59 mm (optical coherence tomography , top left); transverse diameter, 11.0 (20-MHZ US, lower right) and 6.12 mm (OCT, top right, dimension apparently undersized on OCT); height, 2.3 mm (20-MHZ US, lower right) and unfeasible to determine on OCT (top right) because the limit between the choroid and sclera was unclear. In the upper left image, OCT revealed the presence of subretinal fluid adjacent to the lesion
SD-OCT examinations were performed by examiners blinded to the US examination results on the same date.
To detect differences between measurement protocols for each of the methods employed (10- and 20-MHz US and SD-OCT) and between the AP and T diameters and height, analysis of variance was performed using repeated measures after the measurement of each dimension in triplicate, corresponding to one measurement on each apparatus used. Differences were also found between the sexes. Age was used as a covariate, and its possible effects were removed from the model. For the multivariate statistical test, Pillai's trace was calculated, as it is more robust for the assumption of violations in the model, as reported by Olsen (1974). When sphericity could not be assessed using Mauchly's sphericity test, the degrees of freedom of the univariate tests were adjusted by the lower limit of epsilon (most conservative). Results with p≤0.05 were considered significant, and the alpha value was adjusted by the Bonferroni correction when necessary.
RESULTS
We evaluated 14 eyes from 12 patients (six males) with a mean age of 64.5 years.
Considering the location of the choroidal nevus, eight (57.15%) lesions were located in the equator, five lesions (35.71%) were located in the posterior pole (one with a peripapillary location), one (7.14%) lesion was located in the transition between the equator and periphery (7.14%), and all 14 lesions were melanocytic.
Table 1 shows the dimensions calculated for each lesion using distinct methods. The greatest length measurable by OCT was 9 mm. Cases in which the length of the choroidal nevus exceeded 9 mm, measurement of this dimension using OCT was unfeasible.
Table 1 Dimensions of choroidal melanocytic lesions diagnosed as choroidal nevi using 10- and 20-MHz US and SD-OCT
| ID | Eye | Location | Age (years) | 10-MHz US | 20-MHz US | SD-OCT |
|---|---|---|---|---|---|---|
| (mm) | (mm) | (mm) | ||||
| 02 | OS | Posterior pole, peripapillary | 28 | AP: 15.1 | AP: 14.8 | AP: 4.73 |
| T: 14.3 | T: 14.3 | T: 4.69 | ||||
| H: 1.2 | H: 1.2 | H: 0.59 | ||||
| 03 | OD | Temporal inferior posterior pole | 60 | AP: 6.0 | AP: 10.6 | AP: NM |
| 7 h | T: 9.0 | T: 8.9 | T: NM | |||
| H: 0.8 | H: 1.1 | H: 0.15 | ||||
| 04 | OD | Temporal superior posterior pole | 60 | AP: 8.4 | AP: 6.4 | AP: 7.86 |
| 10 h | T: 10.2 | T: 8.2 | T: NM | |||
| H: 1.2 | H: 0.9 | H: 0.34 | ||||
| 05 | OS | Temporal superior posterior pole | 60 | AP: 9.0 | AP: 6.3 | AP: NM |
| 2 h | T: 12.2 | T: 9.8 | T: NM | |||
| H: 0.8 | H: 1.0 | H: 1.16 | ||||
| 06 | OS | Temporal posterior pole | 66 | AP: 4.4 | AP: 4.4 | AP: 1.99 |
| 4 h | T: 3.5 | T: 3.9 | T: 2.33 | |||
| H: 1.0 | H: 1.0 | H: 0.22 | ||||
| 07 | OS | Temporal superior posterior pole | 68 | AP: 7.0 | AP: 5.9 | AP: 1.76 |
| 1 h | T: 9.2 | T: 9.4 | T: 1.64 | |||
| H: 1.6 | H: 1.4 | H: 0.47 | ||||
| 08 | OD | Temporal inferior posterior pole | 60 | AP: 7.9 | AP: 7.7 | AP: 2.894 |
| 8 h | T: 8.8 | T: 8.4 | T: 2.894 | |||
| H: 1.8 | H: 1.6 | H: 0.552 | ||||
| 09 | OD | Superior posterior pole | 64 | AP: 6.6 | AP: 6.2 | AP: 5.60 |
| 12 h | T: 8.8 | T: 11.0 | T: 6.12 | |||
| H: 2.0 | H: 2.3 | H: 1.08 | ||||
| 10 | OS | Temporal posterior pole | 61 | AP: 5.6 | AP: 7.5 | AP: 1.576 |
| 4 h | T: 6.8 | T: 6.8 | T: 1.577 | |||
| H: 1.4 | H: 1.4 | H: 0.524 | ||||
| 11 | OS | Temporal superior posterior pole | 73 | AP: 7.0 | AP: 5.6 | AP: 4.23 |
| 1 h | T: 7.7 | T: 6.7 | T: 3.42 | |||
| H: 1.6 | H: 1.9 | H: 3.42 | ||||
| 12 | OD | Temporal inferior posterior pole | 80 | AP: 9.1 | AP: 9.7 | AP: NM |
| 8 h | T: 9.7 | T: 9.7 | T: 6.88 | |||
| H: 2.4 | H: 2.4 | H: 0.79 | ||||
| 13 | OD | Temporal superior posterior pole | 85 | AP: 10.7 | AP: 12.7 | AP: 3.84 |
| 10 h | T: 12.1 | T: 11.1 | T: 4.73 | |||
| H: 3.0 | H: 2.4 | H: 1.081 | ||||
| 14 | OD | Posterior pole | 65 | AP: 8.0 | AP: 7.1 | AP: 1.55 |
| 10 h | T: 9.1 | T: 11.2 | T: 1.38 | |||
| H: 1.5 | H: 1.6 | H: 0.41 |
ID= identification; OD= right eye; OS, left eye; AP= anteroposterior diameter; T= transverse diameter; H= height; NM= not measurable; US= ultrasound; SD-OCT= spectral domain optical coherence tomography.
The choroidal nevi located in the posterior pole were easily evaluated using OCT. For lesions located in the transition between the equator and periphery, patient cooperation was necessary; thus, the lesion from case 1 was not located.
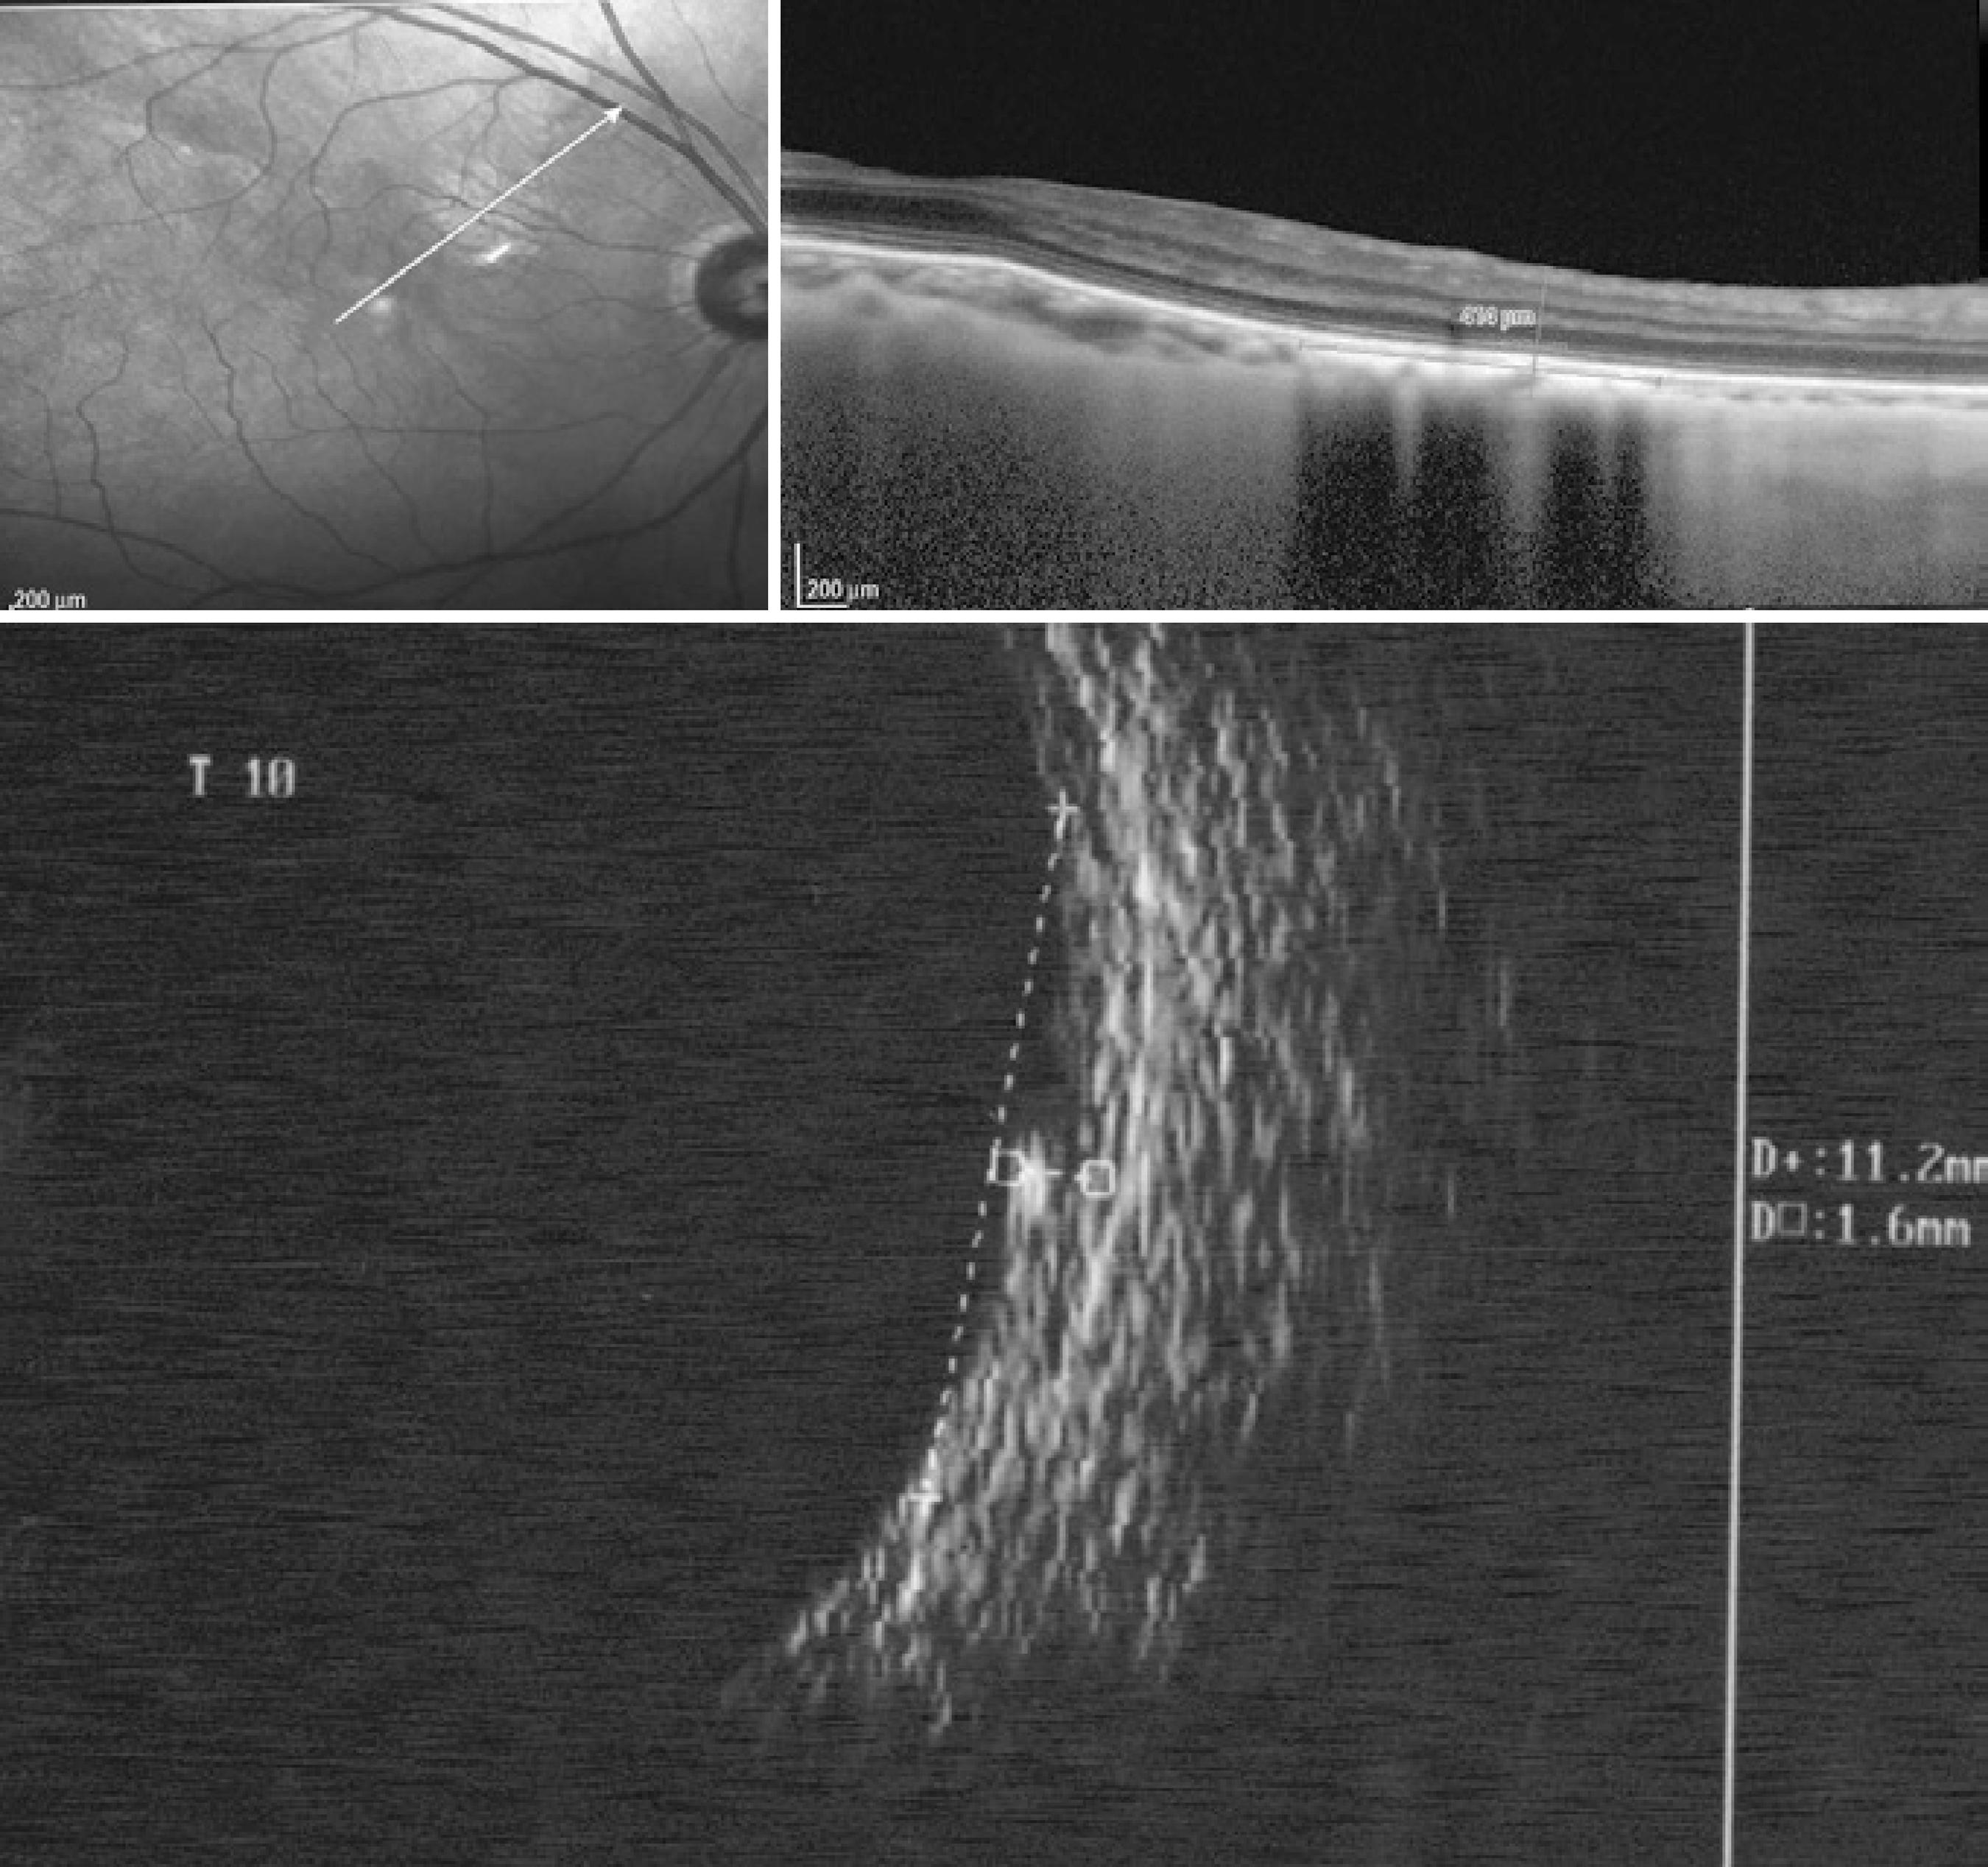
Height was the most difficult parameter to measure on OCT. For some choroidal nevi, it was possible to determine the origin of the sclera on OCT (Figure 2); however, in others, an imaginary line was drawn to join the images from the origin of the adjacent sclera, and this line was considered as the posterior limit of the lesion (Figure 1).

Figure 2 Choroidal nevus (case 14) located at the posterior pole and identified by spectral domain optical coherence tomography (0.41 mm in height) and a comparison with 20-MHz ultrasound (1.6 mm in height)
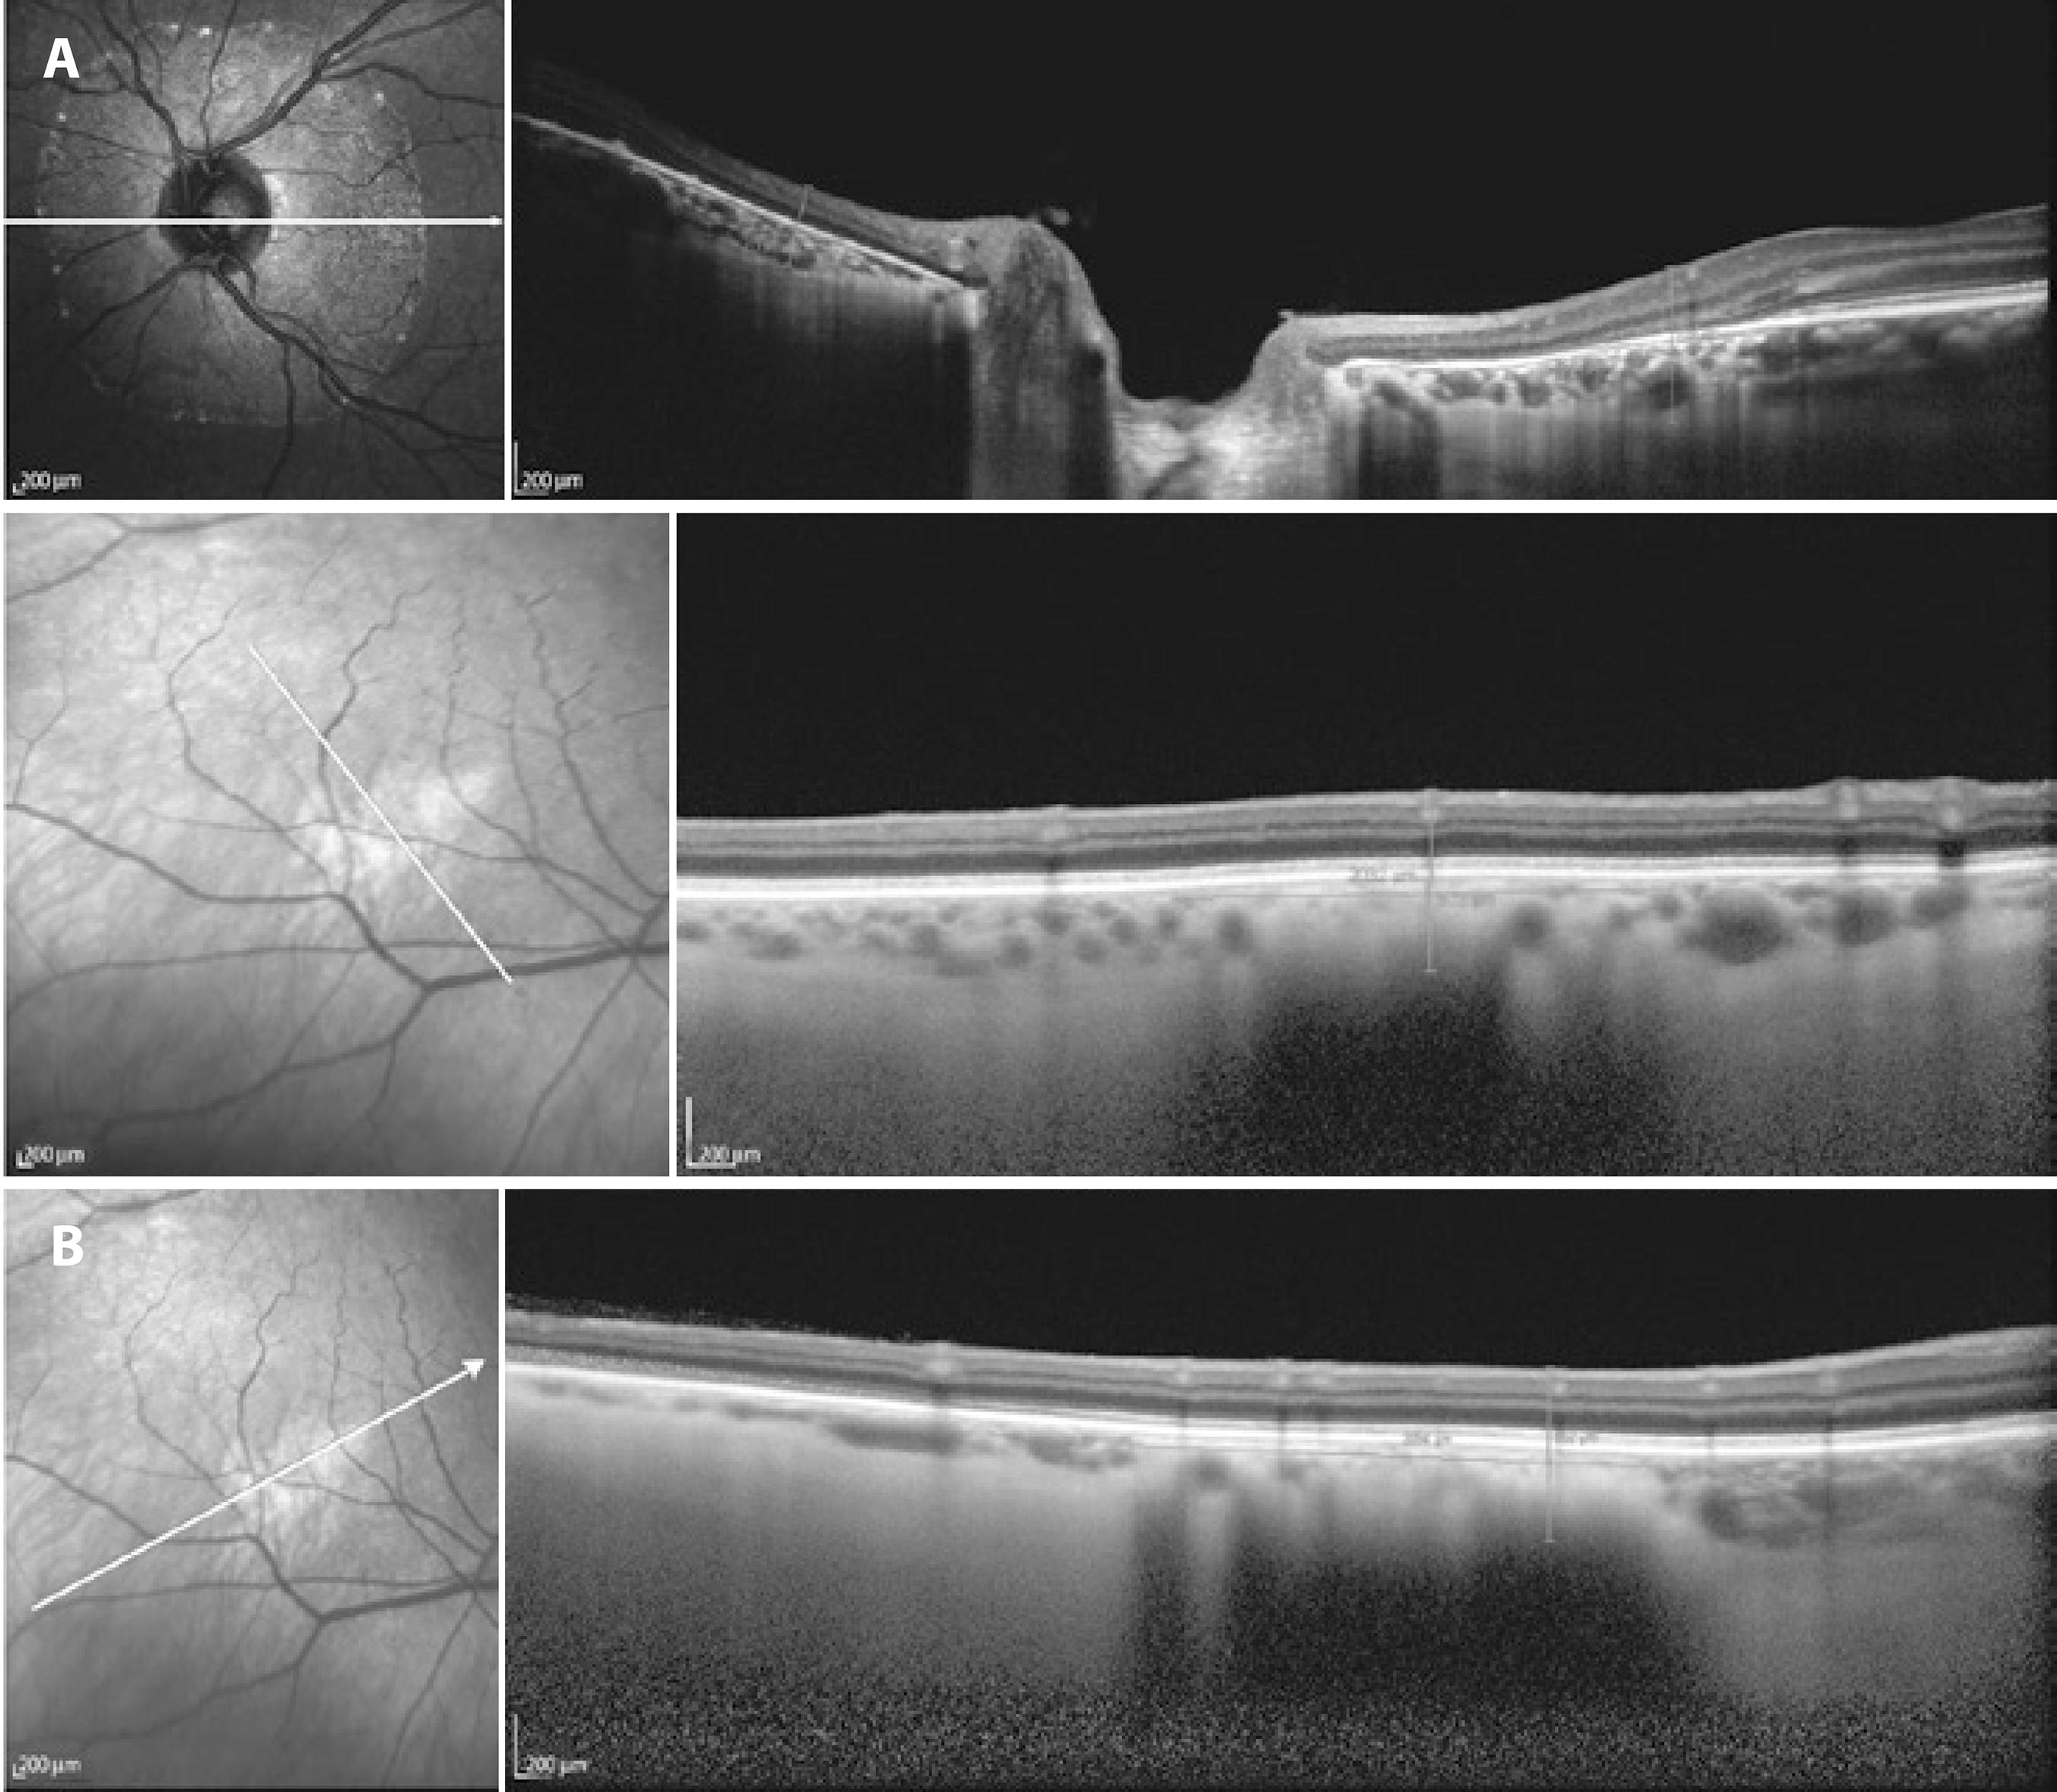
One choroidal nevus fully covered the papilla, and to define its size (Figure 3), the following US and OCT measurements were made: AP basal diameter, the sum of the measurement from the superior papillary margin to the upper limit of the lesion with the measurement from the inferior papillary margin to the lower limit of the lesion; and the T diameter, the sum of the measurement from the nasal papillary margin to the nasal limit of the lesion with the measurement from the temporal papillary margin to the temporal limit of the lesion.

Figure 3 A) Choroidal nevus on spectral domain optical coherence tomography. Peripapillary location indicating the limit between the choroid and sclera. Height, 0.59 mm. B) Nevus located at the posterior pole at which the limit between the choroid and sclera is not evident. The anteroposterior diameter was 2.894 mm, and the transverse diameter was 1.636 mm.
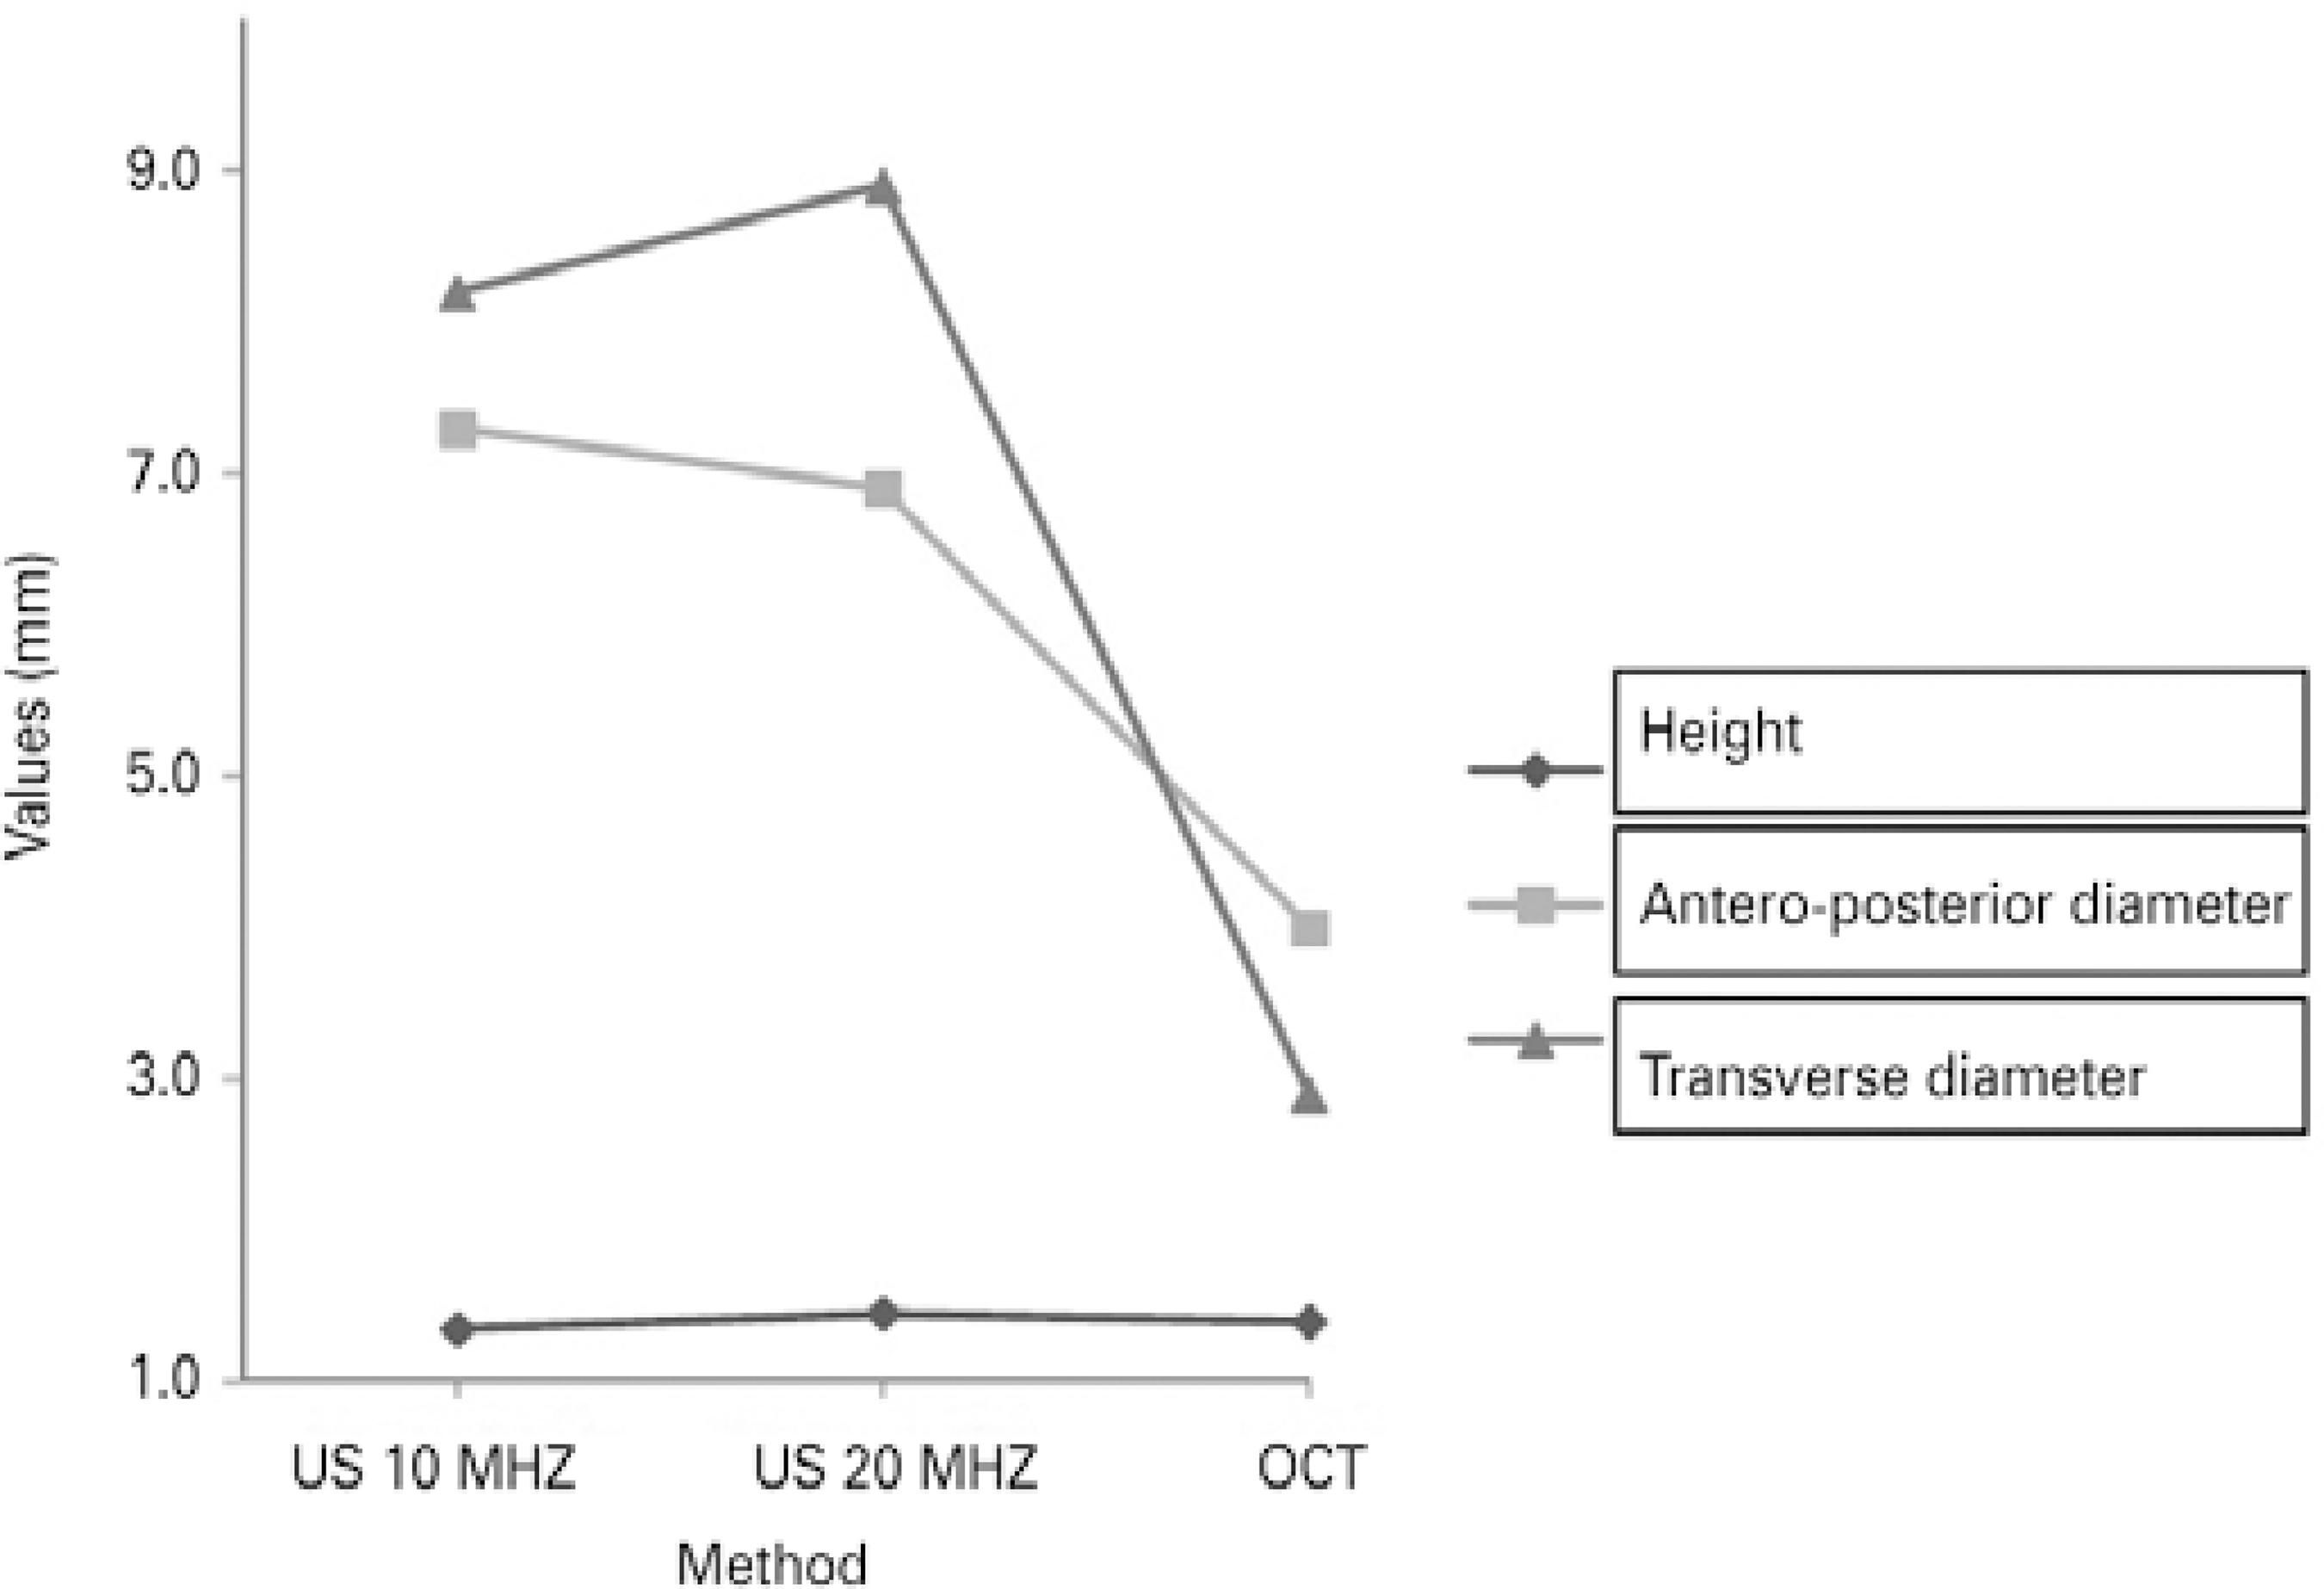
No significant difference in the AP diameter was observed between 10- and 20-MHz US measurements (F=0.165, p=0.696); however, these measurements were significantly larger than those obtained using OCT (F=18.559; p=0.00; Figure 4).

Figure 4 Correlation of the size of the choroidal nevus using 10- and 20-MHz ultrasound and spectral domain optical coherence tomography.
No difference in the T diameter was found between 10- and 20-MHz US measurements (F=0.505, p=0.497); however, these measurements were significantly larger than those obtained using OCT (F=38.713, p=0.0002; Figure 4).
No significant differences in height were observed among the techniques (10-MHz US, 20-MHz US, and SD-OCT).
DISCUSSION
US is considered as the most efficient method for assessing the dimensions of a choroidal nevus and identifying tumor growth. A comparison of images obtained using 10- and 20-MHz transducers illustrated that the 20-MHz probe had superior resolution to detect abnormalities in the eye wall and vitreoretinal interface(16).
In our analysis, although no significant difference was observed between the measurements of the choroidal nevus using the 10- and 20-MHz transducers (p<0.05), when the AP and T diameters and height were compared, better resolution was achieved using the 20-MHz probe under direct contact, resulting in a better definition of the lesion limits (Figure 1).
The 20-MHz transducer used for image acquisition was part of a specific model of ophthalmic ultrasound equipment (Ultrascan, Alcon). Considering that manufacturers use distinct methods for adjusting the image, depth of focus, and resolution in US transducers, the findings presented in this study should be correlated with the equipment model used.
OCT is recently used to identify factors that increase the risk of malignant transformation(8-10), but it has also proven beneficial for the serial monitoring of choroidal melanocytic lesions; however, it has restrictions for the measurement of AP and T diameters and height(7).
In one study(7), images of choroidal tumors located in the posterior pole were analyzed using Spectralis OCT in the EDI mode, and the researchers observed that the measurement of tumors with heights of <1 mm was feasible only on OCT because flat lesions were undetectable via US. According to these authors, the limitations of OCT include a maximum limit of measurement (9 mm) and better documentation of lesions located at the limit of the vascular arcades in the posterior pole.
In this study, tumors thinner than 1 mm could be measured by US, whereas OCT measurements were limited to a maximum length of 9 mm. AP and T diameters measured using US (10-MHz and 20-MHz transducers) were significantly larger (p<0.05) than those obtained using OCT. In some cases, US could assess dimensions >9 mm, and identification of the margins of the lesion using OCT was not feasible. It is assumed that US may overestimate measurements, primarily those of flat choroidal nevi, because lesion margins are poorly defined during the examination.
In OCT, the definition of lesion margins was dependent on identification of the artifact of attenuation caused by the lesion, which in turn was dependent on the amount of pigment present. Notably, some choroidal nevi lack homogeneous distribution of the pigment along their length. In poorly pigmented choroidal lesions, the images on OCT may be different, and they may be characterized by lower light attenuation, which may influence the accurate delimitation of the margin.
Height is the most important variable for the evaluation of benign melanocytic choroidal nevi. The level of difficulty in measuring AP and T diameters was identical using US and OCT, that is, the limits cannot be accurately assessed in all lesions. In OCT, height was the most difficult parameter to measure because the shadow caused by the high internal reflectivity of the nevus hindered visualization of the posterior limit of the lesion.
Height as measured using OCT was not significantly different (p<0.05) from that obtained using 10- or 20-MHz US.
According to one study(7), the posterior limit of the lesion, that is, the sclera, was observed only in melanocytic tumors with heights of <0.9 mm. In this study, the posterior margin of the tumor was observed in two cases in which the height detected using US was >1 mm (1.2 and 1.5 mm, respectively).
Comparative analysis of images obtained using 10- or 20-MHz US and OCT revealed no relationship between increased reflectivity on US and increased technical difficulty in visualizing the posterior scleral limit on OCT, as previously reported(17).
OCT could not assess lesions located peripherally. Considerably, it has been reported that the most suitable images are obtained at the posterior pole(7,18); however, after maximal mydriasis and with patient cooperation, images of nevi located beyond the posterior pole were acquired. These images were of poorer quality, and the maximum range was limited to the equator.
One should also consider that technological advancements may reduce the limitations of OCT in evaluating choroidal lesions, allowing the assessment of peripherally located and thicker lesions and consequently the measurement of OCT sections larger than 9 mm.
In the model tested, OCT was unfeasible for evaluating choroidal nevi located beyond the posterior pole, detecting lesions larger than 9 mm in length, and accurately assessing lesion height (thickness). Thus, it can be concluded that 10- and 20-MHz US were more suitable for serial measurements of choroidal nevi; however, small, flat, or slightly elevated choroidal nevi that are difficult to detect on US and are located in the posterior pole or the middle periphery can also be evaluated using OCT.
CONCLUSIONS
No significant differences in the AP and T diameters were obser ved between 10- and 20-MHz US measurements; however, these measurements (AP and T) were significantly larger than those obtained using OCT.
No significant differences in height were observed among the techniques adopted (10-MHz US, 20-MHz US, and SD-OCT).


 English PDF
 Print
Print
 Send this article by email
 How to cite this article
 Submit a comment
 Mendeley
 Scielo
 Pocket
 Share on Linkedin

