INTRODUCTION
Accurate determination of central corneal thickness (CCT) has become increasingly important in ophthalmic applications. CCT measurement is crucial in preoperative ocular evaluations, particularly when performing laser in situ keratomileusis because the amount of correction is limited by the corneal thickness(1). Moreover, this parameter is important in the risk assessment for glaucoma progression in patients with ocular hypertension and glaucoma(2). Corneal thickness measurements are also extensively used in the diagnosis of keratoconus and other corneal disorders(3).
There are several techniques used for CCT measurement. One of these, an ultrasound-based technique, is considered to be the gold standard. However, this is limited because it is a contact technique with the potential drawbacks of causing discomfort to patients and introducing measurement errors secondary to probe misplacement or corneal compression. Furthermore, this contact technique does not enable investigators to obtain a corneal pachymetry map, and the thinnest point of the cornea cannot be determined, although this is very important for decision-making in refractive surgery. Therefore, new non-contact CCT measurement techniques have been developed. At present, various non-contact imaging technologies are available for CCT measurement. Interferometry has been proposed to be more precise and reliable than ultrasound for CCT measurement(4,5). The relatively new Lenstar LS900 (Haag-Streit, Switzerland) instrument uses an interferometry technique to perform biometry of the whole eye in approximately 20 s per measurement(6).
Optical coherence tomography (OCT) is another imaging modality that provides noncontact measurement of CCT. Recently, Fourier domain OCT (FD-OCT) has demonstrated greater speed, shorter acquisition time, high resolution, and less motion error compared with a time-domain OCT (TD-OCT)(7). The commercially available FD-OCT (RTvue-100, Optovue Inc, Fremont, CA) has a scan rate of 26,000 A-scans per second and an axial resolution of 5 µm. It obtains high-resolution, cross-sectional images of the cornea and provides a pachymetry map(8,9).
The Scheimpflug camera (SC) combined with Placido corneal topography (Sirius; CSO Inc, Firenze, Italy) is a new topography device that enables rapid acquisition of cross-sectional images of the cornea. It can measure 35,632 points on the anterior corneal surface and 30,000 on the posterior corneal surface, in high-resolution mode, in approximately 5-6 s. A pachymetric map is then reconstructed using the point-by-point anterior and posterior corneal surface data(10).
These non-contact instruments have been shown to have good repeatability in normal eyes(3,6,9-15). However, there are limited data available regarding the agreement among CCT measurements obtained using OLCR, FD-OCT, and SC. The aim of the present study was to evaluate the level of agreement among CCT measurements acquired by these instruments.
METHODS
Twenty-five healthy subjects (15 females and 10 males) admitted for routine ophthalmic examination at Selcuk University Faculty of Medicine Ophthalmology Department were recruited for the present study. This study adhered to the tenets of the Declaration of Helsinki, and all subjects provided informed consent for participation. Inclusion criteria were a negative history of chronic ocular or systemic disease and ocular surgery and no signs of previous or present ocular disease; subjects with refractive errors over ±1 diopter spherical or cylindrical values were excluded. The age of the subjects ranged from 12 to 52 years (mean, 27.8 ± 7.2 years). CCT was measured in both eyes using OLCR, FD-OCT, and SC following a complete ophthalmic examination, but only the right eye of each subject was included in the study. The same examiner sequentially obtained the measurements using OLCR, FD-OCT, and SC. Three consecutive scans were obtained using each device. The mean values of these three readings was used for analysis.
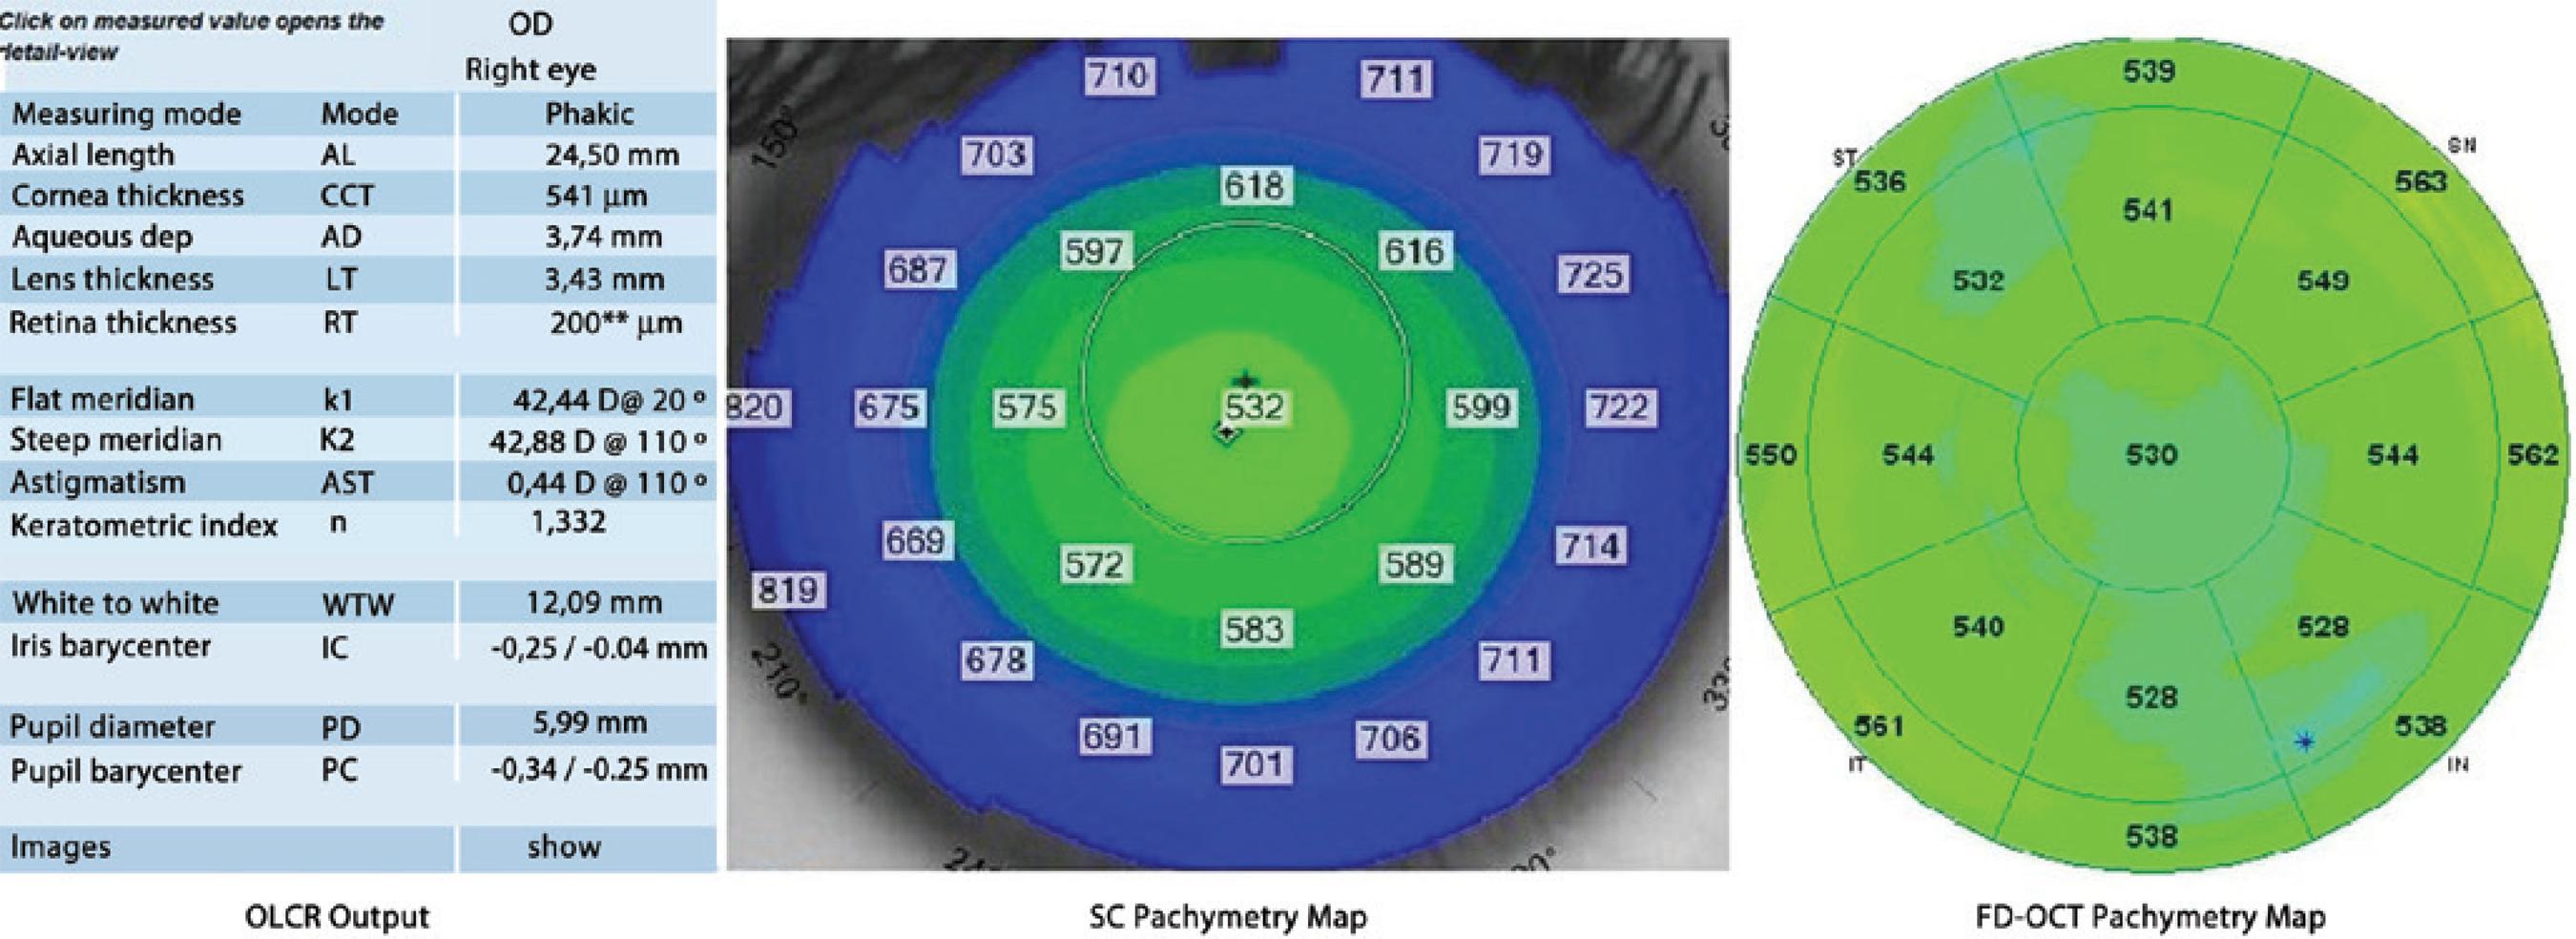
In the examination using OLCR, the subjects were asked to gaze at the round circle in front of them. The CCT measurements, which were automatically calculated by the internal software of the device, recorded, and interpreted. For the SC examination, the investigator observed the image of the eye on the monitor, brought the image into focus, and centralized it on the monitor. When the image was in focus, the CCT measurements were taken and assessed using the pachymetry map. For the FD-OCT examination, infrared lights were temporally placed to the subject’s eye to provide illumination of the ocular surface. CCT measurements, which were automatically assessed using the pachymetry map, were recorded and interpreted (Figure 1).

Figure 1 Optical low-coherence reflectometry output, Scheimpflug camera and Fourier domain optical coherence tomography pachymetry maps demonstrating central corneal thickness measurements obtained from a subject.
For optimal scan quality, the patients were instructed to blink completely just before each measurement to achieve proper ocular surface, to stare at the target, and not to blink during the measurement. Moreover, images were only obtained after a bright, centered corneal apex reflection during the SC and FD-OCT measurements. Repeat scans were performed if the signal strength index of the image was <30 during FD-OCT measurements and if poor acquisition quality was observed during SC measurements. Improper images were automatically excluded during OLCR measurements. Therefore, the study included only centered and proper scans.
Statistical analysis was performed using SPSS version 11.5 (SPSS Inc., Chicago, IL) for Windows (Microsoft Corporation, Redmond, WA). The descriptive statistics were presented as mean ± standard deviation. To ascertain the association between the three methods of evaluation, Spearman’s rank correlation coefficient (r) was calculated. The results of CCT measurements obtained using each device were compared by using a repeated-measures analysis of variance (ANOVA) test, and pair-wise comparisons were performed using Bonferroni adjustment tests. A p value <0.05 was considered to be statistically significant. Bland-Altman(16) analysis was used to demonstrate agreement between methods, and 95% limits of agreement (LOA) were calculated. Intra-examiner repeatability was determined using intraclass correlation coefficients (ICCs).
RESULTS
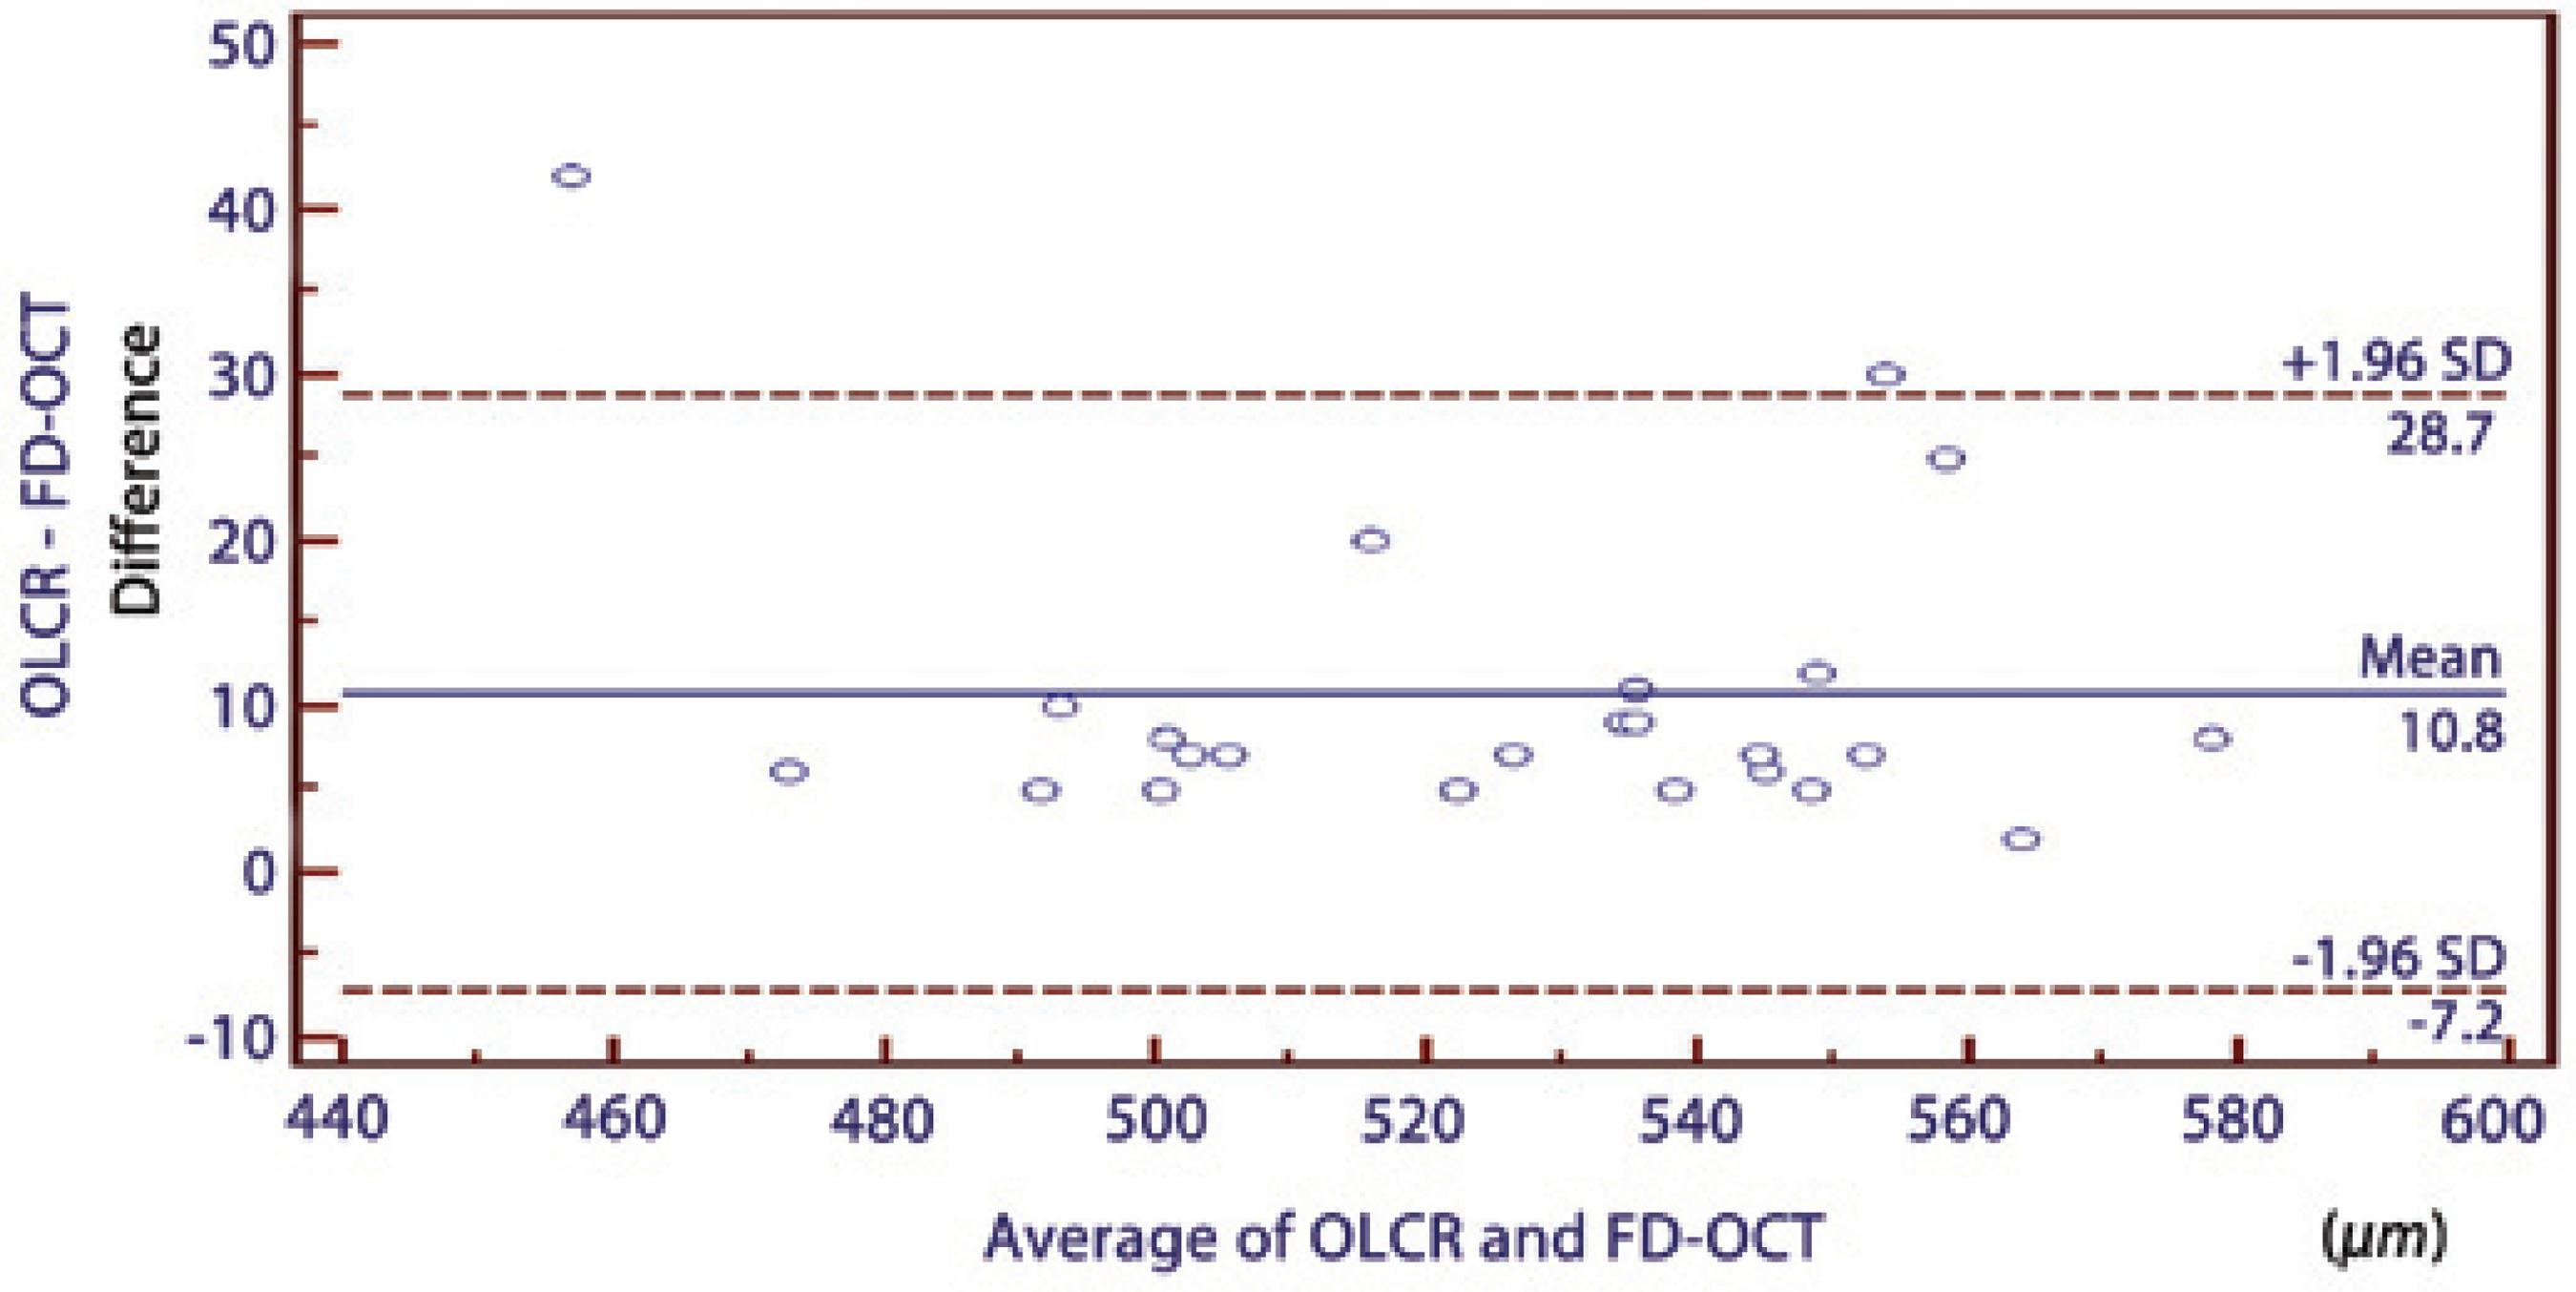
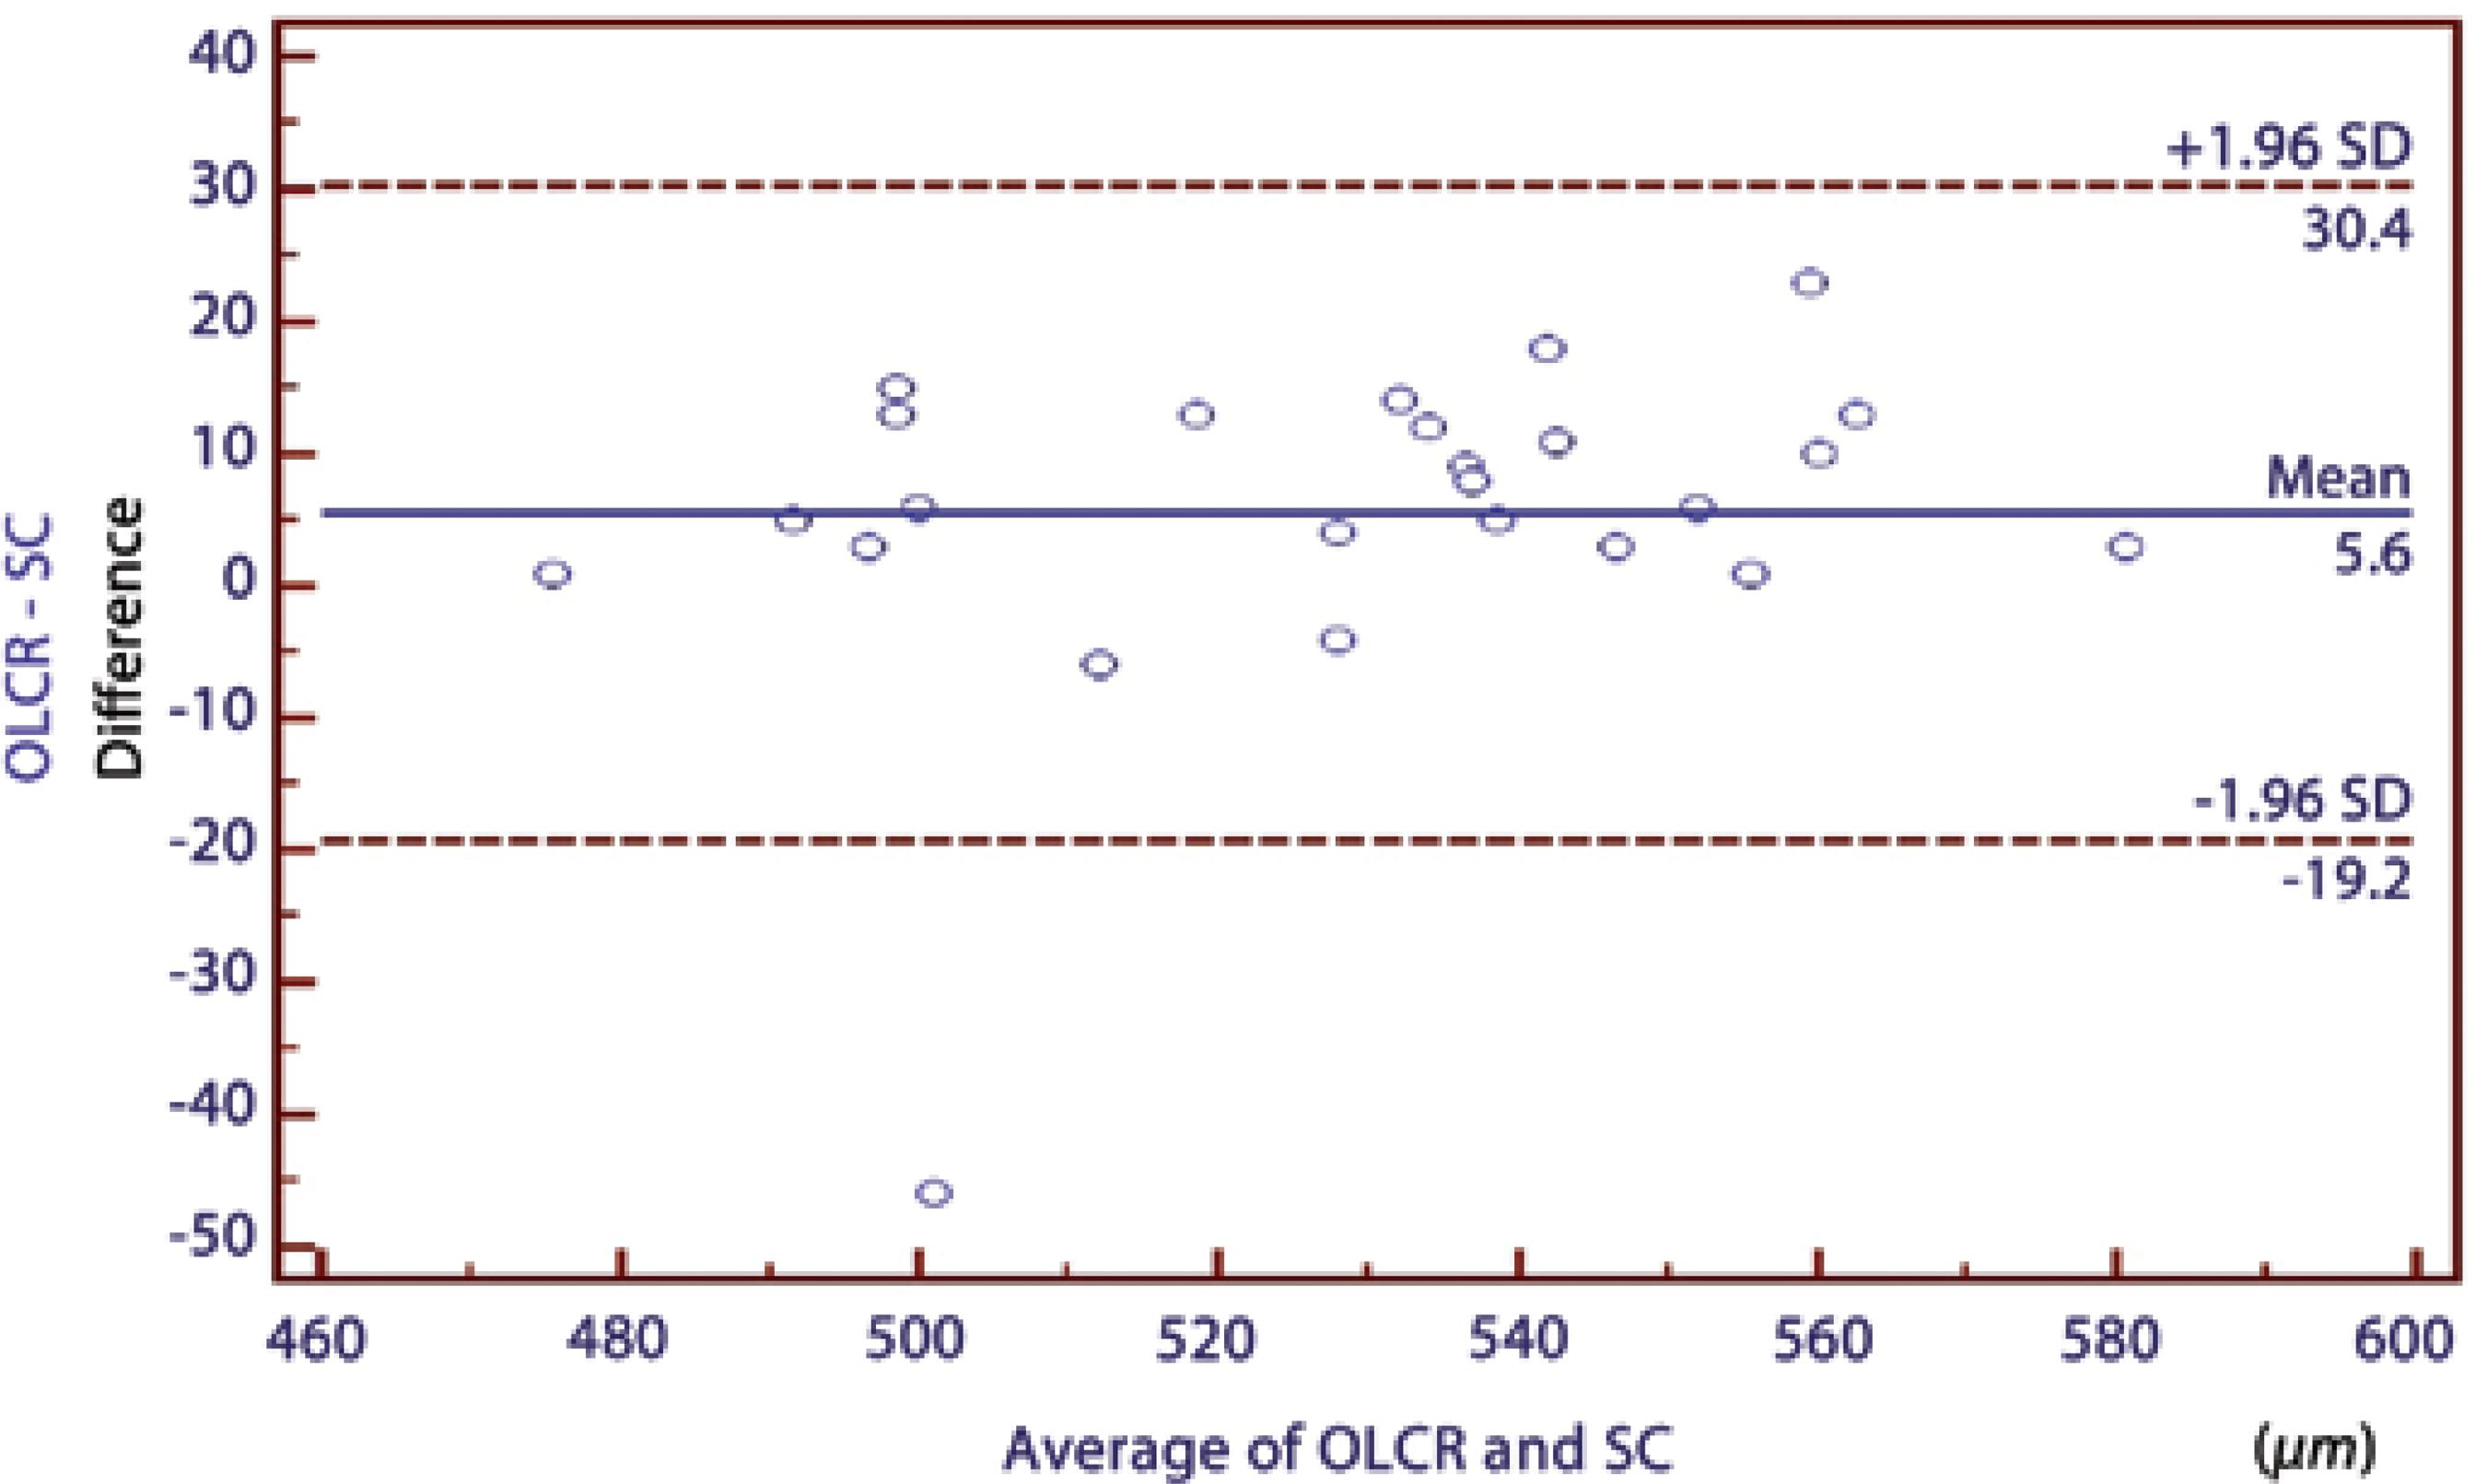
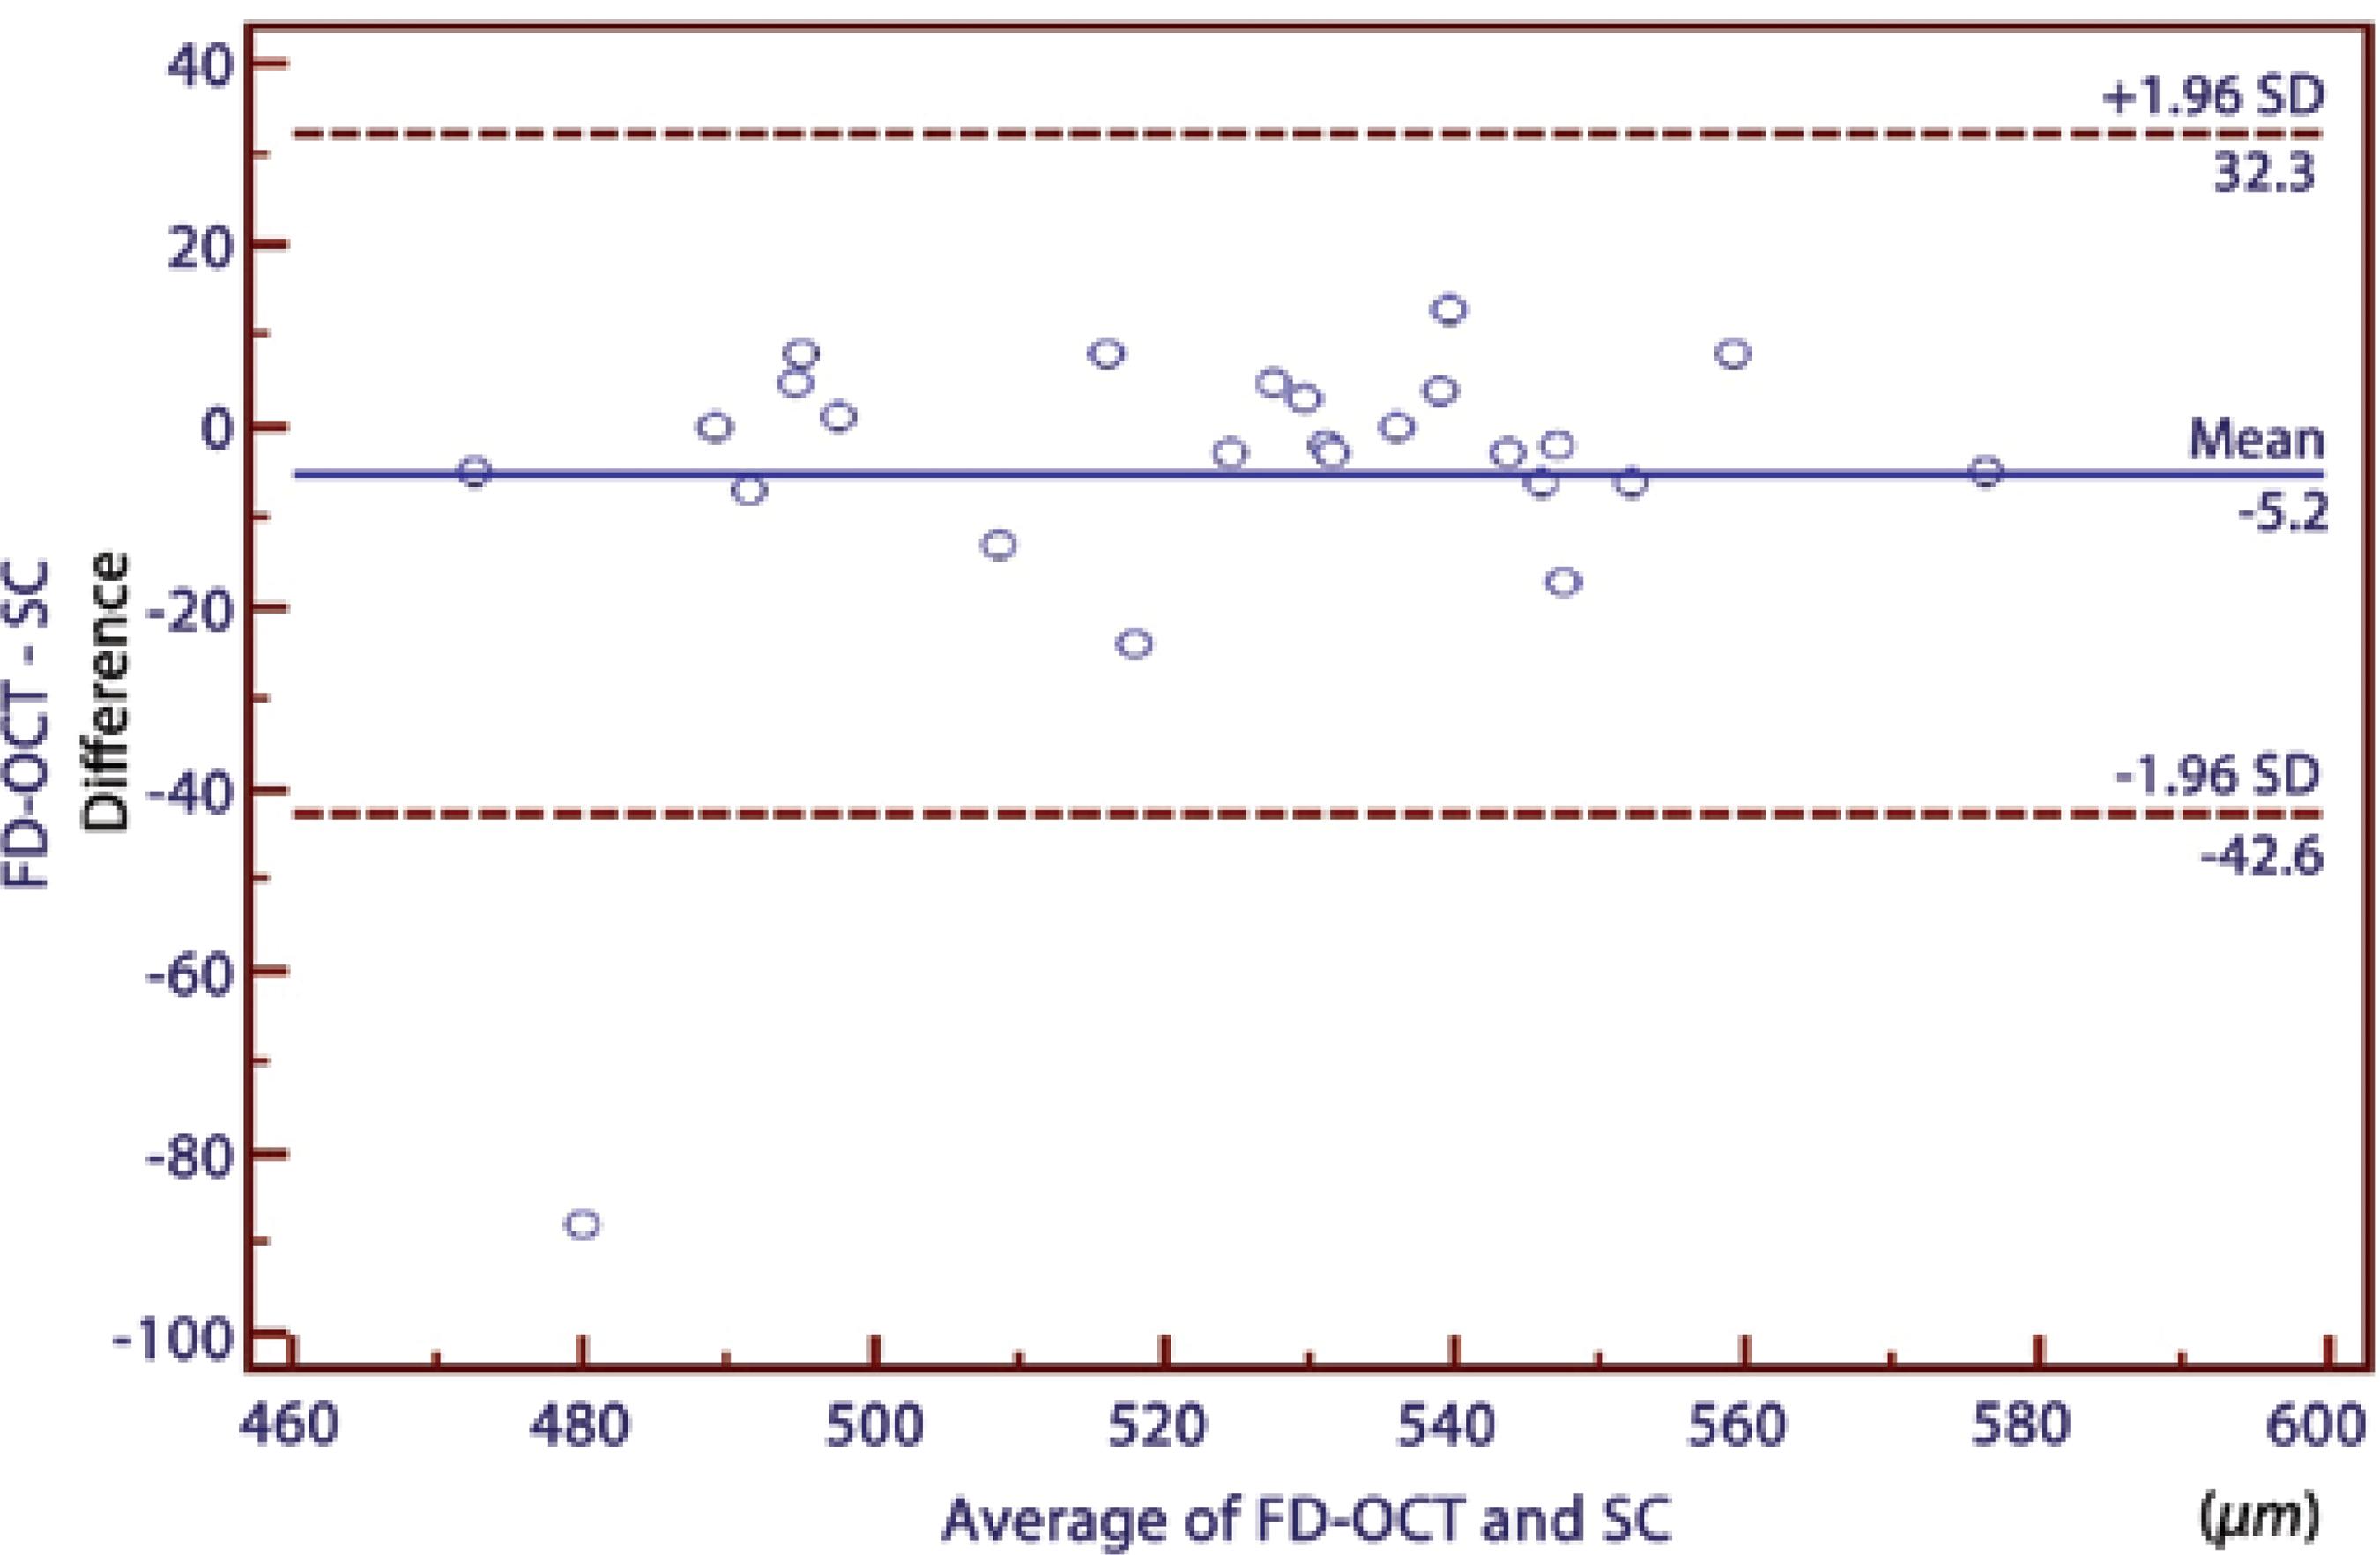
Table 1 summarizes the mean CCT values measured using OLCR, SC, and FD-OCT. Significant correlations were found between all pair-wise comparisons (p<0.0001) (Table 2. In comparing the three instruments using repeated-measures ANOVAs, a statistically significant difference was observed between the results of the CCT measurements (p=0.009). There was a significant difference in the measurements between OLCR and FD-OCT; hovewer, no statistically significant differences were observed between the results of the CCT measurements in the other pair-wise comparisons (OLCR versus SC and FD-OCT versus SC) obtained using ANOVAs with Bonferroni adjustment tests (Table 2). The respective Bland-Altman plots between each pair of the three devices are shown in figures 2 through 4. The plots show that the OLCR measurement was higher than the FD-OCT measurement (mean difference, 10.8 μm) (Figure 2). The OLCR measurement was also higher than the SC measurement, with a mean difference of 5.6 μm (Figure 3), and the FD-OCT measurement was thinner than the SC measurement (mean difference, 5.2 μm) (Figure 4). Considering the 95% LOA obtained from Bland-Altman plots for these comparisons, the OLCR and FD-OCT measurement displayed the smallest range of LOA (35.9 μm). The other LOA ranges were 49.6 μm between OLCR and SC, and 74.9 μm between FD-OCT and SC.
Table 1 Mean ± SD values for central corneal thickness (CCT) measures obtained with the three devices
| OLCR | SC | FD-OCT | p-value | |
|---|---|---|---|---|
| CCT, μm | 531.88 ± 29.10 | 526.28 ± 25.51 | 521.12 ± 30.92 | 0.009 |
OLCR= optical low coherence reflectometry; SC= Scheimpflug camera; FD-OCT= Fourier-domain optical coherence tomography.
Table 2 Pairwise comparison of central corneal thickness measurements using optical low coherence reflectometry (OLCR), Scheimpflug camera (SC) and Fourier-domain optical coherence tomography (FD-OCT)
| Pairwise comparison | Mean difference ± SD, μm | Spearman rank correlation coefficient *, r | 95% limits of agreement, μm | p-value** |
|---|---|---|---|---|
| OLCR/SC | 5.60 ± 12.65 | 0.95 | 30.40 to -19.20 | 0.110 |
| FD-OCT/SC | -5.16 ± 19.09 | 0.91 | 32.30 to -42.60 | 0.568 |
| OLCR/FD-OCT | 10.76 ± 9.16 | 0.97 | 28.70 to -7.20 | <0.001 |
SD= standard deviation;
*= all with P<0.001;
**= pair-wise comparison.

Figure 2 A Bland-Altman plot comparing the central corneal thickness measurements obtained using optical low-coherence reflectometry and Fourier domain optical coherence tomography.

Figure 3 A Bland-Altman plot comparing the central corneal thickness measurements obtained using optical low-coherence reflectometry and the Scheimpflug camera.

Figure 4 A Bland-Altman plot comparing the central corneal thickness measurements between the Fourier domain optical coherence tomography and the Scheimpflug camera.
Intra-examiner repeatability of each method showed that the ICCs were excellent for each method, ranging from 0.98 to 0.99 (Table 3).
Table 3 Intra-examiner repeatability of each method of central corneal thickness measurements
| Methods | ICC | 95% CI |
|---|---|---|
| OLCR | 0.9874 | 0.9715-0.9945 |
| SC | 0.9838 | 0.9632-0.9928 |
| FD-OCT | 0.9901 | 0.9776-0.9956 |
ICC= intraclass correlation coefficient; CI= confidence interval; OLCR= optical low coherence reflectometry; SC= Scheimpflug camera; FD-OCT= Fourier-domain optical coherence tomography.
DISCUSSION
Corneal thickness measurements can be performed using ultra-sound-based or optical-based techniques. Traditional ultrasound pachymetry has been the gold standard method of measuring CCT for many years(17). However, ultrasound pachymetry is a contact method, which requires topical anesthesia and may carry a risk of infection or mechanical trauma unless proper precautions are taken(18). Moreover, the instillation of topical anesthesia may cause the overestimation of CCT measurements in this technique(19). Thus, there are several advantages in using a non-contact procedure for CCT measurements(17,20).
In the current study, FD-OCT had a slightly lower mean CCT measurement (by a mean of 5.16 µm) compared with the SC CCT measurement, although this difference was not statistically significant. In contrast, significantly higher CCT measurements using TD-OCT (Stratus) were described by Ceylan et al.(21) when comparing TD-OCT values to SC (Pentacam). In their study, CCT measurements were obtained manually with the TD-OCT device, unlike in our study. Thus, in their study, the CCT measurements could have been overestimated during manual measurement because of misalignment of the central cornea. On the other hand, Ishibazawav et al.(11) showed that the CCT measurement obtained using FD-OCT (RTVue-100) was significantly thinner than that obtained with SC (Pentacam). They proposed that the higher resolution of FD-OCT compared with SC could have led to better corneal edge detection, resulting in underestimation of the CCT. In our study, another topography system, also based on the SC (Sirius), was used, and its CCT measurements were, on average, 5.16 ± 8.08 µm thicker than the FD-OCT measurements; however, the difference was not statistically significant.
In several studies, the CCT measurements acquired with OCT were substantially lower than those obtained with SC and OLCR(8-11,22-24). A possible explanation for this difference was described by Li et al.(25) They used TD-OCT (Visante) in their study; this device uses software analysis that places boundary lines on the anterior and posterior corneal surface to automatically measure CCT. The anterior boundary line is often placed slightly below the anterior corneal surface. This results in slightly lower CCT values when using the automatic CCT measurements, which we used for our comparative analysis. However, the FD-OCT was used in our study. Because FD-OCT has greater speed, shorter acquisition time, high resolution, and less motion error compared with TD-OCT, detection of the anterior boundary line could be improved. Therefore, the mean difference in CCT measurements between FD-OCT and SC was small and not statistically significant in our study.
In the current study, we found that the results of CCT measurements obtained from these three devices were highly correlated with one another (95.0%, 91.0%, and 97% in pair-wise comparisons; Table 2). However, it has been shown that a high correlation coefficient does not always reflect a high agreement between two compared instruments. Therefore, mean differences between instruments should be first considered, while considering the agreements between instruments to conclude whether these instruments could be used interchangeably for CCT measurements. In our study, these values were not statistically significant except for the difference between FD-OCT and OLCR measurements. In addition, the mean differences in all pair-wise comparisons were comparable with the reported diurnal CCT fluctuation(26). In order to assess the agreement among the instruments, we used the Bland-Altman plots that describe the range in which 95% of all differences are anticipated to fall. Although the OLCR and FD-OCT measurements displayed the smallest range of LOA (35.9 μm), it ranged from 28.70 to -7.20, meaning that these instruments might measure the CCT as far as 28.7 mm higher or 7.2 mm lower than one another. These values were not comparable with the diurnal CCT fluctuation. Thus, we conclude that the measurements are not directly interchangeable for all comparisons in clinical practice because of the wide LOA values.
Table 4 summarizes the previous studies comparing the three methods in CCT measurements. Chen et al.(9) also investigated the agreement between another SC (Pentacam) and the same FD-OCT used in our study. In their study, the range of 95% LOA was 23.2 μm, which is considerably narrower than those found in our study (74.9 μm). They concluded that measurements with both instruments could be used interchangeably despite statistically significant difference between devices because the difference was comparable with the reported diurnal CCT fluctuation(26). Conversely, Milla et al.(10) showed poor agreement between the pachymetric maps provided by TD-OCT system (Visante) and the same SC used in our study. In their study, the range of the 95% LOA was 40.7 μm. They inferred that the range of the 95% LOA was too broad to interchange the measurements with both instruments. As the measurements obtained using the SC were always higher than those obtained using TD-OCT in their study, they emphasized that this difference is important, especially when screening candidates for excimer laser refractive surgery. In addition, several studies that compared the agreement between TD-OCT (Visante) and SC (Pentacam) for CCT measurement showed that these devices should not be used interchangeably in a clinical setting because of poor agreement(6,22,27). Similarly, Ishibazawa et al.(11) showed that the 95% LOA for the CCT measurement between another SC (Pentacam) and the same FD-OCT used in our study was 44 μm, which was not wider than those found in our study (74.9 μm). They concluded that CCT measurements with these devices should not be used interchangeably in a clinical setting. Similarly, in our study, the ranges of 95% LOA between FD-OCT and SC were broad and in accordance with literature, as stated above.
Table 4 Previous studies comparing three methods in central corneal thickness measurements
| Author | Devices | Mean difference ± SD, μm | 95% limits of agreement, μm | p value |
|---|---|---|---|---|
| Chen et al.(9) | SC (Pentacam) - FD-OCT (RTVue) | 10.90 ± 5.93 | 22.5 to -0.7 | <0.001 |
| Milla et al.(10) | SC (Sirius) - FD-OCT (Visante) | 22.4 ± 10.4 | 42.7 to 2.0 | 0.016 |
| Ishibazawa et al.(11) | SC (Pentacam) - FD-OCT (RTVue) | 22.0 ± 9 | 5 to -39.0 | <0.001 |
| Lopez-Miguel et al.(14) | OLCR- FD-OCT (Cirrus) | 5.68 ± 11.46 | 21.28 to -23.99 | 0.001 |
| Cruysberg et al.(23) | OLCR- FD-OCT (Visante) | 11.1 ± 6.5 | 24.1 to -1.9 | <0.001 |
| O'Donnell et al.(6) | OLCR- FD-OCT (Visante) | Not available | 40.78 to -21.74 | 0.005 |
| O'Donnell et al.(6) | OLCR-SC (Pentacam) | Not available | 15.53 to -24.40 | 0.005 |
SD= standard deviation; FD-OCT= Fourier-domain optical coherence tomography; SD OCT= spectral-domain optical coherence tomography; OLCR= optical low coherence reflectometry; SC= Scheimpflug camera.
In our study, considering the 95% LOA obtained from Bland-Altman plots for these comparisons, the OLCR and FD-OCT measurement displayed the smallest range of LOA (35.9 μm). López-Miguel et al.(14 ) observed that the 95% LOA for the CCT measurement between another FD-OCT (Cirrus) and the same OLCR used in our study was 44.93 μm, which was slightly wider than those found in our study. They suggested that CCT measurements obtained with these devices could be used interchangeably, with minimum calibration adjustment. Nevertheless, they mentioned that these small differences between devices might be clinically relevant, especially in patients considering refractive surgery and patients with glaucoma.
Cruysberg et al.(23) reported that the 95% LOA for the CCT measurement between TD-OCT (Visante) and the same OLCR used in our study was 26 μm, which was slightly narrower than those observed in our study. In their study, the difference between the CCT measurements of the OLCR and the TD-OCT was statistically significant, resulting in higher CCT values using OLCR compared with TD-OCT. The OLCR measurement was also higher than the FD-OCT measurement in our study. O’Donnell et al.(6) also reported that the 95% LOA for the CCT measurement between TD-OCT (Visante) and the same OLCR used in our study was 65.52 μm, which was much wider than those observed in our study. They suggested that CCT measures from these instruments should not be used interchangeably because of poor agreement between these instruments. In our study, reasonable agreement was found between the OLCR and the FD-OCT, in contrast with their study.
In the current study, we found that the range of 95% LOA between OLCR and SC was 49.6 μm. On the other hand, Chen et al.(28) reported that the 95% LOA for the CCT measurement between the same devices used in our study was 22.33 μm, which was considerably narrower than those observed in our study. They suggested that CCT measurements from these instruments can be used interchangeably, because of good agreement between these instruments. This discrepancy might be caused by the difference of the mean CCT values between the two studies. In our study, the mean CCT values measured by OLCR and SC were 531.88 µm and 526.28 ± 25.51 µm, respectively. In their study, the mean CCT values were not mentioned. For these reason, further studies on a larger range of CCT thicknesses are warranted.
In conditions with statistically non-significant mean differences between two devices, the agreement between the devices can be determined using the magnitude of the LOA. In addition, whether the range of LOA includes zero mean difference between devices on Bland-Altman plots is also important to draw conclusions regarding the agreement between two devices. All these factors can determine the agreement between two devices and whether both devices can be used interchangeably. On the other hand, whether this agreement is clinically satisfactory depends on the clinical situation. In patients undergoing refractive surgery, for instance, overestimation of CCT could lead to serious complications, whereas underestimation of CCT could lead to the exclusion of eligible patients from refractive surgery procedures(1). Similarly, these faulty measurements may be misleading with regard to the diagnosis and treatment of glaucoma cases(2). In such cases, the range of LOA should not only be narrow, but the zero mean difference between the devices should also be in the middle of that narrow range on Bland-Altman plots in order to use the two devices interchangeably. In the current study, the zero mean difference falls in the middle of the range of LOA for all device pairs. However, the ranges of LOAs for all the device pairs were too broad to use both devices interchangeably.
Interestingly, there were a few participants who were obvious outliers in Bland-Altman plots, causing larger differences in CCT measurements between devices, which induced poor agreement between the devices. We were unable to determine which device caused these different CCT measurements because our study did not include any ultrasound-based CCT measurements, which is the gold standard in CCT measurement. However, this might have been caused by some subjects with CCT values at the upper/lower limit of normal. Therefore, further studies including a larger number of subjects with extreme values of CCT as well as ultrasound-based CCT measurements are warranted.
The results of the present study demonstrated that all devices have high repeatability in healthy subjects and were in accordance with the literature(3,6,9-15). In addition, the FD-OCT exhibited slightly better repeatability compared with the other devices. A possible explanation for this is that FD-OCT measures CCT with greater speed and shorter acquisition time, reducing error due to eye motion. Also, FD-OCT has high resolution, which enables the precise delineation of the boundaries of the cornea. These factors reduce the variability of measurements acquired with FD-OCT.
There are some limitations that must be addressed. In our study, ultrasound pachymetry, the gold standard in CCT measurement, was not included because our main purpose was to evaluate the level of agreement among CCT measurements acquired by three non-invasive techniques. In addition, these measurements were acquired only from healthy subjects. Therefore, further studies are needed to assess the agreement of measurements in patients with conditions such as cataract, keratoconus, ocular hypertension, and other corneal disorders.
In conclusion, the results of CCT measurements obtained using these three devices are correlated with one another, and the mean differences are comparable with the reported diurnal CCT fluctuation; however, the agreement expressed by the 95% LOA values is broad for all the device pairs. This suggests that clinicians should be aware of the differences between these noncontact devices, and that they should not be used interchangeably for CCT measurements in the evaluation of patients with glaucoma or in patients who are candidates for refractive procedures.


 English PDF
 Print
Print
 Send this article by email
 How to cite this article
 Submit a comment
 Mendeley
 Scielo
 Pocket
 Share on Linkedin

