

Luciana Bernardi1; Vital P. Costa2; Lineu Oto Shiroma4
DOI: 10.1590/S0004-27492007000100017
ABSTRACT
PURPOSE: To determine the mean critical fusion frequency and the short-term fluctuation, to analyze the influence of age, gender, and the learning effect in healthy subjects undergoing flicker perimetry. METHODS: Study 1 - 95 healthy subjects underwent flicker perimetry once in one eye. Mean critical fusion frequency values were compared between genders, and the influence of age was evaluated using linear regression analysis. Study 2 - 20 healthy subjects underwent flicker perimetry 5 times in one eye. The first 3 sessions were separated by an interval of 1 to 30 days, whereas the last 3 sessions were performed within the same day. The first 3 sessions were used to investigate the presence of a learning effect, whereas the last 3 tests were used to calculate short-term fluctuation. RESULTS: Study 1 - Linear regression analysis demonstrated that mean global, foveal, central, and critical fusion frequency per quadrant significantly decreased with age (p<0.05).There were no statistically significant differences in mean critical fusion frequency values between males and females (p>0.05), with the exception of the central area and inferonasal quadrant (p=0.049 and p=0.011, respectively), where the values were lower in females. Study 2 - Mean global (p=0.014), central (p=0.008), and peripheral (p=0.03) critical fusion frequency were significantly lower in the first session compared to the second and third sessions. The mean global short-term fluctuation was 5.06±1.13 Hz, the mean interindividual and intraindividual variabilities were 11.2±2.8% and 6.4±1.5%, respectively. CONCLUSION: This study suggests that, in healthy subjects, critical fusion frequency decreases with age, that flicker perimetry is associated with a learning effect, and that a moderately high short-term fluctuation is expected.
Keywords: Perimetry; Visual perception; Sensitivity and specificity; Vision disorders
RESUMO
OBJETIVOS: Determinar os valores médios da freqüência crítica de fusão e a flutuação a curto prazo, analisar a influência da idade, sexo e o efeito aprendizado na perimetria "flicker". MÉTODOS: Estudo 1 - 96 indivíduos normais foram submetidos à perimetria "flicker" uma vez em um olho. Os valores médios de freqüência crítica de fusão foram comparados entre os sexos e a influência da idade foi avaliada utilizando análise de regressão linear. Estudo 2 - 20 indivíduos normais foram submetidos à perimetria "flicker" 5 vezes em um olho. Os 3 primeiros exames foram realizados em dias diferentes, com intervalos de 1 a 30 dias, ao passo que os 3 últimos foram realizados no mesmo dia. RESULTADOS: Estudo 1 - A análise de regressão linear demonstrou que as médias de freqüência crítica de fusão global, foveal, central e por quadrante diminuíram significativamente com a idade (p<0,05). Não houve diferença estatisticamente significante nos valores médios de freqüência crítica de fusão entre os indivíduos do sexo masculino e os do sexo feminino (p>0,05), com exceção da área central e do quadrante nasal inferior (respectivamente, p=0,049 e p=0,011), em que os valores foram menores no sexo feminino. Estudo 2 - Os valores médios de freqüência crítica de fusão global (p=0,014), central (p=0,008) e periférico (p=0,03) foram significativamente inferiores no primeiro exame quando comparados ao segundo e terceiro exames. A média global da flutuação a curto prazo foi igual a 5,06±1,13 Hz, a variabilidade média inter e intra-individual foram, respectivamente, 11,2± 2,8% e 6,4±1,5%. CONCLUSÃO: Este estudo sugere que, em indivíduos normais, freqüência crítica de fusão diminuem com a idade, que perimetria "flicker" está associada a efeito aprendizado e que uma flutuação a curto prazo moderada é esperada.
Descritores: Perimetria; Percepção visual; Sensibilidade e especificidade; Transtornos da visão
ORIGINAL ARTICLE
Flicker perimetry in healthy subjects: influence of age and gender, learning effect and short-term fluctuation
Perimetria "flicker" em indivíduos normais: influência da idade e sexo, efeito aprendizado e flutuação a curto prazo
Luciana BernardiI; Vital P. CostaII; Lineu Oto ShiromaIII
IPós-graduanda em Oftalmologia na Faculdade de Ciências Médicas da Universidade Estadual de Campinas - UNICAMP - Campinas (SP) - Brasil
IIProfessor Livre Docente pela Faculdade de Ciências Médicas da Universidade de São Paulo - USP - São Paulo (SP) - Brasil. Chefe do Setor de Glaucoma do Departamento de Oftalmologia da UNICAMP - Campinas (SP) - Brasil
IIIEstagiário do Setor de Glaucoma do Departamento de Oftalmologia da Faculdade de Ciências Médicas da UNICAMP - Campinas (SP) - Brasil
ABSTRACT
PURPOSE: To determine the mean critical fusion frequency and the short-term fluctuation, to analyze the influence of age, gender, and the learning effect in healthy subjects undergoing flicker perimetry.
METHODS: Study 1 - 95 healthy subjects underwent flicker perimetry once in one eye. Mean critical fusion frequency values were compared between genders, and the influence of age was evaluated using linear regression analysis. Study 2 - 20 healthy subjects underwent flicker perimetry 5 times in one eye. The first 3 sessions were separated by an interval of 1 to 30 days, whereas the last 3 sessions were performed within the same day. The first 3 sessions were used to investigate the presence of a learning effect, whereas the last 3 tests were used to calculate short-term fluctuation.
RESULTS: Study 1 - Linear regression analysis demonstrated that mean global, foveal, central, and critical fusion frequency per quadrant significantly decreased with age (p<0.05).There were no statistically significant differences in mean critical fusion frequency values between males and females (p>0.05), with the exception of the central area and inferonasal quadrant (p=0.049 and p=0.011, respectively), where the values were lower in females. Study 2 - Mean global (p=0.014), central (p=0.008), and peripheral (p=0.03) critical fusion frequency were significantly lower in the first session compared to the second and third sessions. The mean global short-term fluctuation was 5.06±1.13 Hz, the mean interindividual and intraindividual variabilities were 11.2±2.8% and 6.4±1.5%, respectively.
CONCLUSION: This study suggests that, in healthy subjects, critical fusion frequency decreases with age, that flicker perimetry is associated with a learning effect, and that a moderately high short-term fluctuation is expected.
Keywords: Perimetry/methods; Visual perception; Sensitivity and specificity; Vision disorders/diagnosis
RESUMO
OBJETIVOS: Determinar os valores médios da freqüência crítica de fusão e a flutuação a curto prazo, analisar a influência da idade, sexo e o efeito aprendizado na perimetria "flicker".
MÉTODOS: Estudo 1 - 96 indivíduos normais foram submetidos à perimetria "flicker" uma vez em um olho. Os valores médios de freqüência crítica de fusão foram comparados entre os sexos e a influência da idade foi avaliada utilizando análise de regressão linear. Estudo 2 - 20 indivíduos normais foram submetidos à perimetria "flicker" 5 vezes em um olho. Os 3 primeiros exames foram realizados em dias diferentes, com intervalos de 1 a 30 dias, ao passo que os 3 últimos foram realizados no mesmo dia.
RESULTADOS: Estudo 1 - A análise de regressão linear demonstrou que as médias de freqüência crítica de fusão global, foveal, central e por quadrante diminuíram significativamente com a idade (p<0,05). Não houve diferença estatisticamente significante nos valores médios de freqüência crítica de fusão entre os indivíduos do sexo masculino e os do sexo feminino (p>0,05), com exceção da área central e do quadrante nasal inferior (respectivamente, p=0,049 e p=0,011), em que os valores foram menores no sexo feminino. Estudo 2 - Os valores médios de freqüência crítica de fusão global (p=0,014), central (p=0,008) e periférico (p=0,03) foram significativamente inferiores no primeiro exame quando comparados ao segundo e terceiro exames. A média global da flutuação a curto prazo foi igual a 5,06±1,13 Hz, a variabilidade média inter e intra-individual foram, respectivamente, 11,2± 2,8% e 6,4±1,5%.
CONCLUSÃO: Este estudo sugere que, em indivíduos normais, freqüência crítica de fusão diminuem com a idade, que perimetria "flicker" está associada a efeito aprendizado e que uma flutuação a curto prazo moderada é esperada.
Descritores: Perimetria/métodos; Percepção visual; Sensibilidade e especificidade; Transtornos da visão/diagnóstico
INTRODUCTION
Several psychophysical tests have been developed to detect early glaucomatous damage, including short wavelength perimetry (SWAP), frequency-doubling technology (FDT), high-pass perimetry, motion automated perimetry and flicker perimetry(1-12).
Most studies suggest that flickering stimuli are perceived by the magnocellular ganglion cells(13-17), which are characterized by fast conduction velocity, sensitivity to transitory changes in retinal stimulation, low spatial resolution, high temporal resolution, and ability to detect movement(18-19). The magnocelullar ganglion cells represent only 8-10% of the total population of retinal ganglion cells(18) and their loss may be detected earlier due to a reduction in the redundancy phenomenon(9,13). However, according to Faubert and Bellavance, the use of higher temporal flicker rate (16 Hz) and large targets stimulates the magnocellular pathway, whereas slower flicker rates (2 Hz) would favor the parvocellular pathways(20).
Two methods have been employed to evaluate the visual field with flickering stimuli. The first is to determine the critical fusion frequency (CFF), defined as the frequency at which an intermittent (flickering) light stimulus of constant illumination threshold is first perceived as a continuous light(21-22). On the other hand, in temporal modulation perimetry (TMP), the flicker rate is fixed at a predetermined temporal frequency and the threshold is defined as the minimum contrast necessary to detect the flicker stimulus(12). An advantage of flicker perimetry is that it is not influenced by media opacities or blurred vision(23-24).
In 1992, Matsumoto et al., designed a software that allowed the determination of the CFF using the Octopus equipment(25). Although some studies have suggested that flicker perimetry may be used to detect early glaucomatous damage(25-26), there are not enough data in the literature determining the mean CFF values in healthy subjects, and there are few studies investigating the influence of age and gender on flicker perimetry.
Hence, we designed a study to determine the mean CFF and the short-term fluctuation, to analyze the influence of age and gender, and to investigate the occurrence of a learning effect in healthy subjects undergoing flicker perimetry. We intend to use these findings to create a normative database for flicker perimetry.
METHODS
This study was approved by the Ethics Committee of the University of Campinas, Brazil. All subjects signed an informed consent before inclusion in the study.
Study 1
Ninety-five healthy volunteers, recruited at the University of Campinas among the staff and their relatives, underwent standard achromatic perimetry (SAP) and flicker perimetry with the Octopus 301 (Haag-Streit - Switzerland) once in one eye. When both eyes were eligible, we included the right eye, exception when the left eye had better visual acuity. The inclusion criteria for healthy subjects were: visual acuity ³0.8, refractive error ranging between +5 and -5 spherical diopters and 3 cylinder diopters, IOP <21 mmHg, absence of optic disc abnormalities (such as cup/disc ratio >0.5, localized defect in the neuroretinal rim, nasal cupping, disc hemorrhage, or cup/disc asymmetry >0.2), and normal results in standard achromatic perimetry (SAP) (less than 3 adjacent points within p<5% at the corrected probability plot). Subjects with lens or corneal opacities, any abnormality in the retina (such as ARMD, diabetic retinopathy, vein occlusion, etc), glaucoma in the other eye, previous ocular surgery, family history of glaucoma, migraine or neurological disease were excluded.
The ocular examination consisted of slit-lamp biomicroscopy, refraction, IOP measurement with Goldmann applanation tonometry, and fundoscopic examination using a 78-diopter lens. Visual field examination was performed with the Octopus 301 using the G1 program and dynamic strategy (59 test points located at the central 30°, nonlinear stimulus step size, adapted to the slope of the frequency-of-seeing curve, without reversals) for both flicker and standard automated perimetries. The parameters for SAP were: background intensity of 31.4 asb, stimulus size Goldmann III, maximum intensity 4000 asb, stimulus duration of 100 ms, stimulus luminance step size increase from 2 dB (near the normal values) to 10 dB (toward the most depressed levels), the final measured value was calculated as the mean between the two last stimuli(27). The parameters for flicker perimetry were: background intensity of 31.4 asb, stimulus size Godmann III, stimulus intensity of 2000 asb, stimulus duration of 1000 ms, step size equal to 2 Hz near the normal values of CFF and 4-9 Hz in the range of reduced CFF, 100% contrast (on state 0 dB or 4000 asb, off state 0 asb) and variable flicker frequency up to 60 Hz (maximum flicker frequency for regular stimuli). An electronic eye fixation control system interrupts the examination when the patient is not fixating or closes the eye. When the patient blinks during a stimulus presentation, the equipment repeats it later during the test(27). The false positive response was tested with a 100 Hz flicker stimulus and the false negative response with a 5 Hz flicker stimulus. Patients with an unreliable examination (false positive or false negative responses higher than 33%) were excluded from this study.
During SAP, the subject was instructed to press the answer button when the stimulus was seen, whereas during flicker perimetry the stimulus was always seen, and the subject was instructed to press the answer button only if the stimulus was perceived to be flickering. For flicker perimetry, the threshold value was expressed in Hertz (Hz) rather than in decibel (dB)(27).
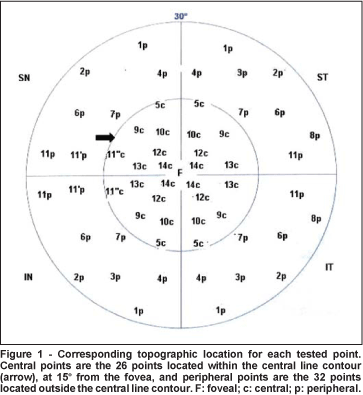
The following parameters were calculated: foveal CFF, global CFF (including all 59 tested points), CFF per quadrant, central CFF (mean values of the 26 points located within the central line contour at 15º from the fovea, with the exception of the foveal CFF, as defined in figure 1), and peripheral CFF (mean values of the 32 points located outside the central line contour, as defined in figure 1). Mean values for each parameter were compared between the two genders. The influence of age was evaluated using linear regression analysis for each parameter.
Study 2
Twenty healthy volunteers who fulfilled all above mentioned inclusion and exclusion criteria underwent flicker perimetry 5 times with the Octopus 301 (G1 program - dynamic strategy) in one eye. When both eyes were eligible, we included the right eye, exception when the left eye had better visual acuity. The first 3 sessions were separated by an interval of 1 to 30 days, whereas the last 3 sessions were performed within the same day, with 15-minute intervals.
The test duration, mean global CFF, mean foveal CFF, mean CFF per quadrant, mean central CFF, mean peripheral CFF, and rates of false positive and false negative responses obtained during the first 3 sessions were compared. For this study, patients with an unreliable examination (with false positive or false negative responses higher than 33%) were not excluded from the analysis. The analysis of the first 3 exams were used to investigate the presence of a learning effect. The mean of the differences between the highest and the lowest sensitivity for each tested location during the last 3 sessions (performed within the same day) were used to calculate the short-term fluctuation.
For the analysis of the interindividual variability, the coefficient of variation for each tested location was calculated using the mean CFF and standard deviation obtained for all 20 subjects during the third session. The intraindividual variability was calculated using the average of the mean CFF and the standard deviation obtained at the third, fourth, and fifth sessions for each subject (coefficient of variation = standard deviation divided by mean)(28). We also compared the coefficient of variation in the central and peripheral areas (as defined above).
Statistical analysis
The statistical analysis was performed with the SPSS program (Version 12.0 - SPSS Inc., 2003). The Kolmogorov-Smirnov test was used to evaluate whether the samples were normally distributed. Student's t test was employed to compare continuous variables, analysis of variance (ANOVA) for repeated measurements was used to compare CFF values per quadrant, to compare the mean CFF values among the first 3 examinations and to compare the mean CFF values among the last 3 exams. P values of less than 0.05 were considered statistically significant.
RESULTS
Study 1
Among the 95 healthy volunteers who underwent flicker perimetry, 19 (20%) were excluded due to an unreliable examination, all of them due to a high rate of false positive responses (higher than 33%). Seventy-six subjects were analyzed. There were 48 (63.2%) women and 28 (36.8%) men, 63 (82.9%) white, 10 (13.2%) black and 3 (3.9%) Asian subjects. The mean age was 42.1±10.8 years (ranging from 25 to 63 years).
The mean test duration was 10:34±1:53 min (ranging from 7:22 to 16:23 min), the mean percentages of false positive and false negative responses were 9.6±9.3% and 0.7±2.9%, respectively.
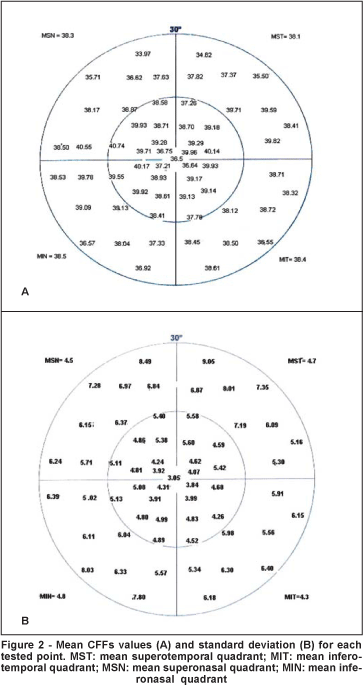
Figure 2 illustrates the mean CFF value and standard deviation for each tested point in the study population. Mean global, foveal, peripheral, and central CFFs were 38.3±4.3 Hz, 36.5±3.5 Hz, 38.0±5.0 Hz, and 38.8±3.7 Hz, respectively. The mean sensitivities per quadrant were 38.1±4.7 Hz, 38.4±4.3 Hz, 38.3±4.5 Hz and 38.5±4.8 Hz for the superotemporal, inferotemporal, superonasal and inferonasal quadrants, respectively. There was no statistically significant difference between the mean CFFs per quadrant (p=0.762). The mean central CFF was significantly higher than the mean peripheral CFF (p=0.005).
Males showed mean CFF values significantly higher than females in the inferonasal quadrant and in the central area (p=0.011 and p=0.049, respectively). There were no statistically significant differences in all other mean CFF values between males and females (p>0.05) (Table 1).
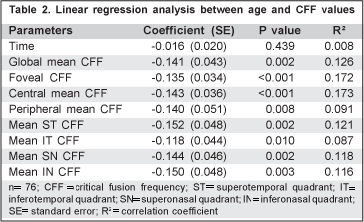
Linear regression analysis demonstrated that mean global CFF, foveal CFF, central CFF and mean CFFs per quadrant significantly decreased with age, however with a low correlation coefficient (R2 ranging between 0.087 and 0.173) (Table 2).
Study 2
Among the 20 subjects included in study 2, 13 also were included in study 1. In study 2 there were 8 (40%) women and 12 (60%) men, 17 (85%) white, 2 (10%) black, and 1 (5%) Asian subject. The mean age was 28.7±5.7 years (ranging from 19 to 41 years).
There were no statistically significant differences among the first three sessions regarding test duration (p=0.101), rate of false positive responses (p=0.674), rate of false negative responses (p=0.368), and rate of unreliable tests (p=0.093) (Table 3).
The mean global CFF obtained in the first test (41.5±3.1 Hz) was significantly lower than those measured in the second and third tests, (42.9±3.0 Hz and 42.7±2.9 Hz, respectively) (p=0.014). The mean central (p=0.008), and the mean peripheral (p=0.03) CFFs were significantly lower in the first test compared to the second and third tests. The mean foveal CFF was also lower in the first test, although the difference was not statistically significant (p=0.06). The mean CFFs per quadrant (with the exception of the superotemporal quadrant) obtained in the first session were significantly lower than those obtained in the second session (p<0.05). No significant differences were found between the mean CFF values of the second and third sessions (Table 4).
There were no statistically significant differences between the last 3 sessions regarding the duration of the test (p=0.212), rate of false positive responses (p=0.476), rate of false negative responses (p=0.607), and rate of unreliable tests (p=0.651) (Table 5).
Table 6 shows the mean CFFs for the last 3 sessions. There were no significant differences between the mean CFF values of the last 3 sessions (p>0.05).
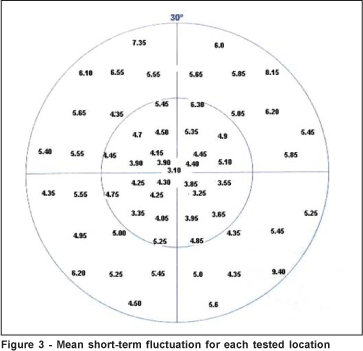
The mean global short-term fluctuation was 5.06±1.13 Hz (range: 3.10 to 9.4 Hz). The mean foveal short-term fluctuation was 3.10±2.27 Hz. The mean short-term fluctuation for the central area (4.4±0,67 Hz, ranging from 3.25 to 6.3 Hz) was significantly lower than that obtained in the peripheral area (5.65±1.31 Hz, ranging from 4.35 to 9.40 Hz) (p<0.001) (Figure 3).
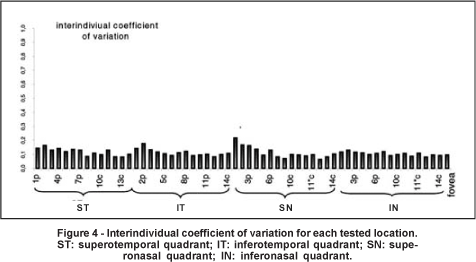
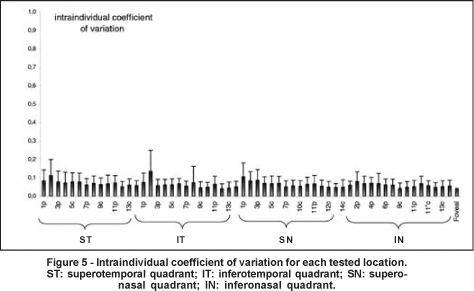
The mean interindividual variability was 11.2±2.8% (ranging from 6.4 to 21.7%) (Figure 4). The mean intraindividual variability was 6.4±1.5% (ranging from 4.1 to 13.4% (Figure 5). The intraindividual variability was significantly lower in the central (mean= 5.5±1.0%) than in the peripheral area (mean= 7.3±2.1%) (p=0.001). The coefficients of intraindividual variation were 7.2±2.2%, 6.3±2.1%, 6.5±2.0%, and 5.9±1.3% for the superotemporal, inferotemporal, superonasal, and inferonasal quadrant, respectively. The coefficient of variation in the superotemporal quadrant was higher than the coefficient obtained in the inferonasal quadrant (p=0.031).
DISCUSSION
Some studies have suggested that flicker perimetry is able to detect visual field loss in subjects with early glaucomatous damage. However, these studies vary with regard to stimulus frequency (in Hz), contrast sensitivity (in dB), and number of tested points(11,29-30).
However, before analyzing the effectiveness of flicker perimetry in detecting early glaucomatous visual field loss, it is important to determine the response to flicker stimuli in healthy subjects. In a previous study, the results of flicker perimetry in 34 eyes of patients with ocular hypertension and 34 eyes of healthy subjects were compared. The authors observed that mean CFFs were 39.97±2.19 Hz and 30.60±4.41 Hz for the healthy and ocular hypertensive subjects, respectively (p <0.01)(31). Another study reported that the mean foveal CFF value for 100 normal subjects was 38±4 Hz(25). These findings are in agreement with our study, which involved 76 healthy subjects and determined a mean global CFF of 38.3±4.3 Hz.
When temporal modulation thresholds of the central and peripheral field were measured in 46 eyes with glaucoma and ocular hypertension, 86% of ocular hypertensive subjects showed a significant reduction of the temporal modulation threshold in the peripheral field(11). The same study reported that the normal peripheral field had a lower sensitivity than the central field to detect flicker at 30 Hz(11). A study published in 1991 analyzed 10 healthy subjects undergoing TMP and observed that the sensitivity decreased as well as the eccentricity increased for a 40-degree visual field. This decline in sensitivity was greater for small target sizes (0.125º, 0.25º, 0.5º) and higher temporal rates. The author also observed that an increase in luminance (from 3.4 cd/m2 to 10 cd/m2) improved the sensitivity throughout the visual field at higher temporal rates (15 Hz)(32). Although we measured CFF values instead of temporal modulation thresholds, this study confirms that the sensitivity to flickering stimulus is lower at the periphery. CFF values may vary depending on the background luminance (adaptation), although it is not clear why this phenomenon occurs. In bright background luminance, peripheral CFF values are higher than central, whereas in dark background luminance, central CFF value may be higher than peripheral. *Matsumoto C.
Interestingly, we observed that mean foveal CFF was lower than the mean central and peripheral areas. This is in agreement with a previous study, which also measured a lower mean foveal CFF when compared with CFF values in the nasal or temporal sites (46.9 Hz, 56.0 Hz, and 54.2 Hz, respectively) in healthy subjects(22).
The influence of age on the visual fields of normal subjects undergoing SAP has already been investigated by several authors, who identified a significant decrease in sensitivity with age(33-34). The sensitivity in blue-on-yellow perimetry also decreased with age in healthy subjects (0.09 log unit/decade)(3). When the effect of aging on TMP sensitivity at 2 Hz and 16 Hz was evaluated in 30 healthy subjects divided into 3 age groups (40-49, 50-59, 60-70 years), a reduction in the log contrast sensitivity with age was detected(20). The difference by decade appeared constant for the lower temporal frequency condition, whereas at the higher temporal frequency condition (16 Hz) the decrement appeared first in the central visual field and then extended out in the periphery. In another study that measured flicker sensitivity in 1000 subjects aged 5-75 years, it was observed that CFF values increased at a rate of almost 4 Hz/decade up to the age of 16 years. After this age, the CFF values decreased gradually(35). A study designed to establish the relationship between differential luminous threshold and CFF in 28 healthy subjects, showed a reduction of CFF values with age (0.075 Hz/year) that was similar to the loss of differential luminous threshold (0.059 dB/year) measured with SAP(36). Furthermore, in a previous study, where flicker perimetry was performed in 100 eyes of 100 normal subjects (age ranging from 19 to 79 years), the authors reported that mean CFF values decreased with age (-1 Hz/decade)(25). Our study confirmed that mean CFF values decrease with age. However, low correlation coefficients were obtained, which indicates that the corrected rate to preview the CFF value would be very low using only age as a parameter.
A limitation of our first study was the number of excluded patients due to unreliable tests (20%). Most of the unreliable examinations were due to a high number of false positive responses. The high false positive response rate is probably secondary to the difficulty in determining the CFF. As explained above, patients are instructed to press the answer button when the stimulus is noticed to be flickering. The stimulus, however, is always seen, and some patients may react immediately to the presentation of a stimulus, even if it is not flickering. We recognize this as an important limitation of this strategy, that needs to be overcome if we plan to use it routinely in our clinics. In fact, our second study confirmed that a high rate of unreliable tests (up to 40%) can be expected when flicker perimetry is performed.
The learning effect in SAP, FDT, and SWAP has already been described by several authors(10,37-39). It has been reported that temporal modulation thresholds at fixed frequencies show test-retest variability of 15%, and that measurements are consistently better in the second session as compared to the first(40). In the present study, there were significant improvements in mean CFF values in the second and third sessions when compared to the first. Interestingly, no significant change was observed when mean CFF values from the last 3 sessions were compared, indicating that a learning effect is not expected after 3 sessions.
One can also measure the learning effect by observing the subject's ability to perform reliable examinations. In our study, there were no significant differences in the rates of false positive or false negative responses and unreliable tests neither among the 3 first sessions, nor among the 3 last tests.
Short-term fluctuations have also been observed in SAP, FDT, and SWAP(41-44). In a previous study that included 20 healthy subjects who underwent FDT, the short-term fluctuation (calculated as the standard deviation of the mean of the values of 3 consecutive examinations) was 2.16±0.5 dB, which represented 8.5% of the mean total sensitivity (30.4±1.24 dB)(42). In a different study that included 20 healthy subjects undergoing FDT 6 times, the mean SF was 1.72±0.38 dB, which represented 5.3% of the total mean sensitivity (31.91±1.2 dB)(44). SF has been shown to be greater for SWAP (1.37±0.14 dB) than for SAP (1.24±0.18 dB) (p<0.003), values which represented 7.3% and 4.2% of the total mean sensitivity (18.7±1.3 dB and 29.0±1.2 dB), respectively(43). In our study, the mean global short-term fluctuation was 5.06±1.13 Hz (ranging from 3.10 to 9.4 Hz), which represented 11.8% of the mean global sensitivity obtained in the last test (42.6±2.8 Hz)(43). We also observed that the mean short-term CFF fluctuation for the central area (4.4±0.67 Hz) was significantly lower than that obtained in the peripheral area (5.65±1.31 Hz) (p<0,001). It is possible that the above mentioned difficulty in determining the CFF not only results in high false positive response rates, but also leads to an increased SF.
In order to develop a normative database, it is important to know the inter and intraindividual variabilities of a given test. In our study, the mean interindividual and intraindividual variabilities were 11.2±2.8% (ranging from 6.4 to 21.7%) and 6.4±1.5% (ranging from 4.1 to 13.4%), respectively, rates that compare favorably with other perimetric methods(28,43). Klistorner et al., determined the inter and intraindividual variability for 30 healthy subjects undergoing objective perimetry, and found a mean coefficient of variation equal to 34.8%±6.9% (ranging from 23.0% to 52.7%) and 15.2%±4.5% (ranging from 6.8% to 25.9%), respectively(28). A study that defined interindividual variability as the statistical variance (in dB2) of the average threshold sensitivity across all subjects, found a value equal to 2.6±2.5 dB2 for SWAP and 2.5±1.84 dB2 for SAP (which corresponded to 13.9% and 8.6% of the mean sensitivity, respectively)(43). We observed a higher intraindividual variability in the peripheral area compared to the central area. Other studies have described higher intra and interindividual variabilities in the peripheral field with both objective perimetry and SWAP(28,43). It has been demonstrated that the test-retest variability increases with visual field eccentricity in both normal and glaucoma subjects undergoing SAP(45). It has also been found that inter and intraindividual variabilities increase with eccentricity in normal subjects undergoing SAP(46). Hence, the greater CFF variability in the peripheral area needs to be considered when developing a normative database or evaluating progression.
CONCLUSION
This study suggests that CFFs decrease with age, that sensitivity to flicker stimulus is lower at the periphery, and that CFFs are not significantly influenced by gender, with the exception of the central area and inferonasal quadrant. This study also suggests that flicker perimetry is associated with a learning effect, and that a moderately high short-term fluctuation is expected in subjects undergoing such test. Further studies are under way to determine the correspondence between SAP, FDT, and flicker perimetry, as well as to evaluate the sensitivity and specificity of this test in the diagnosis of glaucoma.
REFERENCES
1. Anderson AJ, Vingrys AJ. Effect of stimulus duration in flicker perimetry. Clin Experiment Ophthalmol. 2000;28(3):223-6.
2. Bosworth CF, Sample PA, Weinreb RN. Perimetric motion thresholds are elevated in glaucoma suspects and glaucoma patients. Vision Res. 1997; 37(14):1989-97.
3. Johnson CA, Adams AJ, Twelker JD, Quigg JM. Age-related changes in the central visual field for short-wavelength-sensitive pathways. J Opt Soc Am A. 1988;5(12):2131-9.
4. Johnson CA, Adams AJ, Casson EJ, Brandt JD. Progression of early glaucomatous visual field loss as detected by blue-on-yellow and standard white-on-white automated perimetry. Arch Ophthalmol. 1993;111(5):651-6.
5. Johnson CA, Adams AJ, Casson EJ, Brandt JD. Blue-on-yellow perimetry can predict the development of glaucomatous visual field loss. Arch Ophthalmol. 1993;111(5):645-50.
6. Lachenmayr B, Rothbächer H, Gleissner M. Automated flicker perimetry versus quantitative static perimetry in early glaucoma. In: Heijl A, editor. Perimetry Update 1988/89. Amsterdan: Kugler & Ghedini; 1989. p.359-8.
Lachenmayr B, Gleissner M, Rothbacher H. [Automated flicker perimetry] Fortschr Ophthalmol. 1989;86(6):695-701. German.
7. Landers JA, Goldberg I, Graham SL. Detection of early visual field loss in glaucoma using frequency-doubling perimetry and short-wavelength automated perimetry. Arch Ophthalmol. 2003;121(12):1705-10.
8. Medeiros FA, Sample PA, Weinreb RN. Frequency doubling technology perimetry abnormalities as predictors of glaucomatous visual field loss. Am J Ophthalmol. 2004;137(5):863-71. Comment in: Am J Ophthalmol. 2004;138 (5):897-8; author reply 898-9.
9. Sample PA, Ahn DS, Lee PC, Weinreb RN. High-pass resolution perimetry in eyes with ocular hypertension and primary open-angle glaucoma. Am J Ophthalmol. 1992;113(3):309-16.
10. Soliman MA, de Jong LA, Ismaeil AA, van den Berg TJ, de Smet MD. Standard achromatic perimetry, short wavelength automated perimetry, and frequency doubling technology for detection of glaucoma damage. Ophthalmology. 2002;109(3):444-54.
11. Tyler CW. Specific deficits of flicker sensitivity in glaucoma and ocular hypertension. Invest Ophthalmol Vis Sci. 1981;20(2):204-12.
12. Yoshiyama KK, Johnson CA. Which method of flicker perimetry is most effective for detection of glaucomatous visual field loss? Invest Ophthalmol Vis Sci. 1997;38(11):2270-7.
13. Johnson CA. Selective versus nonselective losses in glaucoma. J Glaucoma. 1994; 3(Suppl 1):S32-44.
14. Johnson CA. Psychophysical measurement of glaucomatous damage. Surv Ophthalmol. 2001;45 Suppl 3:S313-8; discussion S322-4.
15. Livingstone MS, Hubel DH. Psychophysical evidence for separate channels for the perception of form, color, movement, and depth. J Neurosci. 1987;7 (11):3416-68.
16. Merigan WH, Byrne CE, Maunsell JH. Does primate motion perception depend on the magnocellular pathway? J Neurosci. 1991;11(11):3422-9.
17. Sample PA. What does functional testing tell us about optic nerve damage? Surv Ophthalmol. 2001;45 Suppl 3:S319-24; discussion S332-4.
18. Morgan JE, Uchida H, Caprioli J. Retinal ganglion cell death in experimental glaucoma. Br J Ophthalmol. 2000;84(3):303-10.
19. Vogt U, Morland A, Migdal C, Ruddock K. Spatial and temporal visual filtering in patients with glaucoma and ocular hypertension. Eye. 1998;12(Pt 4):691-6.
20. Faubert J, Bellavance F. Temporal modulation visual fields, normal aging, Parkinson's disease and methyl-mercury in the James Bay Cree: a feasibility study. Arq Bras Oftalmol. 2003;66(Suppl 5):77-91.
21. Rota-Baterlink A. The diagnostic value of automated threshold perimetry. Cur Opin Ophthalmol. 1999;10(2):135-9.
22. Tytla ME, Trope GE, Buncic R. Flicker sensitivity in treated ocular hypertension. Ophthalmology. 1990;97(1):36-43.
23. Lachenmayr BJ, Gleissner M. Flicker perimetry resists retinal image degradation. Invest Ophthalmol Vis Sci. 1992;33(13):3539-2.
24. Matusumoto C, Okuyama S, Iwagaki A, Otsuki T, Uyama K, Otori T. The influence of target blur on perimetric threshold values in automated light-sensitive perimetry and flicker perimetry. In: Wall M, Heijl A, editors. Perimetry Update 1996/97. Amsterdan: Kugler; 1997. p.191-200.
25. Matsumoto C, Uyama K, Okuyama R, Otori T. Automated flicker perimetry using the Octopus 1-2-3. In: Mills RP, editor. Perimetry Update 1992/1993. Amsterdam: New York: Kugler; 1993. p.435-40.
26. Matsumoto C, Okuyama S, Uyama K, Iwagaki A, Otori T. Automated flicker perimetry in glaucoma. In: Mills RP, Wall M, editors. Perimetry Update 1994/1995. Amsterdam: Kugler; 1995. p.141-6.
27. Fankhauser F, Bebie H, Flammer J, Weijland A. Automated perimetry visual field digest. 4th ed. Switzerland: Haag-Streit; 2004. p.44-91.
28. Klistorner A, Graham SL. Objective perimetry in glaucoma. Ophthalmology. 2000;107(12):2283-99.
29. Casson EJ, Johnson CA. Temporal modulation perimetry in glaucoma and ocular hypertension. In: Mills RP, editor. Perimetry Update 1992/1993. Amsterdam: Kugler;1992. p.443-50.
30. Horn FK, Velten IM, Junemann A, Korth M. The full-field flicker test in glaucomas: influence of intraocular pressure and pattern of visual field losses. Graefes Arch Clin Exp Ophthalmol. 1999;237(8):621-8.
31. Gallardo-Sanches, LM, Aranguez-Cortés C. Findings using flicker perimetry and TOP strategy in patients with ocular hipertension and normal subjects. In: 76° Encontro da Sociedad Española de Oftalmologia, 2000. Madrid, Oct. 2000.
32. Faubert J. Effect of target size, temporal frequency and luminance on temporal modulation visual fields. In: Mill RP, Heijl A, editors. Perimetry update 1990/1991. Amsterdan: Kugler & Gehdini; 1991. p.381-90.
33. Brenton RS, Phelps CD. The normal visual field on the Humphrey field analyzer. Ophthalmologica. 1986;193(1-2):56-74.
34. Haas A, Flammer J, Schneider U. Influence of age on the visual fields of normal subjects. Am J Ophthalmol. 1986;101(2):199-203.
35. Tyler CW. Two processes control variation in flicker sensitivity over the life span. J Opt Soc Am A. 1989;6(4):481-90.
36. Rodriguez J, Garcia M, Gonzalez-Hernade M, La Rosa MG. Normal relationship between luminous threshold and critical flicker fusion frequency. In: Henson DB, Wall M. Perimetry Update 2002/2003. Amsterdan: Kugler; 2002. p.107-25.
37. Autzen T, Work K. The effect of learning and age on short-term fluctuation and mean sensitivity of automated static perimetry. Acta Ophthalmol (Copenh). 1990;68(3):327-30.
38. Horani A, Frenkel S, Yahalom C, Farber MD, Ticho U, Blumenthal EZ. The learning effect in visual field testing of healthy subjects using frequency doubling technology. J Glaucoma. 2002;11(6):511-6.
39. Joson PJ, Kamantigue ME, Chen PP. Learning effects among perimetric novices in frequency doubling technology perimetry. Ophthalmology. 2002; 109(4):757-60.
40. Tyler CW. Analysis of normal flicker sensitivity and its variability in the visuogram test. Invest Ophthalmol Vis Sci. 1991;32(9):2552-60.
41. Flammer J, Drance SM, Zulauf M. Differential light threshold. Short- and long-term fluctuation in patients with glaucoma, normal controls, and patients with suspected glaucoma. Arch Ophthalmol. 1984;102(5):704-6.
42. Lester M, Capris P, Pandolfo A, Zingirian M, Traverso CE. Learning effect, short-term fluctuation, and long-term fluctuation in frequency doubling technique. Am J Ophthalmol. 2000;130(2):160-4.
43. Kwon YH, Park HJ, Jap A, Ugurlu S, Caprioli J. Test-retest variability of blue-on-yellow perimetry is greater than white-on-white perimetry in normal subjects. Am J Ophthalmol. 1998;126(1):29-36.
44. Schimiti RB, Costa VP, Freitas TG, Magacho L, Arcieri ES, Kara-José N. Learning effect and long-and short-term fluctuations in frequency doubling perimetry. Arq Bras Oftalmol. 2003;66(3):299-304.
45. Chauhan B, Johnson C. Test-retest variability of frequency doubling perimetry and conventional perimetry in glaucoma patients and normal subjects. Inv Ophthalmol Vis Sci. 1999;40(3):648-56.
46. Heijl A, Lindgen G, Olsson J. Normal variability of static perimetric threshold values across the central visual field. Arch Ophthalmol. 1987;105(11):1544-9.
 Address to correspondence:
Luciana Bernardi
Rua Padre Vieira, 1235 - Apto. 55
Campinas (SP) CEP 13015-301
E-mail: [email protected]
Recebido para publicação em 13.02.2006
Última versão recebida em 19.07.2006
Aprovação em 14.08.2006
Os autores não têm nenhum interesse comercial ou financeiro nos equipamentos discutidos neste artigo.
*Matsumoto C. Personal Communication, 2005 Jan 20.