

Valdenir Ribeiro Jr.; Cristiane Farias Ribeiro; Marcos P. Ávila; Leopoldo Magacho
DOI: 10.5935/0004-2749.20170094
ABSTRACT
Purpose: To compare the linear measurements of the optic disk cup obtained using RTVue optical coherence tomography (OCT) with those obtained using digital retinography.
Methods: This is a cross-sectional study performed with digital retinography and RTVue OCT images from patients with glaucoma or patients suspected of glaucoma. In color retinography, the greatest horizontal and vertical diameters of the optic disk starting from the inner edge of the Elschnig ring were obtained using a pachymeter with a grade of 0.01 mm. In OCT, the delineation of the optic nerve was obtained automatically from the horizontal and vertical cup results.
Results: One hundred eyes from 100 subjects with a mean age of 60.1 ± 15.7 years were included. Of these, 79 were the right eye and 21 the left eye, with 61 men and 39 women. The mean horizontal cup obtained with OCT was 0.91 ± 0.10, while that obtained with retinography was 0.79 ± 0.11 (p<0.01).
Conclusions: There was poor agreement between the evaluated methods in the measurements of optic disk cup excavations. Measurements obtained automatically with OCT RTVue were higher but were significantly correlated with measurements obtained manually with digital retinography. Poor agreement of the optic disk parameters between the two imaging devices was noted.
Keywords: Optic disk; Glaucoma/diagnosis; Optic nerve; Aqueous humor; Tomography; Optical coherence; Diagnostic techniques; Ophthalmological
RESUMO
Objetivo: Comparar as medidas lineares da escavação do disco óptico, obtidas com o OCT RTVue com as obtidas pela retinografia digital.
Métodos: Trata-se de um estudo transversal. Utilizou-se imagens de retinografia digital e exames de OCT obtidos pelo aparelho RTVue de pacientes suspeitos ou com glaucoma. Na retinografia colorida, foram obtidos os maiores diâmetros horizontal e vertical do disco óptico, a partir da borda interna do Anel de Elschnig através de paquímetro com graduação de 0,01 mm. No OCT, a delineação do nervo óptico foi obtida automaticamente e a partir dos resultados foi registrado o diâmetro horizontal e vertical da escavação.
Resultados: Foram incluídos 100 olhos de 100 indivíduos, com idade média de 60,1 ± 15,7 anos. Desses, 79 foram do olho direito e 21 do olho esquerdo, sendo 61 homens e 39 mulheres. Verificou-se que as médias das escavações horizontais obtidas com o OCT foram de 0,91 ± 0,10, enquanto que as obtidas pela retinografia foram 0,79 ± 0,11 (p<0,01).
Conclusões: Nota-se fraca concordância entre os métodos avaliados para quantificar as medidas das escavações do disco óptico. As medidas obtidas automaticamente pelo OCT RTVue foram maiores, porém correlacionadas com as medidas obtidas manualmente pela retinografia digital. Além disso, notou-se fraca concordância nos parâmetros do disco óptico entre os dois dispositivos de imagens.
Descritores: Disco óptico; Glaucoma/diagnóstico; Nervo óptico; Humor aquoso; Tomografia de coerência óptica; Técnicas de diagnóstico oftalmológico
INTRODUCTION
Glaucoma is an optic disk and retinal nerve fiber layer (RNFL) neuropathy. The progression of glaucoma is generally accompanied by a progressive increase of the cup area in the optic disk. However, due to the wide variation in the cup sizes of normal individuals, this isolated criterion, although still widely used, is somewhat nonspecific for glaucoma diagnosis(1).
In addition to photographic records of the optic disk and RNFL (such as those obtained using digital retinography or stereo photography), computerized registration methods such as optical coherence tomography (OCT) can be used for diagnosis. Although not a direct method of registration, OCT aims to assess the optic disk and RNFL to detect early damage before the development of visual field defects(2-6).
However, results obtained with different methods cannot be extrapolated; that is, a value obtained with a given method may not be the actual size or may not be the same size as that obtained with another device(7,8). Thus, it is necessary to understand the agreement of measurements obtained with any imaging method and the real perspective at least through the photographic record "in vivo."
Other than research in the Medline database with the study descriptors, there are no studies comparing the optic disk measurements obtained using RTVue OCT with those obtained using retinography, which is the purpose of this study. Moreover, the correlation and agreement of optic disk parameters between the two imaging devices were evaluated.
METHODS
This is a cross-sectional study using data from medical records from the VER-Excellence in Ophthalmology Hospital, conducted with approval from the Research Ethics Committee of the Federal University of Goiás, number 644 263/2014.
One hundred patients were selected among those being monitored for glaucoma, ocular hypertension, or suspicion of glaucoma. All patients had complete data for digital color retinography (Visucam Lite, Carl Zeiss Meditec, Jena, Germany) and OCT, obtained with RTVue (Optovue, Fremont, CA, USA), for glaucoma evaluation. All tests were performed on the same day for each patient. Patients were selected consecutively, starting from the day the protocol was approved by the ethics committee. Only one eye per patient was evaluated. If both eyes were eligible, only the right eye was included. All examinations were performed by the same trained and experienced technician.
The selected patients fell into one of the three groups as defined below, according to the following criteria: ocular hypertensive-patients with intraocular pressure (IOP) >21 mmHg, optic disk without changes suggestive of glaucoma (cup-to-disk ratio [CDR] ≤0.5, without localized loss of the neural rim or RNFL), and without visual field changes consistent with glaucoma; glaucoma suspectspatients with increased cup size, but no characteristic signs of glaucoma to establish the diagnosis (same as above), with normal visual field, regardless of IOP levels; glaucoma-patients with glaucomatous optic disk (CDR ≥0.7, with inhomogeneous neural rim or CDR >0.5 with notching), with or without visual field defects, regardless of IOP levels or patients with optic disk initially suspected of glaucoma, whose defect was confirmed by compatible campimetric change.
Exclusion criteria for the groups were any conditions that could affect the results of the exams, such as cataract or poor quality. All exams were judged by two experienced glaucoma specialist examiners, masked to each other. Patients were excluded only with agreement between the two examiners. For the OCT results, the quality (SSD) was required to be >45.
RTVue OCT detects the margin of the optic disk based on the ends of the retinal pigment epithelium and choroid layers. For OCT, the optic disk delineation was obtained automatically, and the results were printed following the protocol for glaucoma.
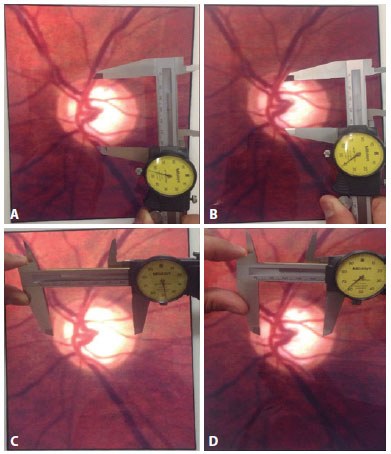
For color retinography, the largest horizontal and vertical optic disk diameters were obtained from the inner edge of the Elschnig ring, measured by means of a Mitutoyo caliper (Mitutoyo South American LTDA, Santo Amaro, SP, Brazil), regulated within 0.01 mm. The image from this examination was enlarged proportionally in a tablet with a retina screen (iPad 2, Apple, Cupertino, CA, USA). Initially, the greatest vertical length for the optic disk was obtained by placing the rods of the caliper between the edges of the Elschnig ring. Next, the size of the vertical cup for which the rods of the caliper showed the longest length was measured, delimited by the emergence location of major blood vessels (Figure 1). After obtaining the vertical measurements, the same procedure was performed for the horizontal measurements. The horizontal and vertical CDRs were obtained by simple division. To read the caliper measurement, the value in millimeters was read from the millimeter ruler, and the decimal value was read from the analog clock. Both examiners evaluated the retinography images together, but the same examiner used the pachymeter to perform all cup measurements after agreement between the two, masking the results obtained with the RTVue OCT.
Statistical analysis was performed with SPSS software version 22.0 (SPSS Inc, Chicago, IL, USA). The normality of the samples was determined with the Kolmogorov-Smirnov test. The CDR data obtained with OCT and retinography were collected, and comparison between the two was performed with the independent Student's t test. Categorical data were evaluated with the chi-square test. The Bland-Altman plot and kappa values were used to compare the results obtained from the two methods. The Pearson correlation was used for the measurements obtained with the methods, and the influence of the optic disk area in the results was identified through a partial correlation. In this study, p values <0.05 were considered significant.
RESULTS
One hundred eyes from 100 subjects with a mean age of 60.1 ± 15.7 years were included. Seventy nine right eyes and 21 left eyes from 61 men and 39 women were evaluated. There were 68 glaucomatous eyes, 18 eyes suspected of glaucoma, and 14 ocular hypertensive eyes, with a mean MD of -8.16 ± 8.25 dB, PSD: 5.55 ± 4.43 dB, and VFI: 84.41% ± 19.52%.
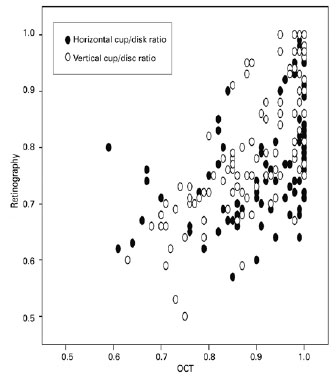
The CDR was higher with the RTVue OCT compared with retinography, both for the horizontal (0.91 ± 0.10 vs. 0.77 vs. 0.10, p<0.001) and vertical measurements (0.88 ± 0.09 vs. 0.79 ± 0.11, p<0.001; Figure 2). The correlation between the studied methods was r=0.47, p<0.001 for the horizontal CDR (r=0.487, p<0.001, partial correlation) and r=0.72, p<0.001 for the vertical CDR (r=0.727, p<0.001, partial correlation).
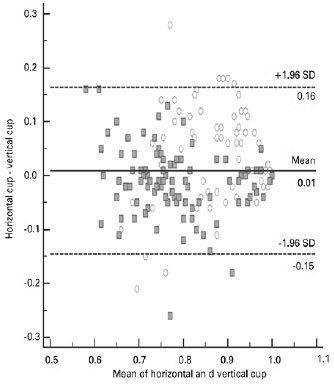
The Bland-Altman plot (Figure 3) was used to assess the agreement between the methods. There was poor agreement between the methods, both for the horizontal cup (kappa: 0.034, p=0.02) and the vertical cup (kappa: 0.058, p<0.001).
DISCUSSION
In the present study, a comparison of the measurements obtained with OCT and digital retinography was performed. However, retinography does not provide an image in three dimensions, complicating the judgment of vessel emergence in the cup and theoretically reducing the diagnostic accuracy, in comparison with optic disk stereoscopic photography(9).
A recent observational study compared the evaluation of the optic disc by glaucoma specialists using digital photography and stereoscopic photographs for glaucoma diagnosis. Various topographical features of the disc were evaluated, and there was good intraobserver agreement (k=0.56) between the retinographic and stereoscopic reviews for various parameters. The interobserver agreement for the diagnosis of glaucoma using digital photos (κ=0.61, CI=0.55-0.67) was not lower than that using stereoscopic photographs (κ=0.59, CI=0.54-0.65). Thus, these pictures do not appear to represent a significant disadvantage compared with the stereoscopic photos in the CDR assessment(10). Similar results have been demonstrated previously(11). Therefore, it is possible to assume that even with digital retinography, the current study used a reliable and accepted method to obtain the optic disc images. Moreover, the images obtained with retinography were evaluated by two glaucoma specialists, to reduce the possible bias mentioned above, since studies have shown greater correlation between glaucoma specialists in relation to nonspecialists when evaluating disk parameters(12,13). It is believed therefore that the inherent subjectivity of the retinography judgment was at least partially compensated. In contrast, it may be easier to accurately define the rim thickness in stereo-photos, including the contribution of the blood vessels. Future studies using stereo-photos should be performed to help address this question.
A new methodology was employed to obtain the cup measurements with a millimeter ruler, known as a caliper. The caliper features extremely fine calibration and measurement is possible for up to two decimal places, approaching the same level of accuracy as OCT in terms of absolute measurement units. In an attempt to reduce the measurement error, the dimensions of the cup were obtained on a screen with largely amplified images, to accurately identify the emergence of blood vessels. Always maintaining the proportion, the examiner could enlarge the image to try to reduce labeling doubts, especially at the edges. Even if misjudgment occurred, it was probably in the centesimal range. The choice of this method for estimating the cup measurements in digital retinography instead of relying only on expert opinion eliminates subjective bias for this variable. Thus, it is believed that the optic disc cup vertical and horizontal linear measurements were reliable and suitable for the study purpose.
Optic disc cup measurement was selected despite being a nonspecific measurement of disc normality(14) because it is the most widely used method, especially among general ophthalmologists. Moreover, it is the only variable for which direct measurements can be performed using photographic records of the optic disc, and hence can be compared for different imaging equipment. Neural rim analysis of the optic disc and RNFL is more sensitive for glaucoma but are more difficult to perform(14-16). However, in a previous study with the Cirrus OCT, the RNFL thickness was reported to be better than other parameters obtained from the optic disc for the discrimination of glaucoma, especially in patients with early-stage glaucoma and glaucoma patients with small optic disks(17).
A comparison of the Cirrus OCT (Carl Zeiss Meditec, Inc., Dublin, CA) images and the stereoscopic photographs showed that the area of the optic disk tended to be larger in the photographs than in the OCT images, while the cup areas were similar. The agreement between the two methods for the cup and the optic disk areas was considered good, but the agreement was only reasonable for the neural rim area(18).
In this study, the cup measurements, both vertically and horizontally, were significantly greater when obtained using OCT RTVue, compared with the measurements obtained with digital retinography. On average, the difference was 0.14 for horizontal measurements and 0.09 for vertical measurements.
Several possibilities can be suggested to explain the difference in the measurements obtained with the two methods. It should be noted that the methods used to obtain the images were different. Each method has its own characteristics for image acquisition and consequently, for structure evaluation, particularly OCT, which involves automatic measurements. The greatest difference found in the comparison of the horizontal cup between the methods can perhaps be explained by the emergence of the blood vessels at these poles, which could partially obstruct the actual limits. Even in optic disks with standard anatomy, "the cup edge" is an arbitrary diameter assignment for a twisted conical surface without a plane, for which the diameter is determined. The blood vessels along the disk's inner surface can also cause the threshold to become ambiguous or may be regarded as part of the rim or as within the cup limits.
Another possible explanation lies in the fact that the optic disk size determined with the OCT is smaller than that observed in the photographic images(19), probably because the OCT considers Bruch's membrane as the margin of the optic disk. The designation of the optic disk edge for image readings can be influenced by the contrast of the red optic disk tissue with the surrounding peripapillary tissue, and the edge of the Bruch's membrane is not always clear. Thus, the two methods have different definitions for the "optic disk margin." The difference was evident in this study, despite the use of the inner edge of the Elschnig ring seen at the margin of most optic disks, to match the edge of Bruch's membrane. Consequently, the discrepancy in the cup-disk ratio relationship between the determinations of the RTVue OCT and those assigned to the digital retinography by the examiner can also be explained in part by the fact that the contour was not defined using the same anatomical limits. However, the ability of the examiner to enlarge the image, maintaining the proportions of the digital retinography image to try to better locate the limits of the evaluated structures may have reduced this bias. Another potential limitation lies in the possible small differences in the angle of measurements between the lines chosen by the OCT software and those selected by the pachymetry examiner. Thus, we could not confirm that the same locations were used for the lines in both procedures, despite all attempts to maintain consistency as described above. A different protocol for analysis, such as new retinography measurements using specialized software (e.g., Image J), can eliminate potential bias related to the utilization of the pachymeter.
This study confirms previous reports that optic disk evaluation methods are not interchangeable(7,18-20). Previous studies have compared the optic disk values obtained with RTVue OCT and those obtained with confocal laser scanner (Heidelberg Retina Tomography, HRT-II) in patients with glaucoma. The edge of the optic disk was defined automatically for RTVue but was defined manually by a single experienced observer for the HRT-II. There was agreement in the optic disk parameters between the two imaging devices. Bland-Altman graphs, however, indicate significant differences between the RTVue and HRT-II for measurement of all optic disk parameters. The mean values for the area of the optic disk and the rim area obtained with HRT-II were consistently higher than those obtained with RTVue. The RTVue values were higher for the cup area, CDR, and the C/D vertical and horizontal relationship. Thus, it was concluded that the disk parameters for these two imaging devices are not interchangeable(7,21,22).
Patients who are being monitored using certain imaging methods should not have their results extrapolated to other methods. Based on the results presented herein, the values obtained for the cup with digital retinography should not be directly compared with those obtained with RTVue OCT.
Although there is a difference between the methods studied, a significant correlation was observed between the cup measurements obtained. There was a strong correlation when comparing the vertical cup measurements and moderate correlation for the horizontal cup measurements. These results are expected, since the likelihood of correlations between two methods that assess the same structures is high, even if there is no direct relationship. The cup measurements obtained with the OCT RTVue were systematically higher than those outlined by digital retinography, but the differences were within the same range. It is possible that different examiners can obtain different results, but the use of a high precision ruler and review by two glaucoma specialists served as mitigating factors for this limitation in trial subjectivity.
Since the correlation may be affected by disk size, as larger disks have larger cups(21) and smaller disks have smaller cups(22), the optic disk area was used to control the correlation. Despite performing an indirect measurement of the disk size, the RTVue OCT does not display the optic disk size in the results. As a device capable of more objective measurements than any disc size estimates made using retinography, corrective measurements would be needed to compensate for the optic effect during image acquisition with the RTVue OCT. However, the correlations showed no significant alterations and remained practically unchanged. Thus, this systematic variation mentioned above was present in optic disks of various sizes.
The Bland-Altman graph was used to assess the agreement between the measurement methods. Poor agreement in optic disk parameters was observed between the two imaging devices, as the mean values and the differences in measurements were significant from a clinical point of view.
We concluded from the results of this study that there was poor agreement between the OCT RTVue and digital retinography in the measurements of the optic disk cup. The optic disk measurements automatically obtained using OCT RTVue were greater, yet correlated with measurements obtained manually with digital retinography. Poor agreement in the optic disk parameters obtained with the two imaging devices was noted.
REFERENCES
1. Foster PJ, Buhrmann R, Quigley HA, Johnson GJ. The definition and classification of glaucoma in prevalence surveys. Br J Ophthalmol. 2002;86(2):238-42.
2. Gloster J, Parry DG. Use of photographs for measuring cupping in the optic disc. Br J Ophtalmol. 1974;58(10):850-62.
3. Huang D, Swanson EA, Lin CP, Schuman JS, Stinson WG, Chang W, et al. Optical coherence tomography. Science. 1991;254(5035):1178-81.
4. Schuman JS, Hee MR, Arya AV, Pedut-Kloizman T, Puliafito CA, Fujimoto JG, et al. Optical coherence tomography: a new tool for glaucoma diagnosis. Cur Opin Ophthalmol. 1995;6(2):89-95.
5. Iester M, Mikelberg FS, Courtright P, Drance SM. Correlation between the visual field indices and Heidelberg retina tomograph parameters. J Glaucoma. 1997;6(2):78-82.
6. Carpineto P, Ciancaglini M, Zuppardi E, Falconio G, Doronzo E, Mastropasqua L. Reliability of nerve fiber layer thickness measurements using optical coherence tomography in normal and glaucomatous eyes. Ophthalmology. 2003;110(1):190-5.
7. Mesiwala NK, Pekmezci M, Huang JY, Porco TC, Lin SC. Comparison of optic disc parameters measured by RTVue-100 FDOCT versus HRT-II. J Glaucoma. 2012;21(8):516-22.
8. Shpak AA, Sevostyanova MK, Ogorodnikova SN, Shormaz IN. Comparison of measurement error of Cirrus HD-OCT and Heidelberg Retina Tomograph 3 in patients with early glaucomatous visual field defect. Graefe's Arch Clin Exp Ophthalmol. 2012; 250(2):271-7.
9. Hasanreisoglu M, Priel E, Naveh L, Lusky M, Weinberger D, Benjamini Y, et al. Digital versus film stereo-photography for assessment of the optic nerve head in glaucoma and glaucoma suspect patients. J Glaucoma. 2013;22(3):238-42.
10. Chan HH, Ong DN, Kong YX, O'Neill EC, Pandav SS, Coote MA, et al. Glaucomatous optic neuropathy evaluation (GONE) project: the effect of monoscopic versus stereoscopic viewing conditions on optic nerve evaluation. Am J Ophthalmol. 2014; 157(5):936-44.
11. Parkin B, Shuttleworth G, Costen M, Davison C. A comparison of stereoscopic and monoscopic evaluation of optic disc topography using a digital optic disc stereo camera. Br J Ophthalmol. 2001;85(11):1347-51.
12. Breusegem C, Fieuws S, Stalmans I, Zeyen T. Agreement and accuracy of non-expert ophthalmologists in assessing glaucomatous changes in serial stereo optic disc photographs. Ophthalmology. 2011;118(4):742-6.
13. Lin AP, Katz LJ, Spaeth GL, Moster MR, Henderer JD, Schmidt CM, et al. Agreement of visual field interpretation among glaucoma specialists and comprehensive ophthalmologists: comparison of time and methods. Br J Ophthalmol. 2011;95(6):828-31.
14. Lopes FS, Dorairaj S, Junqueira DL, Furlanetto RL, Biteli LG, Prata TS. Analysis of neuroretinal rim distribution and vascular pattern in eyes with presumed large physiological cupping: a comparative study. BMC Ophthalmol. 2014;14:72.
15. Medeiros FA, Lisboa R, Zangwill LM, Liebmann JM, Girkin CA, Bowd C, et al. Evaluation of progressive neuroretinal rim loss as a surrogate end point for development of visual field loss in glaucoma. Ophthalmology. 2014;121(1):100-9.
16. Morgan JE, Bourtsoukli I, Rajkumar KN, Ansari E, Cunliffe IA, North RV, et al. The accuracy of the inferior>superior>nasal>temporal neuroretinal rim area rule for diagnosing glaucomatous optic disc damage. Ophthalmology. 2012;119(4):723-30.
17. Sung KR, Na JH, Lee Y. Glaucoma diagnostic capabilities of optic nerve head parameters as determined by Cirrus HD optical coherence tomography. J Glaucoma. 2012; 21(7):498-504.
18. Sharma A, Oakley JD, Schiffman JC, Budenz DL, Anderson DR. Comparison of automated analysis of Cirrus HD OCT spectral-domain optical coherence tomography with stereo photographs of the optic disc. Ophthalmology. 2011;118(7):1348-57.
19. Mesiwala NK, Pekmezci M, Porco TC, Lin SC. Optic disc parameters from optovue optical coherence tomography: comparison of manual versus automated disc rim determination. J Glaucoma. 2012;21(6):367-71.
20. Yang B, Ye C, Yu M, Liu S, Lam DS, Leung CK. Optic disc imaging with spectral-domain optical coherence tomography: variability and agreement study with Heidelberg retinal tomograph. Ophthalmology. 2012;119(9):1852-7.
21. Dervisevic E, Halilovic EA, Masic T, Dervisevic A. Influence of the optic disc size on cup diameter in patients with glaucoma simplex chronicum. Med Arch. 2013;67(4):272-4.
22. Jonas JB, Budde WM, Panda-Jonas S. Ophthalmoscopic evaluation of the optic nerve head. Surv Ophthalmol. 1999;43(4):293-320.
Submitted for publication:
July 20, 2016.
Accepted for publication:
June 24, 2017.
Funding: No specific financial support was available for this study.
Disclosure of potential conflicts of interest: None of the authors have any potential conflicts of interest to disclose.
Approved by the following research ethics committee: Hospital das Clínicas Universidade Federal de Goiás (#644 263/2014).
© 2024 - All rights reserved - Conselho Brasileiro de Oftalmologia
![]()
 English PDF
 Print
Print
 Send this article by email
 How to cite this article
 Submit a comment
 Mendeley
 Scielo
 Pocket
