
Arq. Bras. Oftalmol. 2026; 89 (5): 10.5935/0004-2749.2025-0377
Total: 1175
Gilvan Vilarinho da Silva Filho1; Gustavo Coelho Caiado1; Olívia Moura de Paula Ricardo2; Sergio Henrique Teixeira1; Tiago dos Santos Prata1; Carolina Pelegrini Barbosa Gracitelli1; Augusto Paranhos Jr1
DOI: 10.5935/0004-2749.2025-0377
ABSTRACT
PURPOSE: To evaluate the agreement between optic nerve head structural parameters obtained using swept-source optical coherence tomography and the Laguna ONhE software.
METHODS: This retrospective cross-sectional study included 353 eyes from healthy individuals, glaucoma suspects, ocular hypertensive patients, and patients with glaucoma. Optic nerve head parameters — including disc area, vertical and area cup-to-disc ratios, and rim volume — were measured using swept-source optical coherence tomography and Laguna ONhE. Agreement between methods was assessed using Bland–Altman analysis. A regression-based calibration model was developed for disc area measurements.
RESULTS: Laguna ONhE systematically underestimated disc area (p < 0.001) and cup-to-disc ratios (p<0.001) and overestimated rim volume (p=0.0002) compared with swept-source optical coherence tomography. After applying the calibration equation for disc area, agreement improved substantially, with no statistically significant bias (p=0.3).
CONCLUSION: Laguna ONhE provides structural estimates comparable with those obtained with swept-source optical coherence tomography after calibration, suggesting it may serve as a practical and cost-effective alternative for glaucoma evaluation.
Keywords: Glaucoma; Optic nerve head; Laguna ONhE; Optical coherence tomography; Agreement
INTRODUCTION
Glaucoma is a progressive optic neuropathy characterized by the loss of the ganglion cell layer (GCL), leading to structural alterations of the optic nerve head (ONH), thinning of the peripapillary retinal nerve fiber layer (pRNFL), and consequent visual impairment(1). As the disease progresses, the neuroretinal rim (NR) becomes progressively thinner — particularly in the inferotemporal and superotemporal regions — resulting in enlargement of the optic cup and an increased cup-to-disc (C/D) ratio(2). Because disc size is positively correlated with both optic cup size and NR area, accurate estimation of disc size is essential for glaucoma detection and diagnosis(3).
Eyes with large ONH areas often present proportionally large optic cups, which may be misinterpreted as glaucomatous cupping. Using planimetric analysis, Hoffmann et al.(4) reported a wide normal range of disc areas (1.70–2.89 mm2) and emphasized that large physiological discs frequently exhibit large cups.
Advances in diagnostic imaging technologies have enhanced the precision and objectivity of conventional clinical assessments. Prata et al.(5) demonstrated that optical coherence tomography (OCT) can help differentiate true glaucomatous damage from physiological cupping in eyes with large discs, thereby reducing diagnostic errors in challenging cases.
Reis et al. further demonstrated that the clinically visible optic disc margin does not always correspond to the true anatomical boundary of the ONH. Using spectral-domain OCT (SD-OCT) in combination with color fundus photography (CFP), they showed that the clinical margin typically aligns with Bruch's membrane and Elschnig's border tissue — structures that are not consistently visible in CFP. This finding represents a significant shift in the understanding of ONH anatomy, indicating that conventional photographic assessments may inaccurately estimate disc size, cup depth, or rim width(6).
Despite its diagnostic advantages, OCT remains limited by high cost and reduced portability(7). These limitations have driven the search for more accessible and cost-effective alternatives capable of providing reliable structural information about the ONH.
In 2013, Gonzalez de la Rosa et al.(8) developed Laguna ONhE, a software tool that estimates hemoglobin levels within the ONH using colorimetric analysis of CFP — a simple and low-cost approach. Previous studies have demonstrated good reproducibility and diagnostic accuracy of this system for glaucoma detection(9-13). In addition to hemoglobin estimation, Laguna ONhE can derive key structural parameters relevant to glaucoma diagnosis, including ONH area, C/D ratio, and NR volume, based solely on CFP.
Accurate determination of these parameters is essential for distinguishing between physiological and pathological cupping. Although OCT provides highly precise measurements, its cost and limited accessibility remain important barriers. Therefore, evaluating whether Laguna ONhE can provide comparable measurements using CFP is clinically relevant(9-13). Accordingly, this study aimed to assess the agreement between structural parameters obtained using swept-source OCT (SS-OCT) and Laguna ONhE in healthy individuals, glaucoma suspects, and patients with glaucoma.
METHODS
This retrospective cross-sectional clinical study included data collected between 2017 and 2025 at Clínica Forno e Paranhos (São Paulo, Brazil) and Hospital de Olhos Previsão (Teresina, Brazil). The study protocol was approved by the Research Ethics Committee of the Universidade Federal de São Paulo (Approval No. 52700221.9.0000.5505). The requirement for informed consent was waived owing to the retrospective nature of the study.
Glaucoma was defined as optic neuropathy characterized by typical structural abnormalities of the ONH, accompanied by corresponding thinning of the peripapillary retinal nerve fiber layer (pRNFL) and GCL on OCT, with or without associated visual field (VF) defects.
Glaucoma suspects were defined as eyes presenting either a vertical cup-to-disc (C/D) ratio ≥0.6 suggestive of ONH damage or intraocular pressure (IOP) >21 mmHg (ocular hypertension), in the absence of definitive glaucomatous optic neuropathy.
Healthy subjects were required to have IOP <21mmHg, a normal ONH appearance on fundoscopy, and normal OCT and VF findings.
Inclusion criteria were as follows: best-corrected visual acuity (VA) ≥0.1 (decimal scale), absence of ocular or systemic conditions that could affect VF results, no ocular disease other than glaucoma, no history of ocular surgery except uncomplicated cataract or antiglaucoma procedures, spherical refractive error between −10 diopters (D) and +6 D, and astigmatism ≤2 D.
Exclusion criteria included reduced VA, retinal or neurological disorders, unreliable VF examinations, low-quality OCT scans, and CFP unsuitable for analysis using Laguna ONhE.
All participants underwent a comprehensive ophthalmologic evaluation, including medical history, VA assessment, slit-lamp biomicroscopy, IOP measurement, and fundoscopy.
VF and OCT assessment
VF testing was performed using the Octopus 900 perimeter (Haag-Streit AG, Koeniz-Berne, Switzerland) with Goldmann size III stimuli, the Tendency-Oriented Perimetry strategy, and the G program (a physiological grid of 59 test locations within the central 30°). At least two reliable VF tests were required, defined as false-positive and false-negative rates <15% and absence of artifacts. Glaucomatous VF defects were defined as reproducible abnormalities not attributable to other causes.
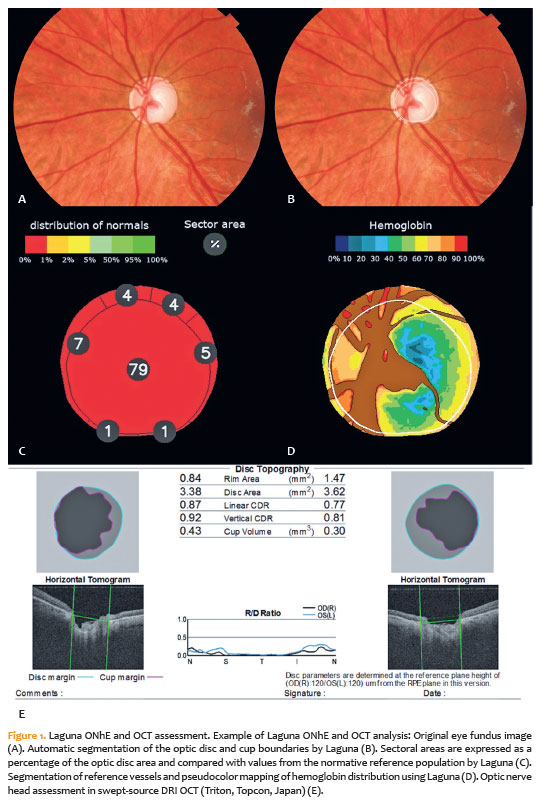
Structural evaluation was conducted using swept-source DRI OCT (Triton, Topcon, Japan), with ONH parameters obtained using the 3D Wide 12 × 9 mm scanning protocol. In this system, ONH measurements are referenced to the termination of the retinal pigment epithelium (RPE), which serves as the baseline for all calculations and is displayed as a green line in OCT reports. The projection of this reference line onto the retinal surface defines the disc margin (light blue line).
The cup margin (pink line) is defined at a plane located 120 µm above the RPE reference, enabling calculation of topographic parameters, including rim area, disc area, C/D ratio, and cup volume (Figure 1). Only scans with signal strength >40 were included.
Laguna ONhE assessment
CFP were acquired using the DRI OCT device and analyzed with Laguna ONhE software (version 8.0; http://test.laguna.insoft.es/). The software uses the MATLAB image processing toolbox (The MathWorks, Inc., Natick, Massachusetts) to analyze the red, green, and blue spectral components of ONH images and estimate hemoglobin (Hb) concentration, using large retinal vessels as the 100% Hb reference(8).
The software automatically segments disc and cup boundaries (Figure 1) and calculates ONH area, vertical C/D ratio, C/D area ratio, and NR volume. This segmentation is performed using a deep learning–based neural network trained on approximately 40,000 fundus images, including those from the RIM-ONE database. A U-Net semantic segmentation architecture was implemented. Additionally, manual delineation of 2,000 ONH images was performed by Gonzalez de la Rosa to refine the detection of the inner edge of Elschnig's scleral ring(14,15).
The neural network identifies optic disc and cup boundaries by detecting the inner border of Elschnig's tissue through pixel-level analysis. It also evaluates hemoglobin distribution within the ONH using color information from the red, green, and blue channels (Figure 1). Using these data, the software automatically computes vertical and area C/D ratios(9,16). Images of insufficient quality or with incomplete ONH visualization were excluded.
Statistical analysis
Continuous variables are presented as mean, standard deviation (SD), median, and range, while categorical variables are expressed as absolute frequencies and percentages.
Agreement between Laguna ONhE and OCT measurements was evaluated using Bland–Altman analysis, with differences defined as OCT minus Laguna values. Bias and 95% limits of agreement (LoA) were calculated. A paired t-test was used to assess whether the mean bias differed significantly from zero.
To evaluate the influence of ONH size on measurement agreement, the sample was stratified based on OCT-derived disc area using a cutoff of 2.5 mm2, consistent with reported normal ranges (2.1–2.5 mm2)(17,18).
A calibration model for disc area was developed using multiple linear regression, with OCT measurements as the dependent variable and Laguna values as the primary independent variable(19,20). Additional covariates included disc area, age, and mean deviation (MD). Although the inclusion of age and MD yielded slight statistical improvements, these were not clinically meaningful. Therefore, for practical applicability, only the disc area was retained as a covariate in the final model.
The dataset was randomly divided into a calibration set (70%; 245 eyes) and a validation set (30%; 105 eyes). Separate stratification of eyes with disc area >2.5 mm2 was not performed in the validation phase due to the limited sample size in this subgroup, which could reduce statistical precision and artificially widen the LoA. Because disc area was incorporated into the calibration model, its effect on large discs was inherently accounted for, obviating the need for further subgroup analysis.
To assess clinical equivalence between OCT and Laguna measurements of disc area, the Two One-Sided Tests (TOST) procedure was applied. Equivalence margins of ±0.20 and ±0.10 mm2 were predefined as clinically acceptable differences. Both paired t tests and TOST analyses were performed on uncalibrated and calibrated datasets.
All statistical analyses were conducted using IBM SPSS Statistics (IBM Corp., Armonk, New York). A p-value < 0.05 was considered statistically significant.
RESULTS
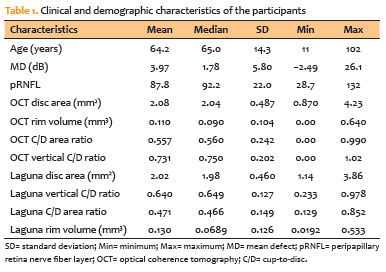
A total of 629 eyes from 442 patients were initially evaluated. One eye per subject was randomly selected to avoid inter-eye correlation, resulting in a final sample of 353 eyes. Eighty-six eyes were excluded due to the inability of the Laguna ONhE software to analyze the images, and 13 eyes were excluded due to low OCT signal strength (signal strength <40). The final cohort included 165 glaucomatous eyes (46.8%), 110 glaucoma suspect eyes based on ONH findings (31%), 15 ocular hypertensive eyes (4.2%), and 63 healthy eyes (18%). Baseline characteristics are shown in table 1.
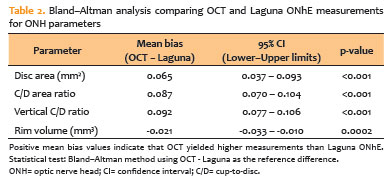
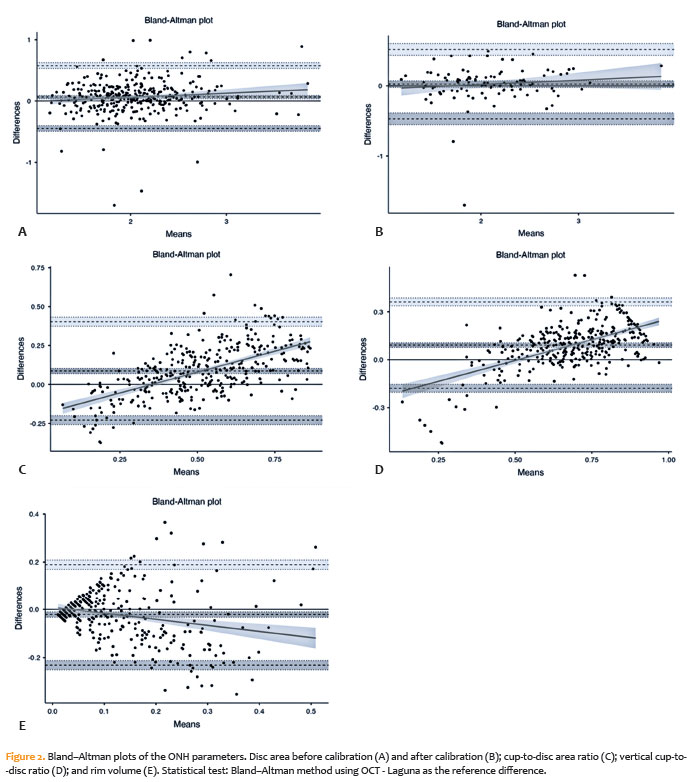
The results demonstrated a consistent pattern of agreement with systematic bias across all variables, indicating that Laguna ONhE tends to underestimate disc area and C/D ratios and overestimate rim volume when compared to OCT (Table 2 and Figure 2).
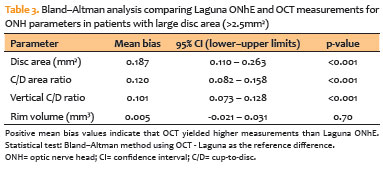
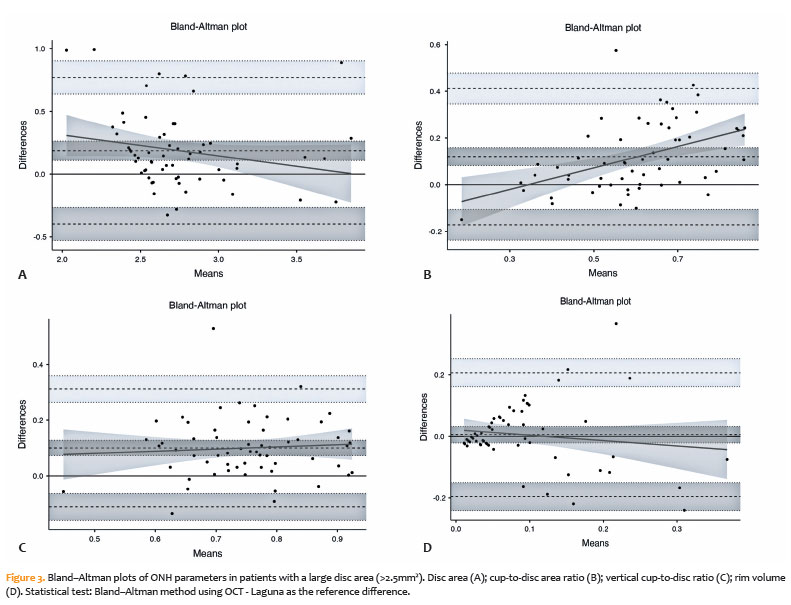
In the subgroup of 60 eyes with large disc area (>2.5 mm2), the pattern of agreement was similar to that of the overall sample, but the magnitude of bias was more pronounced (Table 3 and Figure 3). These findings suggest that Laguna ONhE tends to underestimate morphometric parameters more strongly in larger optic discs.
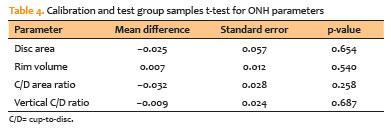
No statistically significant differences were observed in ONH parameters between the calibration and test groups (Table 4). The calibration equation for disc area was as follows: OCT disc area=0.33 + 0.81 × Laguna disc area.
After calibration, there was a marked improvement in agreement between Laguna ONhE and OCT for disc area (Figure 2B), with the mean bias reduced to 0.025 (95% CI=−0.023 to 0.074), and no statistically significant difference observed (p=0.3), indicating correction of systematic measurement error.
The TOST analysis showed that the difference between Laguna and OCT optic disc area measurements was clinically equivalent within the predefined ±0.20 mm2 and ±0.10 mm2 margins. In the uncalibrated dataset, the mean difference was statistically significant (p<0.001), but still within both equivalence margins (Table 5). After calibration, the mean difference was no longer statistically significant (p=0.307) and remained clinically equivalent within both margins (Table 5).
DISCUSSION
Our study demonstrated good agreement between Laguna ONhE and OCT measurements of ONH parameters and showed that a calibration model significantly improved concordance, particularly for disc area. Even before calibration, the mean differences between methods were not clinically relevant, although a consistent systematic bias was observed. After correction for disc-size–related bias, agreement improved further, and Laguna ONhE measurements of disc area became statistically and clinically comparable to OCT. These findings are clinically important because accurate ONH assessment is essential for distinguishing true glaucomatous damage from physiological large optic cups. In this context, calibrated Laguna ONhE may represent a practical, low-cost alternative for structural evaluation and glaucoma screening, especially where OCT is not available.
The evaluation of the ONH appearance remains fundamental for both the diagnosis and monitoring of glaucoma(21). Accurate identification of the ONH margin is crucial because it directly affects estimates of ONH area, C/D ratio, and NR metrics(21). However, defining the clinically visible ONH margin has long been controversial, as the anatomical structures that represent the true ONH boundary are not consistently visualized using conventional examination techniques(6). Thus, estimates of disc size and related parameters can vary considerably depending on the assessment method used(22).
Reis et al. demonstrated that the clinically visible disc margin does not consistently correspond to the true anatomical boundary of the ONH. Using spectral-domain OCT (SD-OCT), they showed that the apparent margin is generally defined by Bruch's membrane and Elschnig's border tissue — structures that are not reliably visible on CFP. This finding indicates that traditional photographic assessment may lead to errors in estimating disc size, cup depth, and rim width, potentially resulting in misclassification of physiologically large discs as glaucomatous(6). In this context, our findings support the potential role of software-based approaches such as Laguna ONhE in reducing these limitations by providing a more standardized and accessible method for ONH evaluation.
OCT plays a key role in the assessment of eyes with large optic discs, as it allows detection of true glaucomatous damage even in the presence of physiological cupping(5). Although OCT is currently considered a reference standard for quantitative ONH analysis, its high cost and limited availability restrict its widespread use. In this scenario, Laguna ONhE represents a promising alternative. In our study, it showed good agreement with OCT for disc area after calibration (p=0.3), despite a mild tendency toward underestimation.
This underestimation is likely related to the methodological principles of the software. Laguna ONhE uses a deep learning–based U-Net architecture to identify the inner edge of Elschnig's tissue(14). This model was trained using images in which optic disc margins were manually delineated by an expert (Gonzalez de la Rosa)(15). As previously reported by Reis et al.(6), OCT-based methods tend to overestimate disc area compared with manual delineation approaches, which may explain part of the discrepancy observed in our results. Overall, despite this systematic bias, Laguna ONhE demonstrated consistent concordance with OCT and may provide reliable disc size estimates for clinical and screening purposes.
Glaucoma progression is characterized by progressive loss of the NR, particularly in the inferior and superior temporal regions(2,23), leading to an increase in the vertical C/D ratio. In our study, Laguna ONhE tended to underestimate both vertical and area C/D ratios compared with OCT, consistent with previous findings by Rodríguez Uña et al.(24), who also reported greater discrepancies in more advanced glaucoma cases. This difference may be explained by the fundamentally different analytical approach used by Laguna ONhE. Unlike OCT, which relies on structural boundaries, Laguna estimates the vertical C/D ratio based on hemoglobin concentration distribution within the optic nerve head(24), which may reduce agreement for morphometric parameters.
Supporting this interpretation, previous studies have shown that hemoglobin concentration within the remaining NR is often reduced below normal thresholds, suggesting that neurodegenerative changes may persist even when structural parameters appear relatively stable(25). However, it remains unclear whether reduced perfusion contributes to axonal loss, results from it, or occurs in parallel. In addition, OCT-derived morphometric parameters may be affected by a floor effect due to residual nonfunctional tissue in advanced glaucoma. In contrast, the hemoglobin-based approach of Laguna ONhE may exhibit a different behavior in advanced disease. Since our sample included a considerable proportion of advanced glaucoma cases, this may partly explain the underestimation of the vertical C/D ratio compared with OCT.
In a case–control study, González-Hernández reported moderate agreement between Laguna ONhE and Cirrus OCT (Zeiss) for vertical C/D ratio (κ≈0.7) and slightly higher concordance between Laguna global damage factor and Spectralis OCT (Heidelberg) Bruch's membrane opening–minimum rim width (BMO-MRW) (κ≈0.8)(15). Similarly, Salazar-Quiñones reported significant correlations between BMO-MRW and Laguna-derived vertical C/D ratio in both glaucomatous eyes (r=0.271 to −0.654, p < 0.05) and healthy controls (r=0.306 to −0.658, p<0.05)(26). Unlike these studies, our analysis used Bland–Altman methodology, which assesses agreement and systematic bias rather than correlation. Our results demonstrated statistically significant bias, indicating that Laguna ONhE tends to underestimate vertical and area C/D ratios and overestimate rim volume compared with OCT.
This study has several limitations. First, we did not include planimetric analysis as a reference standard for ONH evaluation. Although previous studies, including Jonas and the Blue Mountains Eye Study, have reported high reproducibility for planimetry (ICC=0.91 for disc area)(27), this method is time-consuming and highly dependent on subjective delineation of disc margins, which may not correspond to true anatomical boundaries, as previously demonstrated by Reis et al.(6).
Second, the OCT device used in this study (Triton SS-OCT) does not define ONH boundaries based on Bruch's membrane opening (BMO), unlike other systems such as Spectralis OCT. Instead, it uses RPE termination as a reference for ONH measurements, which may introduce systematic differences when comparing results across devices(28).
Another limitation is that 86 eyes were excluded because Laguna ONhE could not perform automated analysis due to poor image quality or atypical optic disc anatomy. This reflects an inherent limitation of the software and highlights the continued need for complementary diagnostic tools in such cases.
Despite these limitations, this is, to our knowledge, the first study to evaluate agreement between Laguna ONhE and OCT for disc area, C/D area ratio, and NR volume. Among these parameters, only disc area achieved acceptable agreement after calibration, suggesting that it may be reliably estimated at a group level, although individual variability remains considerable. In contrast, C/D ratios and rim volume showed persistent bias, indicating that these parameters are not fully interchangeable between the two methods. These findings should be considered when interpreting clinical data and suggest that selected ONH parameters may be reasonably estimated without OCT.
Finally, our findings have practical clinical implications. Large optic discs often present with proportionally large physiological cups, which may be misinterpreted as glaucomatous damage, particularly by less experienced clinicians. By including a wide range of disc sizes, our study demonstrated that Laguna ONhE maintains acceptable agreement with OCT, especially after calibration. Given its low-cost and wide accessibility, Laguna ONhE may serve as a useful adjunct or alternative to OCT, improving access to ONH evaluation in routine clinical practice and screening settings.
AUTHORS' CONTRIBUTIONS:
Significant contribution to conception and design: Gilvan Vilarinho da Silva Filho, Sergio Henrique Teixeira, Tiago dos Santos Prata, Carolina Pelegrini Barbosa Gracitelli, Augusto Paranhos Jr.
Data Acquisition: Gilvan Vilarinho da Silva Filho, Gustavo Coelho Caiado, Olívia Moura de Paula Ricardo.
Data Analysis and Interpretation: Gilvan Vilarinho da Silva Filho, Sergio Henrique Teixeira, Tiago dos Santos Prata, Carolina Pelegrini Barbosa Gracitelli, Augusto Paranhos Jr. Manuscript Drafting: Gilvan Vilarinho da Silva Filho, Sergio Henrique Teixeira, Tiago dos Santos Prata, Carolina Pelegrini Barbosa Gracitelli, Augusto Paranhos Jr.
Significant intellectual content revision of the manuscript: Gilvan Vilarinho da Silva Filho, Sergio Henrique Teixeira, Tiago dos Santos Prata, Carolina Pelegrini Barbosa Gracitelli, Augusto Paranhos Jr.
Final approval of the submitted manuscript: Gilvan Vilarinho da Silva Filho, Sergio Henrique Teixeira, Tiago dos Santos Prata, Carolina Pelegrini Barbosa Gracitelli, Augusto Paranhos Jr. Statistical analysis: Gilvan Vilarinho da Silva Filho, Sergio Henrique Teixeira, Tiago dos Santos Prata, Carolina Pelegrini Barbosa Gracitelli, Augusto Paranhos Jr.
Obtaining funding: not applicable.
Supervision of administrative, technical, or material support: Gilvan Vilarinho da Silva Filho, Sergio Henrique Teixeira, Tiago dos Santos Prata, Carolina Pelegrini Barbosa Gracitelli, Augusto Paranhos Jr.
Research group leadership: Gilvan Vilarinho da Silva Filho, Carolina Pelegrini Barbosa Gracitelli, Augusto Paranhos Jr.
REFERENCES
1. Weinreb RN, Aung T, Medeiros FA. The pathophysiology and treatment of glaucoma. JAMA. 2014;311(18):1901–11.
2. Jonas JB, Gusek GC, Naumann GO. Optic disc morphometry in chronic primary open-angle glaucoma. I. Morphometric intrapapillary characteristics. Graefes Arch Clin Exp Ophthalmol. 1988;226(6):522–30.
3. Caprioli J, Miller JM. Optic disc rim area is related to disc size in normal subjects. Arch Ophthalmol. 1987;105(12):1683–5.
4. Hoffmann EM, Zangwill LM, Crowston JG, Weinreb RN. Optic disk size and glaucoma. Surv Ophthalmol. 2007;52(1):32–49.
5. Prata TS, Dorairaj S, Trancoso L, Kanadani FN, Biteli LG, Furlanetto R, et al. Eyes with large disc cupping and normal intraocular pressure: using optical coherence tomography to discriminate those with and without glaucoma. Med Hypothesis Discov Innov Ophthalmol. 2014;3(3):91–8.
6. Reis AS, Sharpe GP, Yang H, Nicolela MT, Burgoyne CF, Chauhan BC. Optic disc margin anatomy in patients with glaucoma and normal controls with spectral domain optical coherence tomography. Ophthalmology. 2012;119(4):P738–47.
7. Olson J, Sharp P, Goatman K, Prescott G, Scotland G, Fleming A, et al. Improving the economic value of photographic screening for optical coherence tomography-detectable macular oedema: a prospective, multicentre, UK study. Health Technol Assess. 2013;17(51):1–142.
8. Gonzalez de la Rosa M, Gonzalez-Hernandez M, Sigut J, Alayon S, Radcliffe N, Mendez-Hernandez C, et al. Measuring hemoglobin levels in the optic nerve head: comparisons with other structural and functional parameters of glaucoma. Invest Ophthalmol Vis Sci. 2013;54(1):482–9.
9. Gonzalez-Hernandez M, Gonzalez-Hernandez D, Perez-Barbudo D, Rodriguez-Esteve P, Betancor-Caro N, Gonzalez de la Rosa M. Fully automated colorimetric analysis of the optic nerve aided by deep learning and its association with perimetry and OCT for the study of glaucoma. J Clin Med. 2021;10(15):3231.
10. Rocha JA, Dias DT, Lemos MB, Kanadani FN, Paranhos A Jr, Gracitelli CP, et al. Optic nerve head hemoglobin levels in glaucoma: a structural and functional correlation study. J Ophthalmol. 2021;2021(1):9916102.
11. Mendez-Hernandez C, Rodriguez-Uña I, Gonzalez-de-la Rosa M, Arribas-Pardo P, Garcia-Feijoo J. Glaucoma diagnostic capacity of optic nerve head haemoglobin measures compared with spectral domain OCT and HRT III confocal tomography. Acta Ophthalmol. 2016;94(7):697–704.
12. Meneses LS, Ciarlini LR, Ayub G, Vasconcellos JP, Costa VP. Discrimination between healthy eyes and those with mild glaucoma damage using hemoglobin measurements of the optic nerve head. J Glaucoma. 2022;31(7):567–73.
13. Rocha JA, Goytacaz TC, Calzavara Lemos MB, Paranhos A, Teixeira SH, Kanadani FN, et al. Assessment of structural progression in glaucoma through automated optic nerve head hemoglobin measurements. J Glaucoma. 2025; 34(3):182–8.
14. Gonzalez-Hernandez M, Gonzalez-Hernandez D, Perez-Barbudo D, Gonzalez de la Rosa M. Optic disc area frequency distribution in a large sample of retinographic images. BMJ Open Ophthalmol. 2022;7(1):e000972.
15. Gonzalez-Hernandez D, Diaz-Aleman T, Perez-Barbudo D, Mendez-HernandezC, Gonzalez De La Rosa M, Gonzalez-Hernandez M. Segmentation of the optic nerve head based on deep learning to determine its hemoglobin content in normal and glaucomatous subjects. J Clin Exp Ophthalmol. 2018;9(5):1–8.
16. Gonzalez-Hernandez M, Gonzalez-Hernandez D, Betancor-Caro N, Guedes-Guedes I, Guldager MK, Gonzalez de la Rosa M. Glaucoma incidence and progression in diabetics: the canary islands study using the laguna onhe application. J Clin Med. 2022;11(24):7294.
17. Medeiros FA, Zangwill LM, Bowd C, Vessani RM, Susanna R, Weinreb RN. Evaluation of retinal nerve fiber layer, optic nerve head, and macular thickness measurements for glaucoma detection using optical coherence tomography. Am J Ophthalmol. 2005;139(1):P44–55.
18. Ramrattan RS, Wolfs RC, Jonas JB, Hofman A, de Jong PT. Determinants of optic disc characteristics in a general population: the Rotterdam study. Ophthalmology. 1999;106(8):1588–96.
19. Freedman LS, Midthune D, Carroll RJ, Kipnis V. A comparison of regression calibration, moment reconstruction and imputation for adjusting for covariate measurement error in regression. Stat Med. 2008;27(25):5195–216.
20. Kamun SJ, Nyakundi C, Simwa R. Two sample approaches to regression calibration for measurement error correction. Int J Stat Distrib Appl. 2023;9(1):35–40.
21. Weinreb RN, Khaw PT. Primary open-angle glaucoma. Lancet Lond Engl. 2004;363(9422):1711–20.
22. Manassakorn A, Ishikawa H, Kim JS, Wollstein G, Bilonick RA, Kagemann L, et al. Comparison of optic disc margin identified by color disc photography and high-speed ultrahigh-resolution optical coherence tomography. Arch Ophthalmol Chic Ill 1960. 2008;126(1):58–64.
23. Jonas JB, Fernández MC, Stürmer J. Pattern of glaucomatous neuroretinal rim loss. Ophthalmology. 1993;100(1):63–8.
24. Rodríguez Uña I, Méndez Hernández CD, Sáenz-Francés F, García Feijóo J. Correlación de la relación excavación/papila óptica medida mediante HRT-III, SD-OCT y el dispositivo de colorimetría fotográfica Laguna OnhE. Arch Soc Esp Oftalmol. 2015 ;90(5):212–9. Spanish.
25. Gonzalez-Hernandez M, Sigut Saavedra J, Gonzalez de la Rosa M. Relationship between retinal nerve fiber layer thickness and hemoglobin present in the optic nerve head in glaucoma. J Ophthalmol. 2017;2017(1):2340236.
26. Salazar-Quiñones L, Pérez-Quiñones Y, Etxabe-Ávila H, Fernández-Vigo JI, Méndez-Hernández C, García-Feijóo J. Diagnostic capacity and correlation of optic nerve colorimetry with structural parameters in primary open angle glaucoma. J Glaucoma. 2025;34(6):484–93.
27. Jonas JB, Bergua A, Schmitz-Valckenberg P, Papastathopoulos KI, Budde WM. Ranking of optic disc variables for detection of glaucomatous optic nerve damage. Invest Ophthalmol Vis Sci. 2000;41(7):1764–73.
28. Kourkoutas D, Triantafyllopoulos G, Georgiou I, Karamaounas A, Karamaounas N, Sotiropulos K, et al. Comparison of diagnostic ability between wide-field swept-source optical coherence tomography imaging maps and heidelberg retina tomograph 3 optic nerve head assessment to discriminate glaucomatous and non-glaucomatous eyes. Cureus. 2022;14(8):e28188.
Submitted for publication:
December 12, 2025.
Accepted for publication:
March 26, 2025.
Approved by the following research ethics committee: Universidade Federal de São Paulo – UNIFESP (CAAE: 52700221.9.0000.5505).
Data Availability Statement: The datasets produced and/or analyzed in this study can be provided to referees upon request.
Edited by
Editor-in-Chief: Newton Kara-Júnior
Associate Editor: Jayter de Paula
Funding: This study received no specific financial support.
Disclosure of potential conflicts of interest: The authors declare no potential conflicts of interest.

How to cite this article:
 ABO is licensed under a Creative Commons Attribution-NonComercial 4.0 Internacional.