

André A. Homsi Jorge1; Harley E. A. Bicas2; Bruno Henrique Silva3; João A. de Paula Filho4; Graziela Boschetti5; Marina R. de Sunti1; Renata J. de Moura4
DOI: 10.5935/0004-2749.2022-0367
ABSTRACT
PURPOSE: This study aimed to examine the prevalence of myopic eyes over 11 years (2008-2018) in a private clinic and a public assistance service.
METHODS: We retrospectively evaluated 6332 individuals (12,664 eyes)
between 5 and 25 years old, seen at a private clinic-CEMO (2,663 individuals) and a public service-HOIP (3,669 individuals) from 2008 to 2018. We evaluated the prevalence of myopic eyes (EE ≤-0.50) and high myopic eyes (EE ≤-6.00).
RESULTS: Sex and services did not show statistical differences. The variation in the prevalence of myopic and high myopic eyes showed a random pattern during the study period (this prevalence could not be increased). Prevalences ranged from 20.7% (in 2017) to 32.4% (in 2015) for myopic eyes and from 1.6% (in 2009 and 2016) to 3.3% (in 2015) for eyes with high myopia. The prevalence of myopia showed a statistically significant increase based on the age group.
CONCLUSION: The prevalence of myopic eyes did not increase in our study. The mean prevalence of myopic eyes was similar in the private clinic and public service.
Keywords: Myopia; Refractive errors; Epidemiology; Prevalence
INTRODUCTION
Myopia is a refractive error wherein wavefronts of the light from the infinite are refracted to a point before the retina. This may occur due to an axial cause, a refractional one, or both.
Such a refractive (axial plus refractional) error is determined by complex genetic, social, cultural, or environmental(1-5) factors, which are not yet elucidated. The genetic factors are not related to a simple Mendelian heritage. Modern molecular technologies can identify several loci related to myopia(3,5), and several ethnical variations and different genetic factors are responsible for its occurrence and development. Besides, the interfering social, educational, and environmental factors on its expression may also be multiple.
Recently, myopia has progressively gained attention from the scientific community. This is due to the significant increase in the prevalence of myopia in several places, mainly in the Eastern countries. Several studies have studied myopia, and theories have been advanced to explain its occurrence, as well as therapeutic measurements for its control. Myopia is the main cause of the decline in visual acuity for distant vision, affecting 1.4 × 10⁹ individuals worldwide (27% of the world population) in 2010(6). In some age groups of many Asiatic countries, the prevalence of myopia is >80%. Currently, the prevalence of myopia among teenagers and young people in South Korea, Taiwan, and China is between 84% and 97%(7-9). Evidence showed that the increased prevalence was also accompanied by increased myopia quantitative values(8). Vitale et al.(10) found that the prevalence of moderate myopia (between -2.00 and -7.90 D) in the USA doubled (from 11.4% in 1972-1973 to 22.4% in 1999-2000), whereas the prevalence of high myopia (>-8.00 D) increased eight times during the same interval (from 0.2% to 1.6%). The worldwide prevalence of high myopia (usually ≥-5.00 D) was 2.9% in 2010 (224 × 106 individuals)(3). In Brazil, studies concerning the prevalence of myopia are limited, and data were not sufficient to determine if the increasing trend affected our country. A study conducted in Goiania(11) showed an increased prevalence of myopia from 9.97% (between 1995 and 2000) to 22.0% (in 2014). In 2013, another study evaluated the distribution of refractive defects in a restricted part of the Sao Paulo state and found a prevalence of myopia of 22.5%(12). Considering that Brazil has 201 × 106 inhabitants, we estimated that between 22 and 72 × 106 individuals have myopia and between 2 and 7 × 10⁶ have degenerative myopia(13).
This study aimed to observe the prevalence of myopic eyes in private practice and public assistance in two cities of the Sao Paulo state between 2008 and 2018.
METHODS
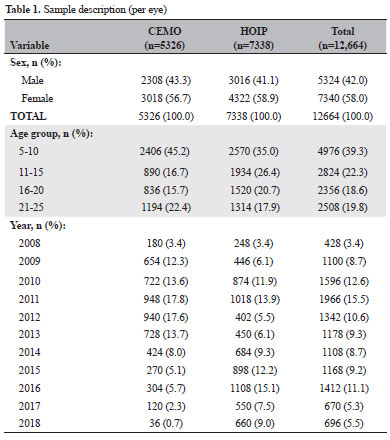
Between 2008 and 2018, we considered only the initial ocular refraction of 6,332 subjects (12,664 eyes), including 2,663 (5,326 eyes) from a private practice Centro Medico Oftalmológico (CEMO) by one of the authors (A.A.H.J.) in Ribeirão Preto (SP) and 3,669 (7,338 eyes) from the Hospital Oftalmológico do Interior Paulista (HOIP) in Araraquara (SP), where people registered in the national public health system (SUS - Sistema Único de Saúde) have access. Table 1 shows the general description of the sample and information concerning the places these examinations were performed.
The inclusion criteria were age between 5 and 25 years, no associated eye disease (besides ocular refractive defects), eyes with spherical equivalents (EE) of ≤-0.50 (Group 1, myopic eyes) and ≥-0.49 D (Group 2, nonmyopic eyes) in relative (not modular) values, i.e., the signal being considered. The ocular refractive state was objectively measured using automatized refractors (Huvitz at CEMO, Canon RK-F1 at HOIP) approximately 40-60 min after cycloplegia, obtained by consecutive instillations of one eye drop each, at 1-min intervals, of solutions of proximetacaine 0.5% (for an initial ocular anesthesia), cyclopentolate hydrochloride 1.0%, and tropicamide 1.0%.
To completely analyze our results, the subjects were divided into four age groups: 5-10, 11-15, 16-20, and 21-25 years.
Special consideration was given to the group with high myopia, defined as the spherical equivalent of ≤-6.00 D.
Both, the Centro Médico Oftalmológico (CEMO) in Ribeirão Preto and the Hospital Oftalmológico do Interior Paulista (HOIP) in Araraquara, provide services for specific ophthalmological attendance, although the characteristics of their respective population differ. The CEMO is a private practice clinic extending its services to individuals with health insurance, that is, those with higher economic level (and, supposedly, educational and social), whereas the HOIP serves, exclusively, individuals depending on the public system. The locations of these centers are in cities (in a relatively prosperous Brazilian region) that are geographically close (about 90 km) and compare relatively well in several indexes of the Brazilian Institute of Geography and Statistics, IBGE)(14).
The Research Ethics Committee of the University of Araraquara - UNIARA approved this study (opinion number, 4129606).
Data were analyzed using JMP SAS version 10.0 (SAS Institute Inc., Cary, NC, USA). Descriptive statistics, including frequency and percentage, were used for data presentation. Kendall tau was used to explore prevalence trends, whereas proportions were compared using the chi-square test of independence. To account for multiple comparisons, the p-value was adjusted using the false discovery rate (FDR) method. Statistical significance was established at p<0.05.
RESULTS
Table 2 and figure 1 show the annual prevalence of myopia in each examination center.
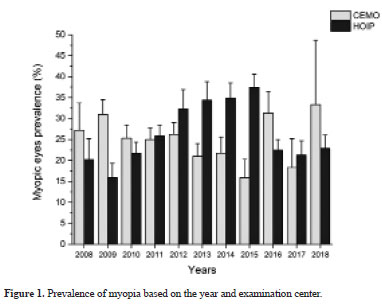
The study period (2008-2018) showed no significant tendency either in the CEMO (Kendall tau=-0.16, p=0.49) or HOIP (Kendall tau=0.34, p=0.14). Moreover, if the entire study period is considered, the examinations performed showed no difference between the CEMO at 25.1% (23.9%-26.3%) and HOIP at 26.6% (25.6%-27.6%) (p=0.06).
Table 3 and figure 2 show the prevalence of myopia in different age groups and examination centers during the study period.
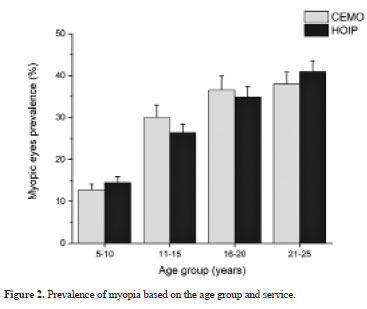
Each examination center showed an association between age group and prevalence of myopia (CEMO, p<0.0001; HOIP, p<0.0001).
Table 4 and figure 3 show the annual prevalence of high myopia in each examination center.
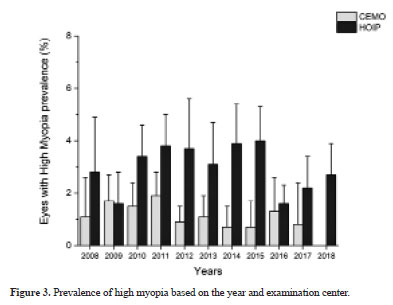
During the study period (2008-2018), the prevalence of high myopia significantly reduced in the CEMO (Kendall tau=-0.50, p=0.0344) but not in the HOIP (Kendall tau=0.04, p=0.88). Considering the entire study period, the prevalence of high myopia was significantly different between CEMO (1.3%, 1.0%-1.6%) and HOIP (3.0%, 2.6-3.4) (p<0.0001).
Table 5 and Figure 4 show the prevalence of high myopia during the study period in different age groups in the examination centers.
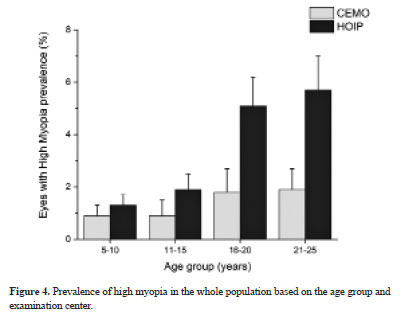
An association was found between the age group and the prevalence of high myopia in both services (CEMO, p=0.0257; HOIP, p<0.0001).
DISCUSSION
The characteristics of the two cities where the examinations were performed slightly reinforced the differences between the studied groups, that is, more socially privileged individuals were expected in the CEMO (Ribeirao Preto) than in the HOIP (Araraquara). The following shows some comparative data between the two municipalities(14), obtained from the Brazilian Institute of Geography and Statistics (IBGE): population in 2022 (Ribeirão Preto: 698,259 people/Araraquara: 242,228 people), schooling in 2010 (Ribeirão Preto: 96.9%/Araraquara: 98.7%), municipal human development index in 2010 (Ribeirão Preto: 0.800/Araraquara: 0.815), infant mortality in 2020 (Ribeirão Preto: 7.12 deaths/1000 live births/Araraquara: 8.91 deaths/1000 live births), gross domestic product per capita in 2020 (Ribeirão Preto: R$ 49,476.86/Araraquara: R$ 44,813.53). Despite comparatively small differences, the data indicate better sanitary and economic characteristics in Ribeirão Preto than in Araraquara, which were the expected conditions of the individuals catered by the CEMO (richer people) than by the HOIP (poorer people).
From an initial analysis of table 1, which presents a general view of the samples, three considerations arise:
a) Although the proportions of men and women were approximately equal in the two cities, the attendance was predominantly female (58.0%), which was more than the proportion of women in the Brazilian population (51.0% in 2010)(14). Other studies also reported such a trend of more women seeking ophthalmological examination(15,16). However, the result was not related to the two different cities of examination, that is, female predominance was almost the same in either the CEMO (56.7%) or the HOIP (58.9%).
Most of the ophthalmological consults may have been motivated by refractive ocular reasons, as indicated by the forewords of two official publications of the Brazilian Council of Ophthalmology concerning ocular refraction: “The ocular refraction is the most required procedure among all others which lead a patient to an ophthalmologist”(17) and “Among the multiple expected actions of an ophthalmologist, the most common is that of the optical prescriptions”(18).
Notwithstanding, we can determine for those seeking ophthalmological examination whether myopia or high myopia was more frequent in women than in men. Our analysis showed that although the prevalence of myopia largely varied yearly either in women (varying between a minimum of 19.3% in 2017 to a maximum of 32.4% in 2014) or men (varying from a minimum of 20.8% in 2009 to a maximum of 33.3% in 2015), the net proportion of myopia as a possible reason for seeking ophthalmological consultation during the study period was approximately coincident in women (1909/7340=26.0%) and men (1377/5324=25.9%). No significant difference was found between the sexes.
Similar findings were also obtained with the prevalence of high myopia in men and women. During the study period, the prevalence varied in women from a minimum of 0.4% (2008) to a maximum of 3.5% (2014), and in men from a minimum of 0.3% (2012) to a maximum of 4.7% (2008). However, the net proportion of high myopia was very close in women (166/7340=2.3%) and men (125/5324=2.3%). No significant difference was found between the sexes.
b) A significant difference was found between examinations at HOIP (57.9%) and CEMO (42.1%). Such a difference is easily explained by most of the Brazilian population not having access to the most privileged type of service, such as that provided by CEMO. Besides, the number of medical doctors and doctor’s offices is greater in HOIP than in CEMO. Socioeconomic and educational levels are deciding factors for accessing medical services, such as those offered by CEMO (private consultations and health insurance). A study in 2019(19) showed that only 16.1% of people with incomplete primary education had access to complementary health, that is, they were not exclusively dependent on the public system. However, this number increased to 67.6% for those with higher education. Regarding per capita household income, among those earning up to one-fourth of the minimum wage, only 3% had access to supplementary health, which increased to 88% for those earning more than fivefold of the minimum wage.
c) The examinations were more frequent in the youngest age group (39.3% between 5 and 10 years), decreased in the adolescent groups (22.3% for the 11-15-year-old group and 18.6% for the 16-20-year-old group), and slightly increased in the eldest group (19.8% for the 21-25-year-old group). This is a logical result because we expect that ophthalmological consultations were more required for the youngest age group (children) due to requirements of their respective school enrollment, the occurrence of possible visual difficulties, or simple preventive precautions taken by their parents. Incidentally, although requirements for refractive attendance progressively decreased in subjects examined at the HOIP, consultations hypothetically increased for the oldest age group at the CEMO. This may be due to this group being found more in Ribeirão Preto, where several schools of superior educational levels attract students of such age group from other neighboring cities. In addition, a 2010 study(20) showed that the demand for ophthalmological care was higher in the age group between 10 and 19 years old (16.7%) compared with the age group between 0 and 9 years old (13.2%).
Table 2 and Figure 1 present the prevalence of myopia during the different years of the study. Notably, the prevalence of myopia mainly increased between 2010 and 2015, but such a tendency was reverted in the last triennial of the study (2016-2018), and the values were relative to the initial triennial (2008-2010) return. Several interesting significant differences were found between the proportion of myopia at the CEMO and HOIP, but the values float. Sometimes, the proportion was greater at the CEMO, but the proportion was significantly greater at the HOIP at other times. Myopia was observed in the CEMO and HOIP at 25.1% and 26.6% of the study population, with no significant difference between them. Therefore, the relative proportion of myopia in the examined population from 2008 to 2018 either at the CEMO or HOIP did not show a specific tendency and float between 15.9% (HOIP, 2009 and CEMO, 2015) and 37.4% (HOIP. 2015). Notably, the maximum attendance at HOIP and minimum attendance at CEMO were observed in 2015.
The study period coincided with the progressively “explosive” use of smartphones, questioning the assumption that such use should increase myopia and/or its prevalence.
Table 3 and Figure 2 show that the prevalence of myopia increases as age increases, and the difference was statistically significant between the two groups, which was consistent with other studies(10). However, such an increase was approximately the same when the CEMO and HOIP were compared.
Table 4 and Figure 3 show the data for high myopia found in different years of the study. Interestingly, short “cycles” of variation of the prevalence of high myopia may be depicted over the successive years. Thus, a graph with a knurled line is suggested. The maximum and minimum prevalence of high myopia in CEMO was 1.9% (2011) and 0% (2018), respectively, whereas those in HOIP were 4.0% (2015) and 1.6% (2009 and 2016), respectively. The general proportion of high myopia at CEMO (1.3%) and HOIP (3.0%) was significantly different. This may be due to the HOIP being an acknowledged place for ophthalmological consults related to retinal affections, and the results might be biased by an increased reference of eyes presenting high myopic values because since high myopia is related to vitreous and retinal detachments.
Table 5 and Figure 4 show the relationship between high myopia and age group. The proportion of high myopia was directly related to the age group. However, the progression is limited to the first three age groups because the last two presented the same results.
Table 5 and Figure 4 show the relationship between high myopia and age group to the examination center. Although the prevalence of high myopia was always greater at HOIP, a statistically significant difference was found only for the older groups (16-20 and 21-25 years). Thus, this may have occurred due to the HOIP being a regional reference for the treatment, diagnosis, and prevention of retinal problems. Similarly, the older the patient, the greater such a referential directing.
During the study period, the prevalence of myopia or high myopia did not increase. Such prevalence showed a random pattern in both services during the study period. The mean prevalence of myopia in the study period was similar in the private and public services; however, the mean prevalence of high myopia during the study period was higher in the public service.
AUTHORS’ CONTRIBUTION:
Significant contribution to conception and design: André Augusto Homsi Jorge, Harley Edison Amaral Bicas. Data acquisition: André Augusto Homsi Jorge, Bruno Henrique Silva, João A. de Paula Filho, Graziela Boschetti, Marina Rodrigues de Sunti, Renata Júlia de Moura. Data analysis and interpretation: André Augusto Homsi Jorge, Harley Edison Amaral Bicas, Bruno Henrique Silva, João A. de Paula Filho, Graziela Boschetti, Marina Rodrigues de Sunti, Renata Júlia de Moura. Manuscript drafting: André Augusto Homsi Jorge. Significant intellectual content revision of the manuscript: André Augusto Homsi Jorge, Harley Edison Amaral Bicas. Final approval of the submitted manuscript: André Augusto Homsi Jorge, Harley Edison Amaral Bicas, Bruno Henrique Silva, João A. de Paula Filho, Graziela Boschetti, Marina Rodrigues de Sunti, Renata Júlia de Moura. Statistical analysis: André Augusto Homsi Jorge, Harley Edison Amaral Bicas. Obtaining funding: not applicable . Supervision of administrative, technical, or material support: André Augusto Homsi Jorge, Harley Edison Amaral Bicas. Research group leadership: André Augusto Homsi Jorge.
REFERENCES
1. Jones LA, Sinnott LT, Mutti DO, Mitchell GL, Moeschberger ML, Zadnik K. Parental history of myopia, sports and outdoor activities, and future myopia. Invest Ophthalmol Vis Sci. 2007;48(8):3524-32.
2. Li J, Zhang Q. Insight into the molecular genetics of myopia. Mol Vis. 2017;23:1048-80.
3. Cai XB, Shen SR, Chen DF, Zhang Q, Jin ZB. An overview of myopia genetics. Exp Eye Res. 2019;188:107778.
4. Wu PC, Tsai CL, Wu HL, Yang YH, Kuo HK. Outdoor activity during class recess reduces myopia onset and progression in school children. Ophthalmology. 2013;120(5):1080-5.
5. Hysi PG, Choquet H, Khawaja AP, Wojciechowski R, Tedja MS, Yin J; Consortium for Refractive Error and Myopia; UK Eye and Vision Consortium; 23andMe Inc. Meta-analysis of 542,934 subjects of European ancestry identifies new genes and mechanisms predisposing to refractive error and myopia. Nat Genet. 2020;52(4):401-7.
6. Holden BA, Wilson DA, Jong M, Sankaridurg P, Fricke TR, Smith EL 3rd, et al. Myopia: a growing global problem with sight-threatening complications. Community Eye Health. 2015;28(90):35.
7. Lin LL, Shih YF, Hsiao CK, Chen CJ. Prevalence of myopia in Taiwanese schoolchildren: 1983 to 2000. Ann Acad Med Singap. 2004;33(1):27-33.
8. Wang TJ, Chiang TH, Wang TH, Lin LL, Shih YF. Changes of the ocular refraction among freshmen in National Taiwan University between 1988 and 2005. Eye (Lond). 2009;23(5):1168-9.
9. Jung SK, Lee JH, Kakizaki H, Jee D. Prevalence of myopia and its association with body stature and educational level in 19-year-old male conscripts in Seoul, South Korea. Invest Ophthalmol Vis Sci. 2012;53(9):5579-83.
10. Vitale S, Sperduto RD, Ferris FL 3rd. Increased prevalence of myopia in the United States between 1971-1972 and 1999-2004. Arch Ophthalmol. 2009;127(12):1632-9.
11. Vilar MM, Abrahão MM, Mendanha DB, Campos LM, Dalia ERC, Teixeira LP, et al. Aumento da prevalência de myopia em um serviço de referência em Goiânia - Goiás. Rev Bras Oftalmol. 2016;75(5):356-9.
12. Ferraz FH. Perfil de distribuição de erros refracionais no sul do centro-oeste do estado de São Paulo e seu impacto na acuidade visual: estudo de base populacional. -. 2013. 193 f. (tese). Botucatu: Universidade Estadual Paulista Julio de Mesquita Filho, Faculdade de Medicina de Botucatu; 2013. Disponível em: http://hdl.handle.net/11449/105628
13. Avila M, Alves MR, Nishi M. As condições de saúde ocular no Brasil. [citado 2016 Jul 10]. Disponível em: http://www.cbo.net.br/novo/publicacoes/Condicoes_saude_ocular_IV.pdf
14. Instituto Brasileiro de Geografia e Estatística (IBGE). Cidades e estados. Brasília (DF): IBGE; sd. Disponível em: www.ibge.gov.br/cidades-e-estados
15. Figueiredo W. Assistência à saúde dos homens: um desafio para os serviços de atenção primária. Cienc Saude Colet. 2005;10(1):105-9.
16. Gomes R, Nascimento EF, AraújoFC. Por que os homens buscam menos os serviços de saúde do que as mulheres? As explicações de homens com baixa escolaridade e homens com ensino superior. Cad Saúde Pública. 2007; 23(3):565-74.
17. Bicas HE, Alves AA, Uras R. Refratometria ocular. Rio de Janeiro: Cultura Médica: Prefácio.
18. Bicas HE, Alves MR. Refratometria ocular e visão subnormal. 4a ed. Rio de Janeiro: Cultura Médica; 2018. Prefácio. [CBO - Serie Oftalmmologia Brasileira].
19. Souza Júnior PR, Szwarcwald CL, Damacena GN, Stopa SR, Vieira ML, Almeida WS, et al. Cobertura de plano de saúde no Brasil: análise dos dados da Pesquisa Nacional de Saúde 2013 e 2019. Ciênc. Saúde Colet (Barueri). 2021;26 Suppl 1:2529-41.
20. Vargas MA, Rodrigues ML. Perfil da demanda em um serviço de oftalmologia de atenção primária. Rev Bras Oftalmol. 2010; 69(2):77-83.
Submitted for publication:
November 21, 2022.
Accepted for publication:
March 1, 2024.
Approved by the following research ethics committee: Universidade de Araraquara - UNIARA (CAAE: 30948920.3.0000.5383).
Funding: This study received no specific financial support.
Disclosure of potential conflicts of interest: None of the authors have any potential conflicts of interest to disclose.