INTRODUCTION
Obesity is a life-threatening accumulation of abnormal or excessive amounts of fat in the body. Individuals with a body mass index (BMI) over 30 kg/m2 are classified as obese(1). Epidemiological studies have shown that 10% of the adult population of the world is obese(2). Obesity is a systemic pathology that affects many organs, and various chronic diseases (cardiovascular diseases, diabetes mellitus, and musculoskeletal disorders) are associated with obesity(3,4).
Few studies have focused on the ophthalmic effects of obesity. Many previous studies have investigated the correlation between obesity and diabetic retinopathy, cataract, age-related maculopathy, and glaucoma(5-8). However, the effects of obesity on retrobulbar blood flow have not been investigated by color Doppler ultrasound (CDU) to date.
Nowadays, CDU is an important method for evaluating hemodynamic alterations in retrobulbar vascular structures because it is non-invasive, quick, does not require drug therapy, and has reliable and reproducible outcomes(9,10).
Our aim was to evaluate intraocular pressure (IOP) using a tonometry device and study the extraocular orbital vessels with CDU to investigate the effects of obesity on retrobulbar blood flow.
METHODS
Study design
From September 2014 to September 2015, 31 obese patients with a mean BMI of 50.39 kg/m2 admitted to general surgery clinic to undergo bariatric surgery were recruited into the study. Twenty-eight healthy controls with a BMI of 18.5 kg/m2 to 24.9 kg/m2 were included in the study. Those with known retinal vascular diseases, a history of macular degeneration, or prior ophthalmologic surgery were excluded from the study. We only included white individuals in the present study because retrobulbar flow is likely influenced by ethnicity(11).
Body mass index calculation
To determine the BMI of the obese patients and control subjects, each individual's body mass (kg) was divided by the square of their height (m2). According to the World Health Organization Classification, BMI values between 18.5 kg/m2 and 24.9 kg/m2 indicate a normal weight, whereas BMI values above 30 kg/m2 are considered as obesity.
Ophthalmologic imaging
All individuals underwent visual acuity tests using a Snellen chart, biomicroscopic examination of the anterior segment, and in direct biomicroscopic examination to evaluate the posterior segment following pupil dilation. IOP was measured with a Goldmann appla nation tonometer (Nikon, Tokyo, Japan). All measurements were performed between 09:00 AM and 12:00 AM by the same ophthalmologist, and the mean of three successive measurements was calculated. Ocular blood flow and IOP measurements were performed on the same day.
Optical coherence tomography (OCT) imaging was performed on all individuals by spectral domain OCT (SD-OCT) imaging using a Cirrus HD-OCT (Carl Zeiss Meditec, Inc., Dublin, CA, USA)(11). On SD-OCT examination, the optic disc area, optic rim area, cupping area, and vertical and horizontal cup/disc (C/D) ratio were measured, and both disc symmetries were evaluated. Those with a C/D ratio over 0.5 and significant loss in visual field were excluded from the study.
Systemic diseases
Obese individuals are predisposed to comorbidities that can in terfere with retrobulbar hemodynamics, such as diabetes mellitus with or without diabetic eye complications and arterial hypertension(12-14). Therefore, from those co-morbidities, all individuals were screened for abnormal values of glycated hemoglobin (Hba1c) and blood pressure (brachial arterial pressure or BAP). HbA1c levels reflect the mean glucose concentration over the previous 8-12 weeks. The cutoff level for Hba1c was 42 mmol/mol (6%), and individuals with a higher Hba1c than 6% were considered to have impaired glucose regulation (tolerance or diabetes mellitus) and therefore excluded from the study (n=2). Since intergroup differences in blood pressure may affect ocular blood flow, we tried to keep the systolic and diastolic blood pressures of the obese and control groups within the same range. The blood pressure measurements were taken at the primary care center where their family physicians work. They were followed up for 1 week, and their blood pressure was measured twice daily at 9 am and 6 pm. Those with a higher systolic pressure than 140 mmHg and a higher diastolic pressure than 90 mmHg were considered hypertensive, and thus excluded from the study (n=3). Two participants had both elevated blood pressure and Hba1c levels. A total of 10 patients with possible diabetes, hypertension, and elevated cup/disk ratio were thus excluded from the study, and consequently, 59 of 69 patients were included in the study.
Ocular color doppler ultrasonography
All cases were examined in our Radiology Department using a HI VISION Preirus (Hitachi, Tokyo, Japan) CDU device. CDU examination was performed with the patients lying in the supine position and their eyes closed; the paraocular technique was used. All radiological examinations were performed by the same radiologist (B.C.). With the eyes closed, methyl cellulose was applied on the eyelids, and B-mode ultrasonography was performed using a (5-13 MHz) linear probe without compressing the eyelids. Following the gray-scale examination, CDU was performed. We took special care not to exert pressure on the eye globe with the ultrasound probe.
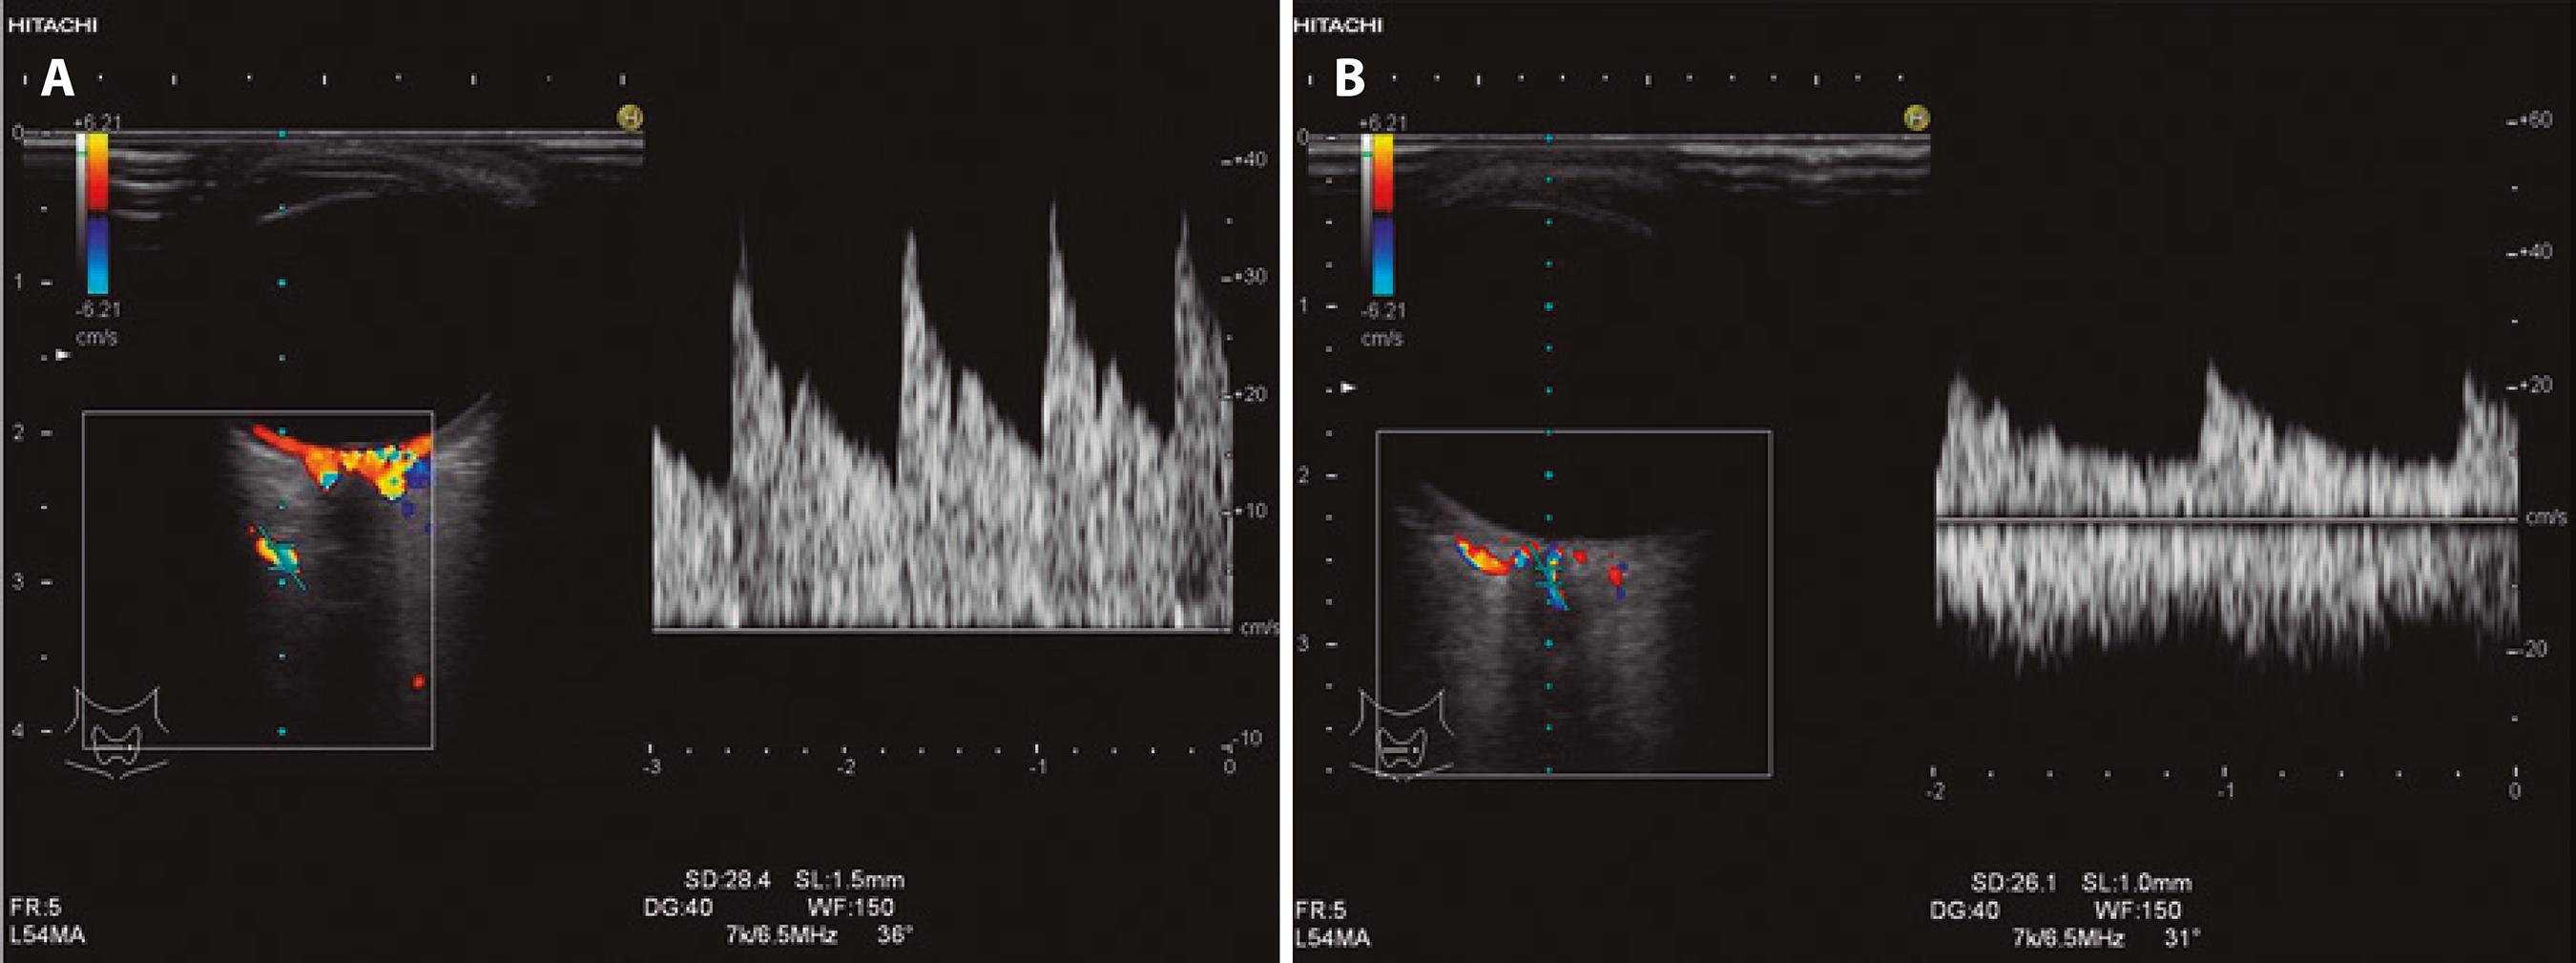
The eye was examined in transaxial, sagittal, and oblique sections. Intraocular, retrobulbar, and intraorbital anatomical structures were assessed by gray-scale ultrasonography, and the retrobulbar vessels were then examined using CDU. The patient was asked to look in the contralateral direction to allow the ophthalmologist to trace the retrobulbar course of the ophthalmic artery (OA). The OA is located approximately 20 mm posterior to the globe, below or above the optic nerve, and the central retinal artery (CRA) is found approximately 10 mm from the optic nerve in the retrolaminar region. The scanning angle is easily corrected in this region because the vein follows a straight course. The angle of the cursor was kept parallel to the blood flow at all times, at between 30° and 60°. The Doppler sample volume was 1.5 mm for the OA and 1 mm for the CRA depending on the diameter of the examined artery.
We did not perform CDU evaluation of the short posterior ciliary arteries (SPCAs) in this study because of the small size and extreme tortuousness of these vessels, which result in low reliability of any angle correction. Further, SPCAs cannot be measured individually by CDU. The anatomy of these vessels is highly variable between different individuals and both anastomoses and narrowing are common(15,16); therefore, we did not include CDU evaluation of SPCAs. We standardized the Doppler parameters for all individuals as follows: Doppler wall filter=150 Hz; Doppler gain=400; pulse repetition frequency=7k/6.5 MHz.
Peak systolic velocity (PSV), end-diastolic velocity (EDV), pulsatility index (PI=[PSV-EDV]/mean velocity), and resistive index (RI=[PSV-EDV]/PSV) were measured in all studied arteries. Time-ve locity waveforms of the OA and CRA are shown in figure 1 A and 1 B, respectively.
Statistical analysis
Data were analyzed using the Statistical Package for the Social Sciences (version 18.0 for Windows; SPSS Inc., Chicago, IL, USA). Continuous variables are presented as the mean and standard deviation, and categorical variables as percentages and frequency distribution. Normality testing was performed using the Kolmogorov-Smirnov and Shapiro-Wilk tests. Comparison of continuous variables between independent groups was performed using Student's t -test and the Mann-Whitney U test, and comparison of categorical data was performed using the chi-square test. Correlation coefficients (Pearson's r) and stepwise multiple linear regression were used to determine the relationships between variables. A P value of p<0.05 was considered statistically significant.
RESULTS
Our study included 31 obese patients (23 female, 8 male) and 28 controls (17 female, 11 male). The mean ages were 33.46 ± 7.83 years for the control group and 37.80 ± 10.0 years for the obese group. The mean BMI values were 23.33 ± 1.66 kg/m2 in the control group and 50.39 ± 8.3 kg/m2 in the obese group. The mean IOPs were 18 ± 6.68 mmHg in the obese group and 13.71 ± 1.60 mmHg in the control group. Therefore, the mean IOP was significantly higher in the obese group than in the control group (p<0.001) (Table 1).
Table 1 Comparison of all variables between the obese and normal groups
| Variable | Normal group (n=28) | Obese group (n=31) | P value |
|---|---|---|---|
| Age (years ± SD) | 33.46 ± 7.80 | 37.80 ± 10.00 | 0.0780* |
| Gender (M/F) | 11/17 | 8/23 | 0.2040** |
| BMI (kg/m2 ± SD) | 23.33 ± 1.60 | 50.39 ± 8.30 | 0.0010* |
| CRA RI | 0.56 ± 0.07 | 0.53 ± 0.09 | 0.1820 |
| CRA PI | 1.22 ± 0.20 | 0.95 ± 0.22 | 0.0010 |
| CRA PSV (cm/s) | 13.25 ± 20.71 | 12.86 ± 30.24 | 0.6220 |
| CRA EDV (cm/s) | 4.81 ± 1.57 | 4.84 ± 1.57 | 0.7380* |
| OA RI | 0.59 ± 0.07 | 0.61 ± 0.08 | 0.3300* |
| OA PI | 1.17 ± 0.20 | 1.07 ± 0.34 | 0.1930 |
| OA PSV (cm/s) | 34.78 ± 11.35 | 23.99 ± 8.84 | 0.0000* |
| OA EDV (cm/s) | 11.87 ± 4.79 | 8.85 ± 4.55 | 0.0060 |
| IOP (mmHg) | 13.71 ± 1.60 | 18.00 ± 6.68 | 0.0010 |
*Mann-Whitney U test;
**Chi-square test.
Figure 2 shows a correlation between BMI and IOP (Pearson correlation test: p<0.001, r =0.658). When the CRA values were compared between the groups, PI was found to be significantly lower in the obese group than in the control group (p<0.001). Significant differences were not found between the obese and control groups regarding the CRA, RI, PSV, or EDV values (Table 1). Figure 3 shows a negative correlation between BMI and CRA PI (Pearson correlation test: p=0.002, r =-0.385). When the OA values were compared between the two groups, the PSV (p<0.001) and EDV (p=0.002) values were found to be significantly lower in the obese group than in the control group, whereas the RI and PI values of the obese and control groups were not significantly different (Table 1). Figure 4 shows a ne gative correlation between BMI and OA PSV (Pearson correlation test: p<0.001, r =-0.484), and figure 5 shows a negative correlation between BMI and OA EDV (Pearson correlation test: p=0.005, r =-0.385).
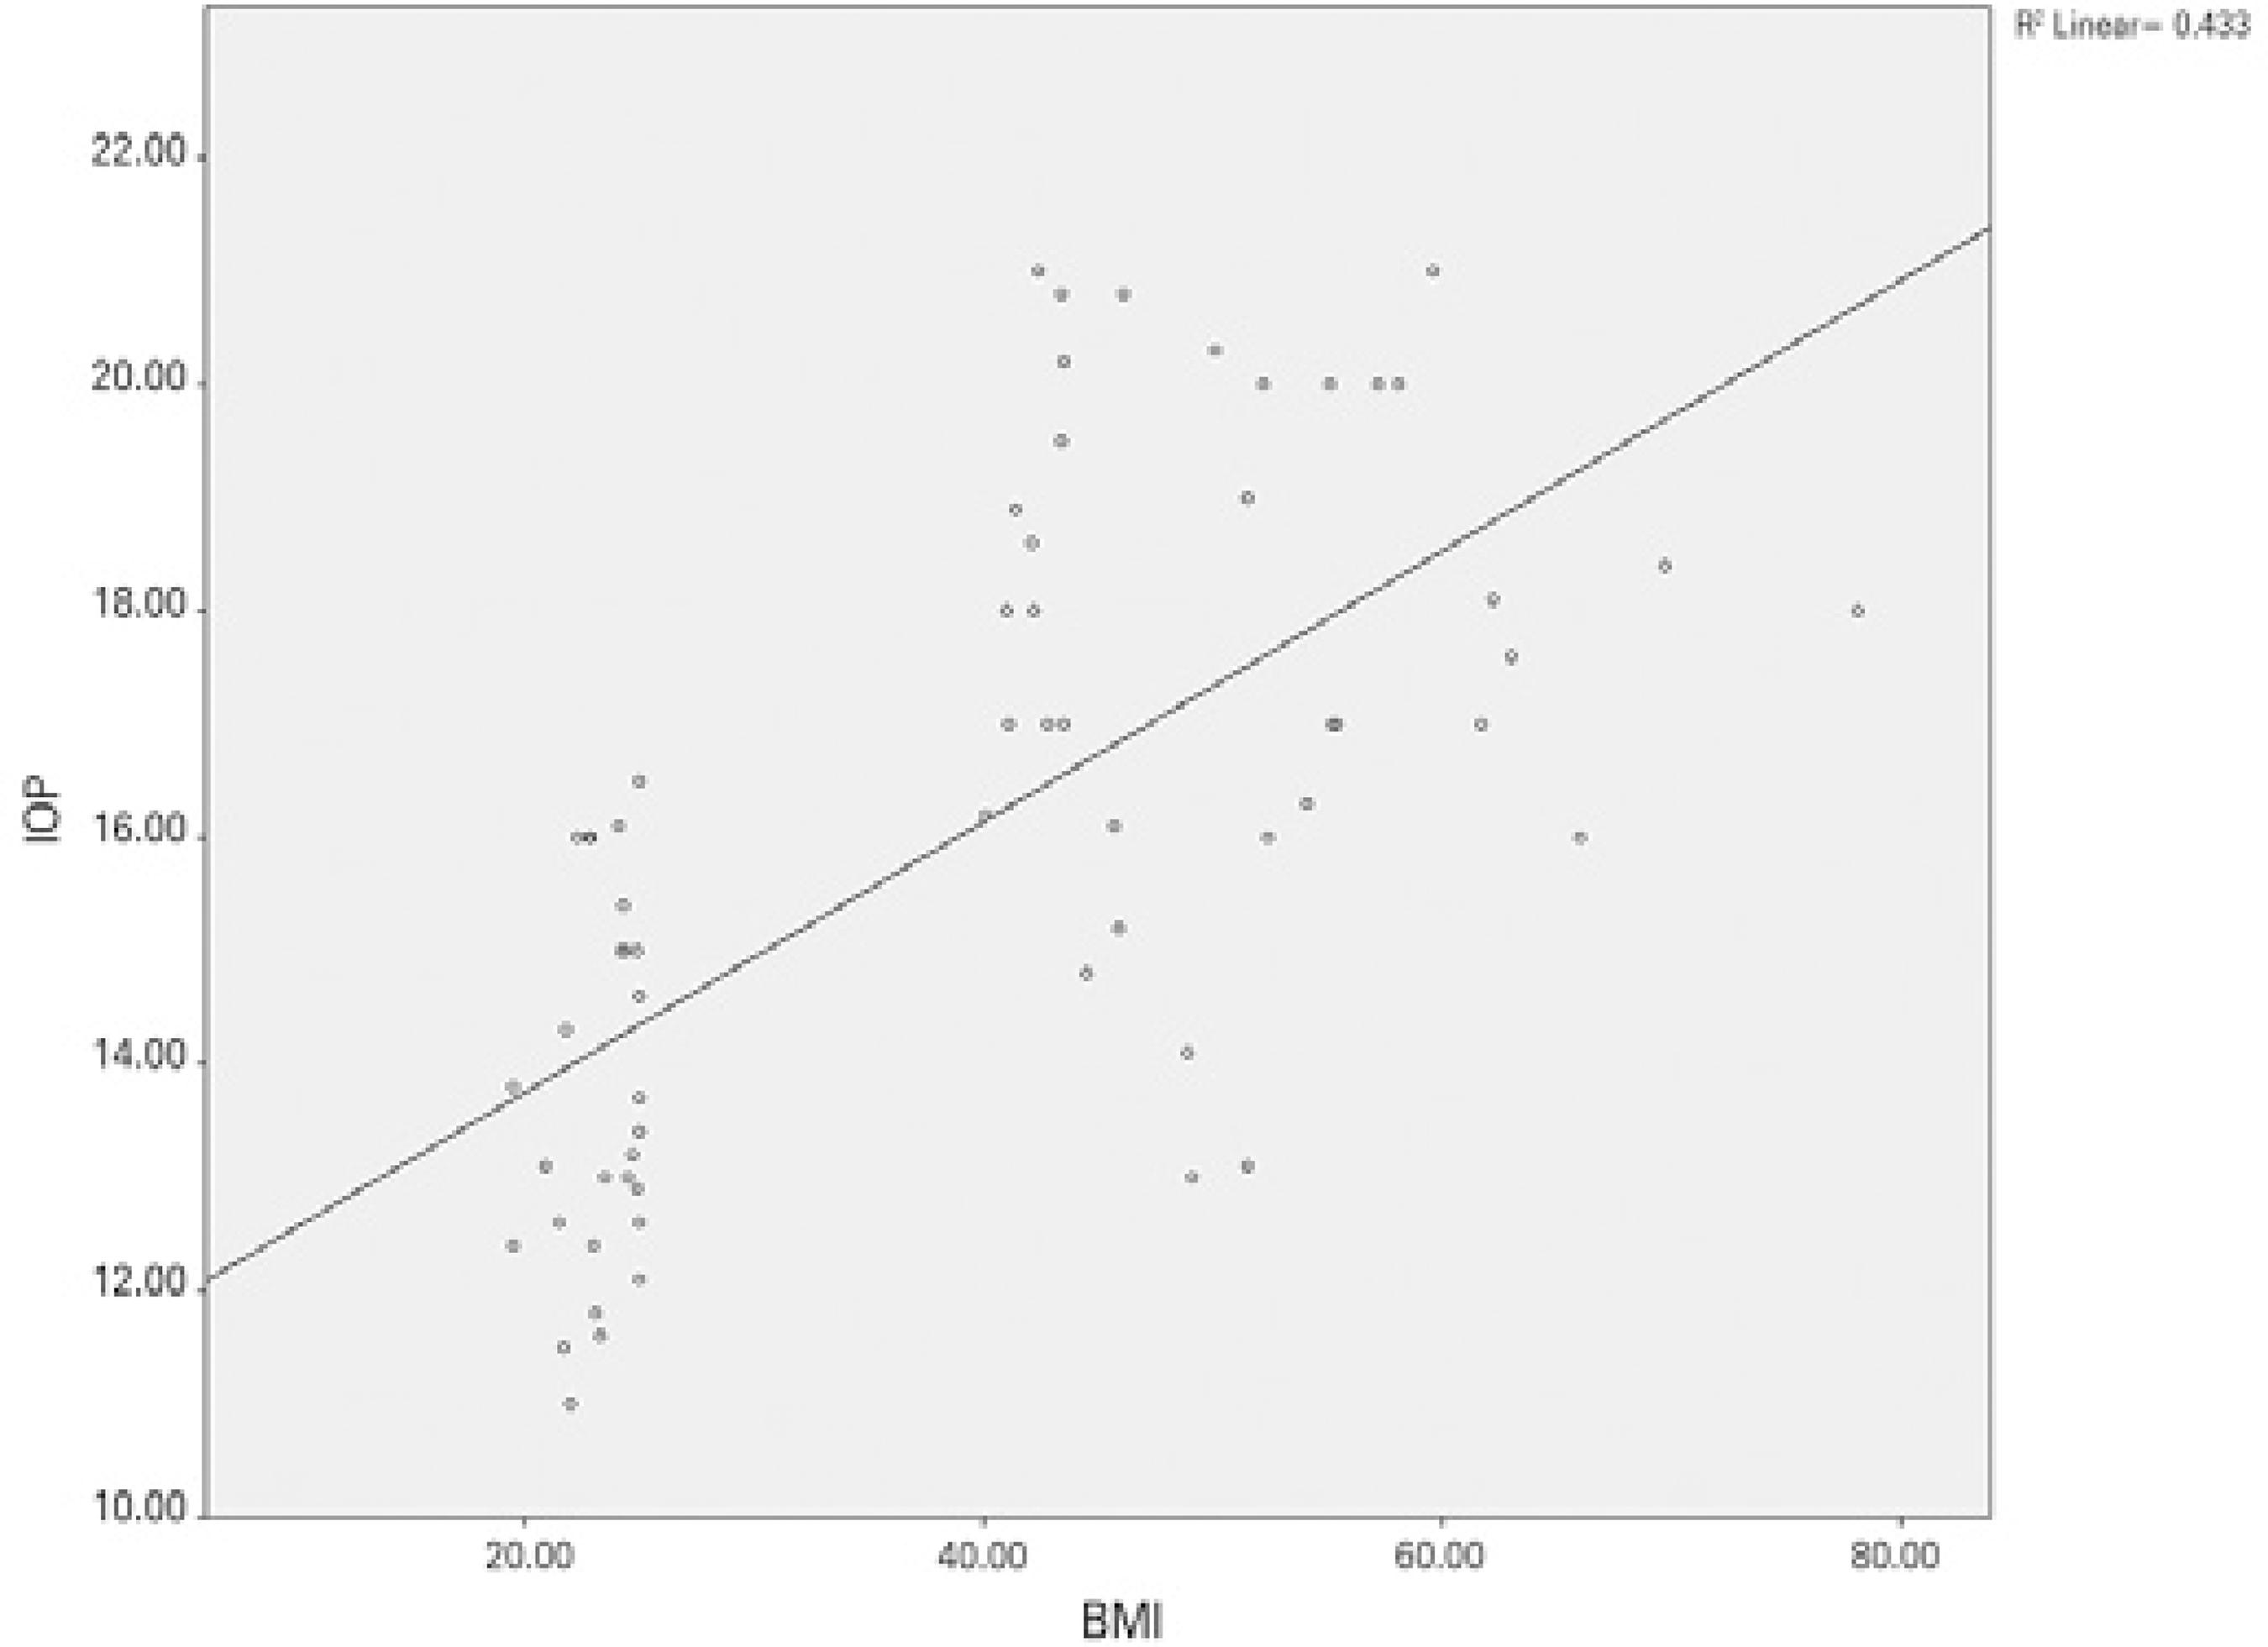
Figure 2 Positive correlation between body mass index and intraocular pressure (Pearson correlation test: p<0.001, r =0.658).
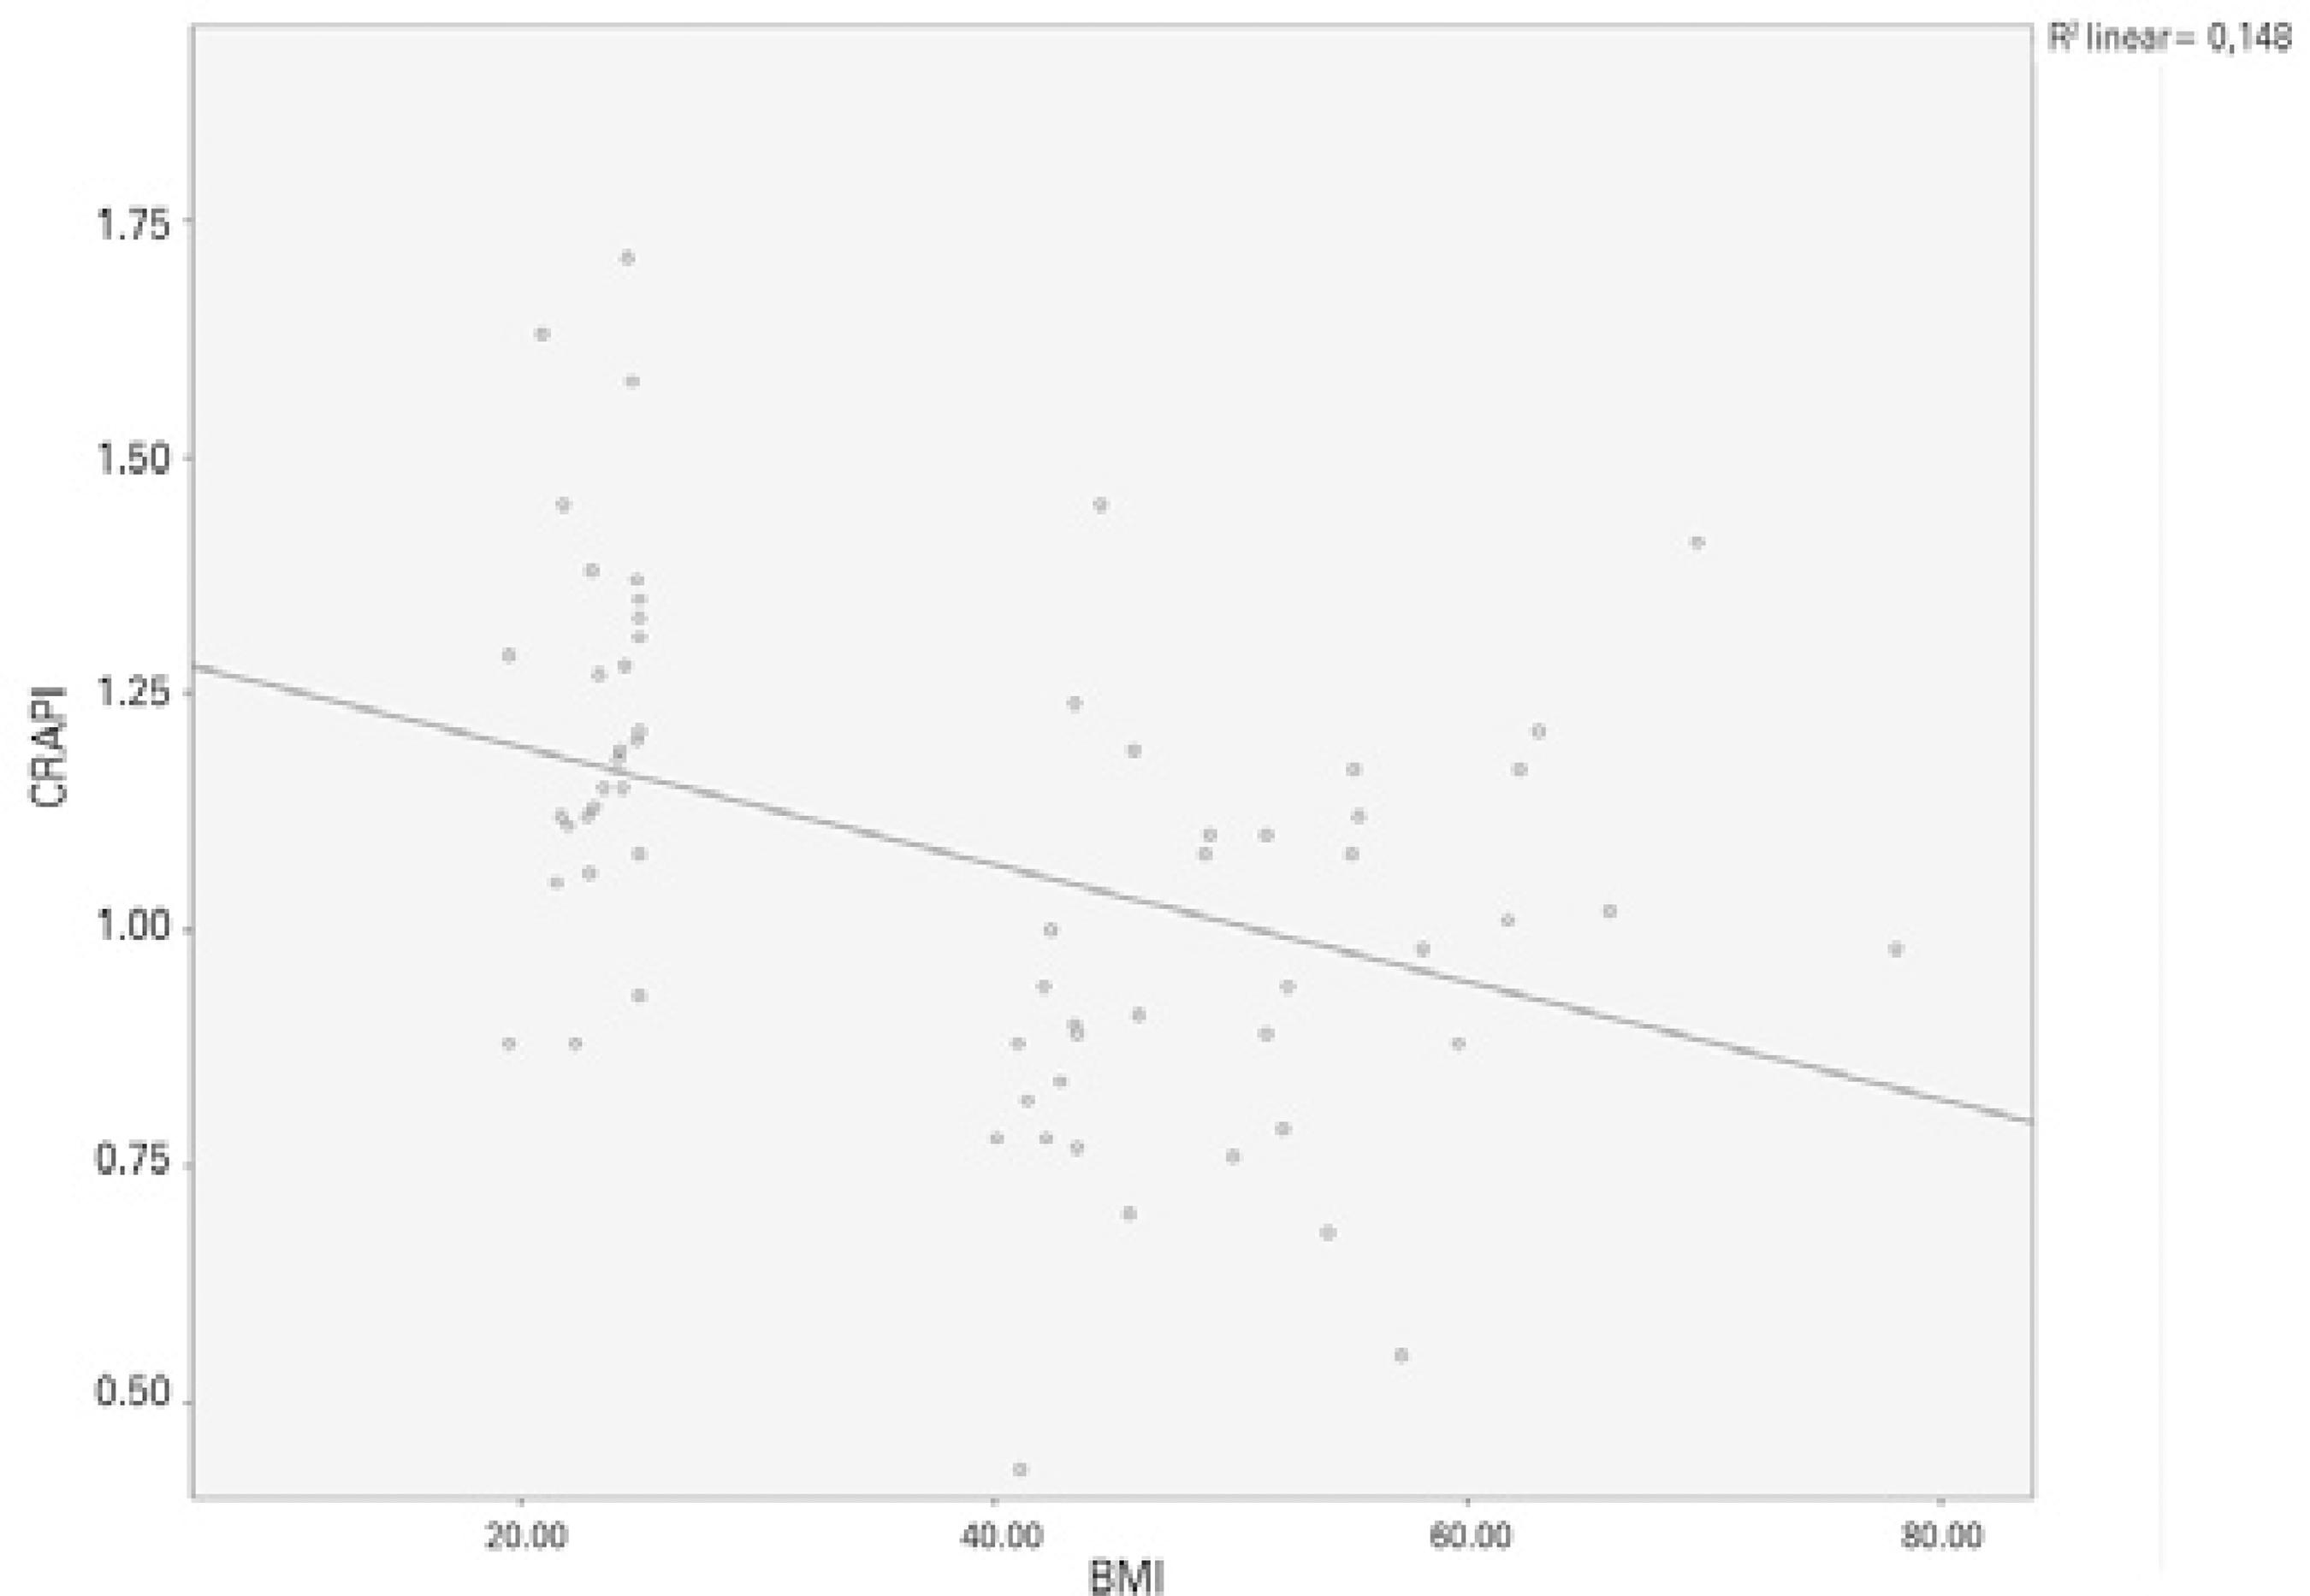
Figure 3 Negative correlation between body mass index and CRA PI (Pearson correlation test: p=0.002, r =-0.385).
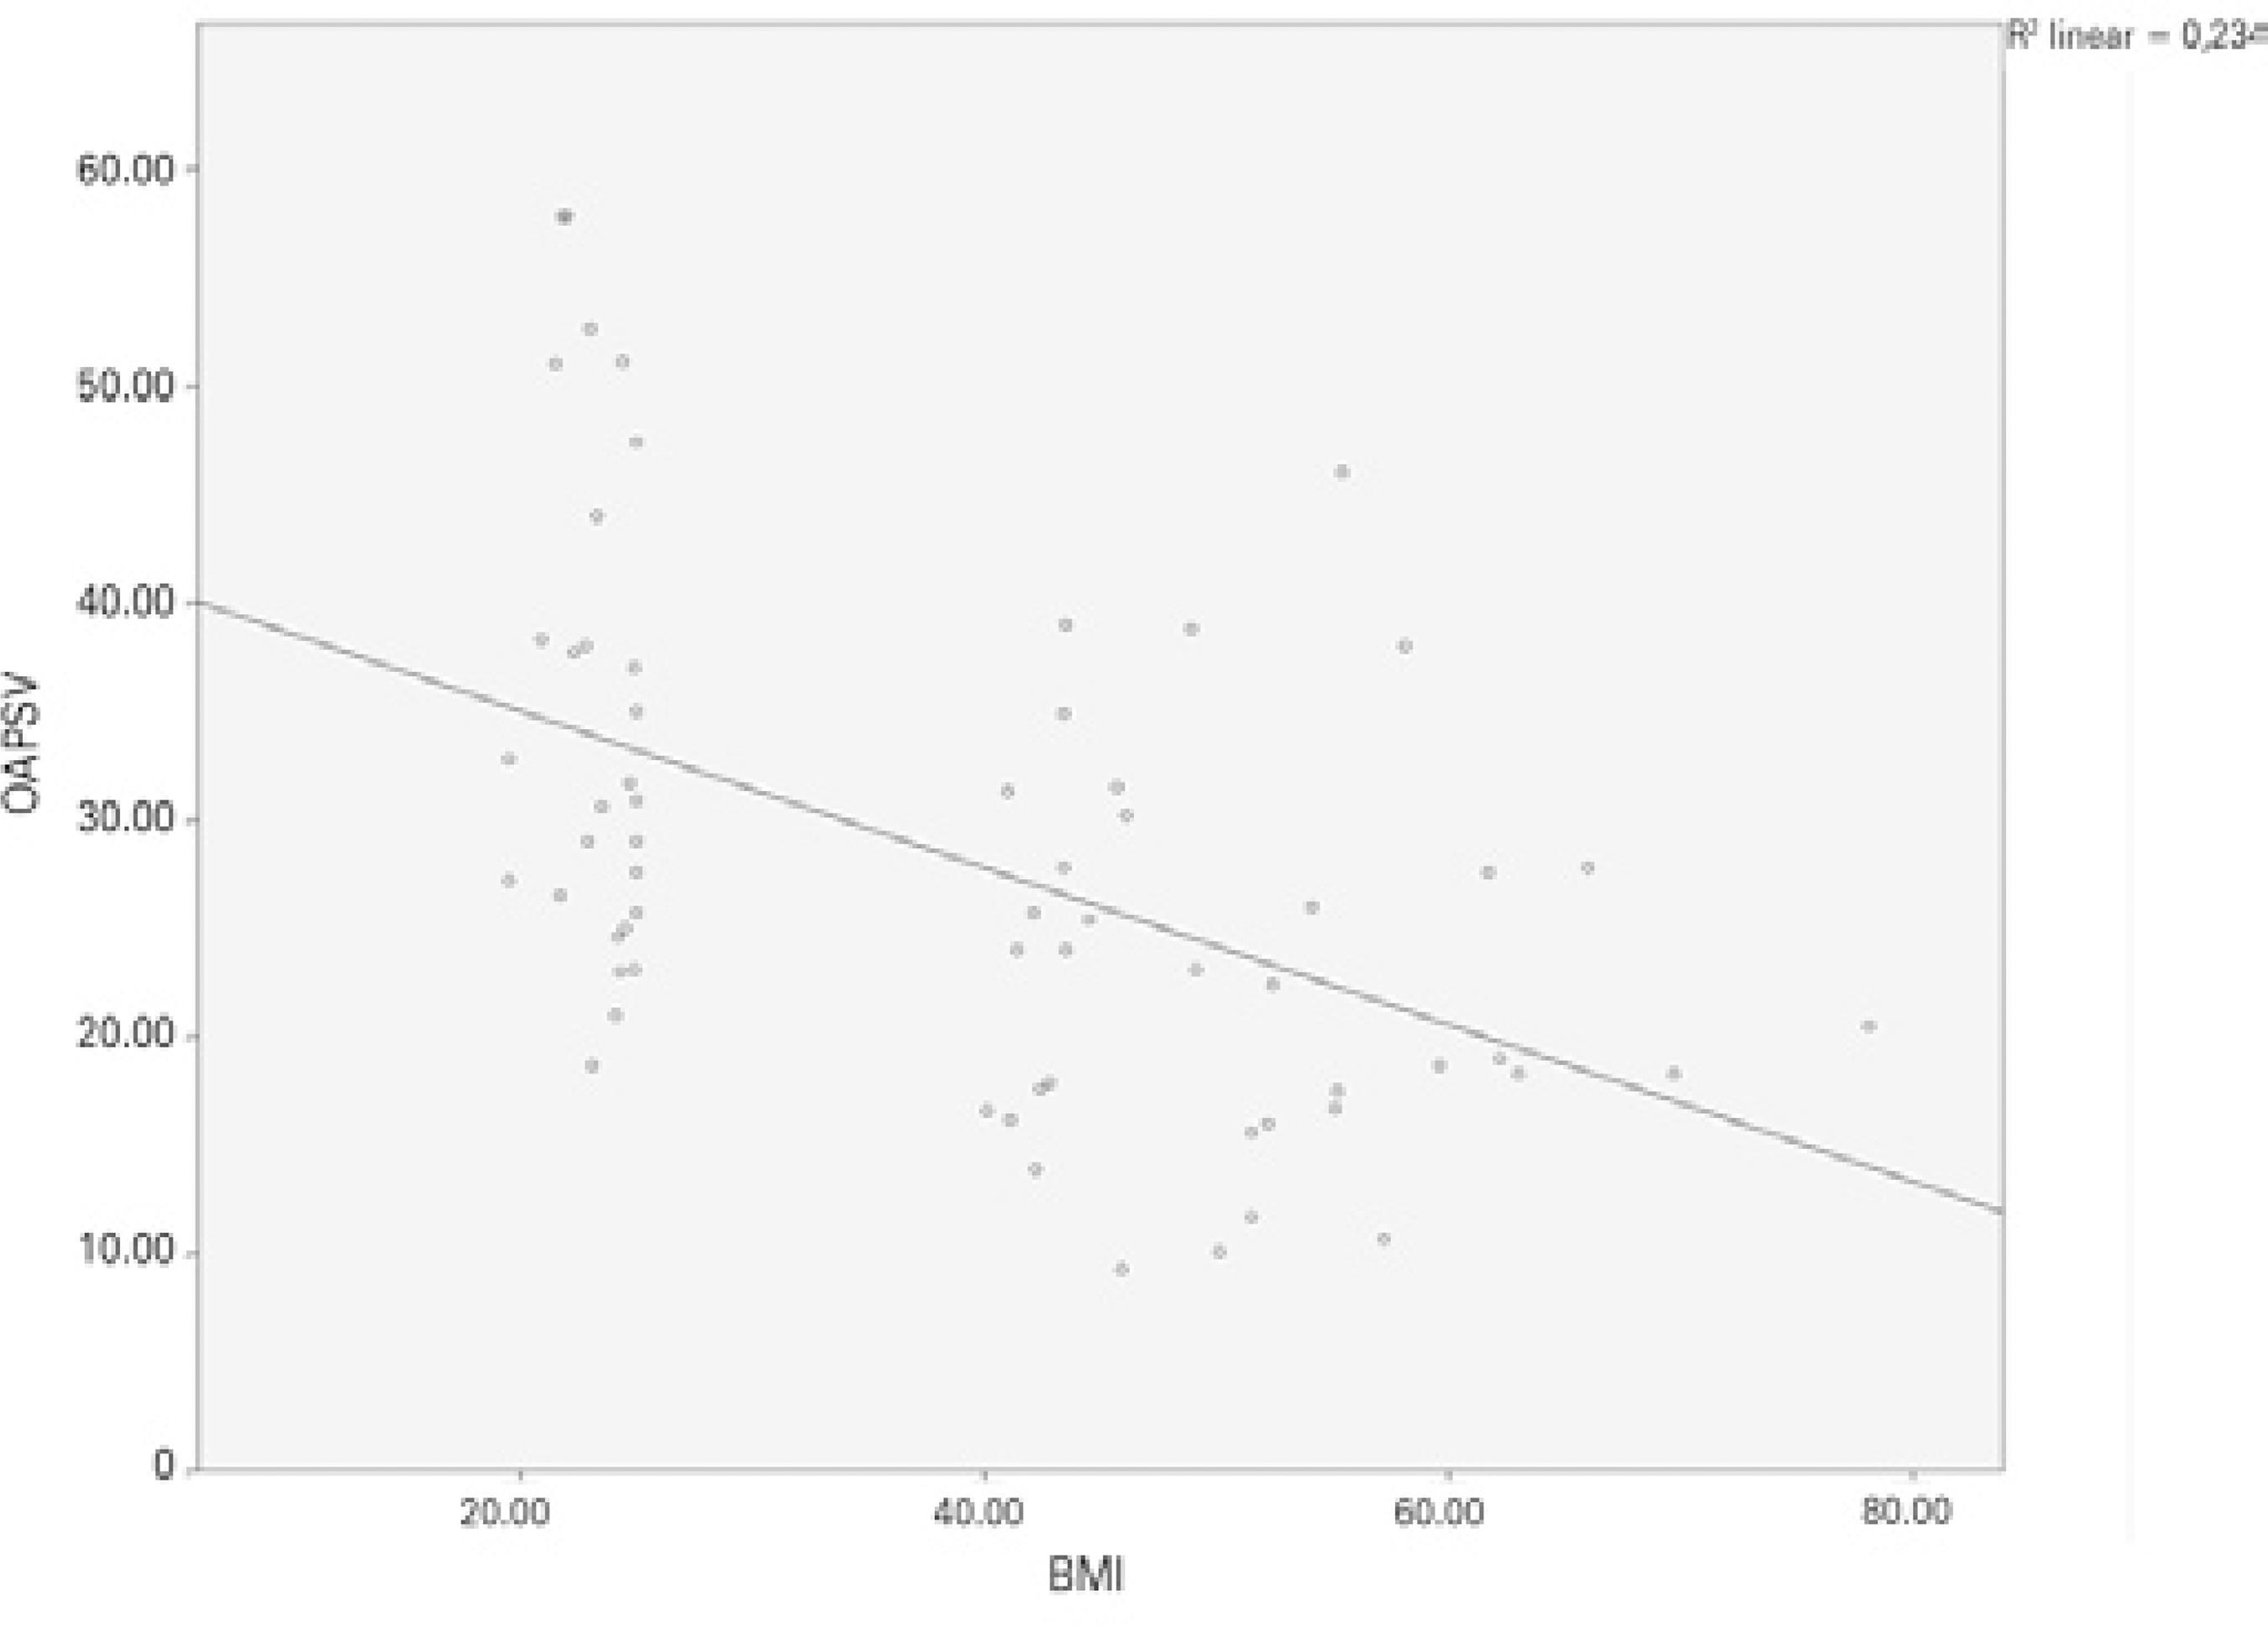
Figure 4 Negative correlation between body mass index and OA PSV (Pearson corre lation test: p<0.001, r =-0.484).
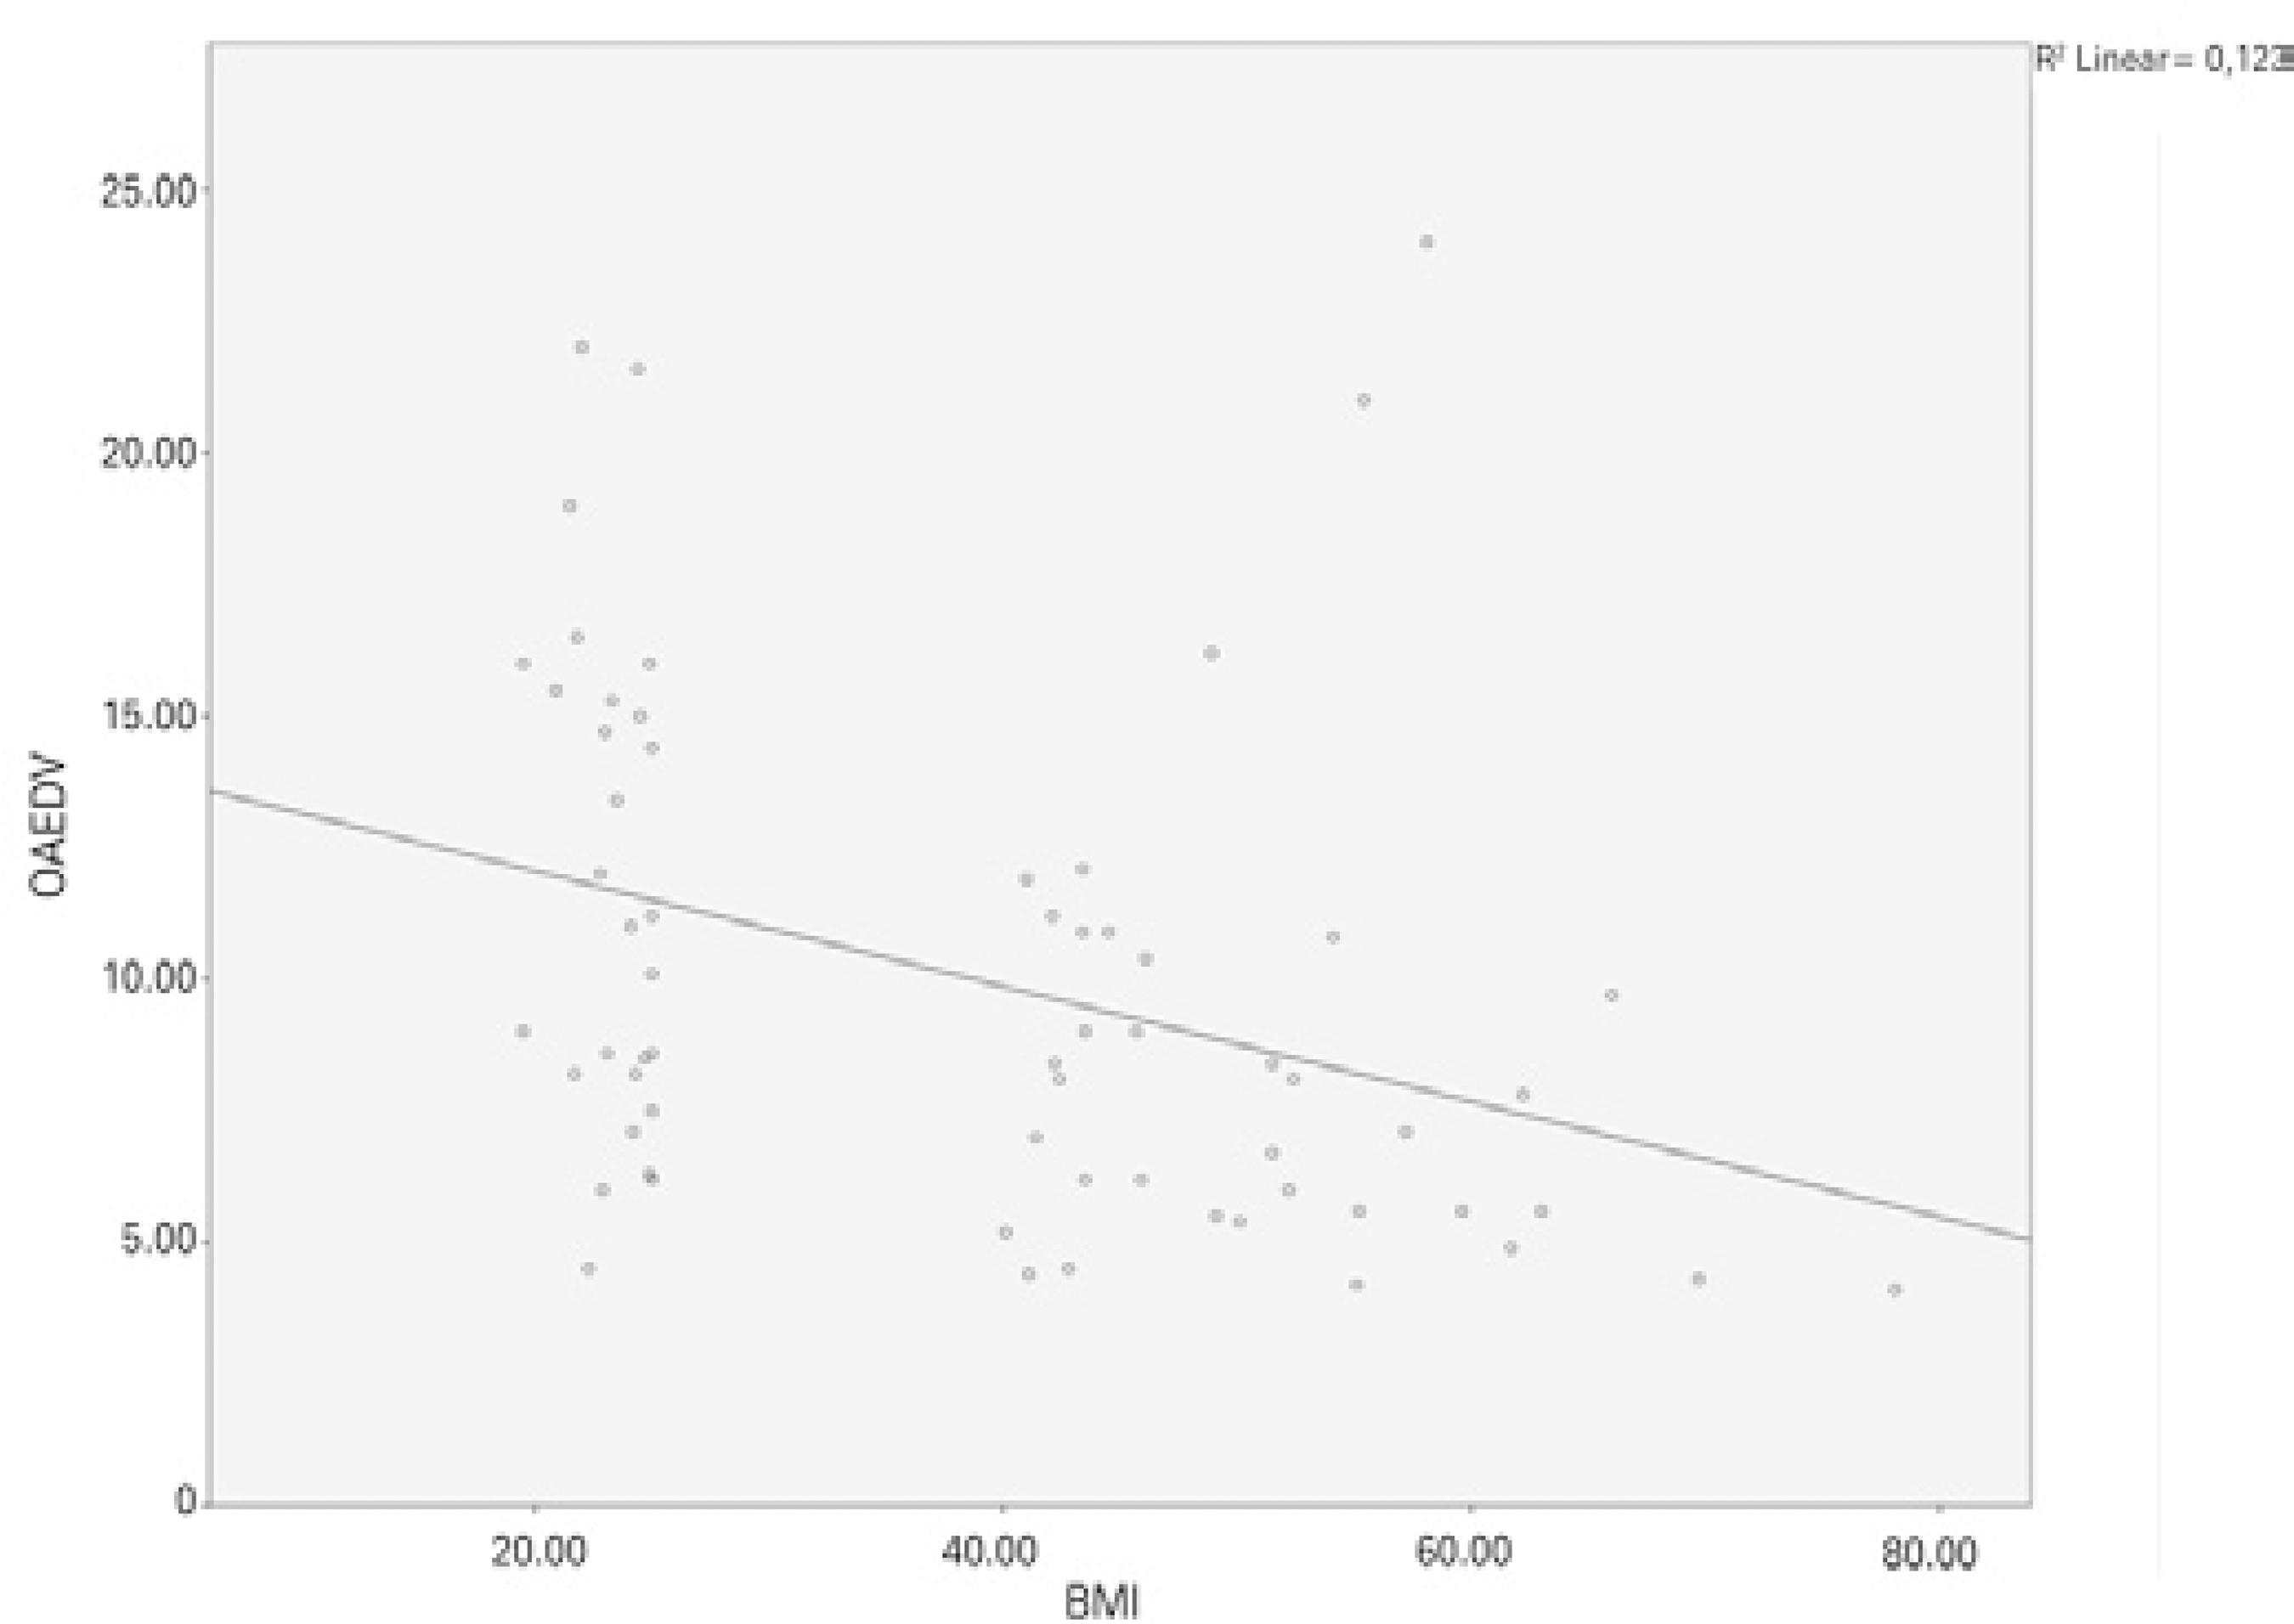
Figure 5 Negative correlation between body mass index and OA EDV (Pearson correla tion test: p=0.005, r =-0.385).
The OA and CRA parameters, IOP with the age, sex, and BMI were correlated by Pearson correlation analysis. BMI alone was significantly correlated with the IOP and PI of the CRA. The PSV and EDV of the OA were significantly correlated with BMI and age (Table 2). The outcome of the overall analysis revealed that BMI is the only predictive parameter over IOP, the PI of the CRA, and the EDV of the OA; conversely, both BMI and age were predictive parameters for the PSV of the OA (Table 3).
Table 2 Correlation analysis
| Age | Gender | BMI | ||
|---|---|---|---|---|
| CRA RI | Pearson correlation | -0.005 | -0.115 | -0.071 |
| Sig. (2-tailed) | -0.971 | -0.386 | -0.596 | |
| CRA PI | Pearson correlation | -0.008 | -0.228 | -0.389** |
| Sig. (2-tailed) | -0.951 | -0.082 | -0.002 | |
| CRA PSV | Pearson correlation | -0.182 | -0.030 | -0.027 |
| Sig. (2-tailed) | -0.168 | -0.820 | -0.839 | |
| CRA EDV | Pearson correlation | -0.148 | -0.168 | -0.026 |
| Sig. (2-tailed) | -0.264 | -0.203 | -0.848 | |
| OA RI | Pearson correlation | -0.046 | -0.011 | -0.128 |
| Sig. (2-tailed) | -0.728 | -0.933 | -0.335 | |
| OA PI | Pearson correlation | -0.086 | -0.005 | -0.146 |
| Sig. (2-tailed) | -0.517 | -0.969 | -0.268 | |
| OA PSV | Pearson correlation | -0.417** | -0.074 | -0.472** |
| Sig. (2-tailed) | -0.001 | -0.575 | -0.000 | |
| OA EDV | Pearson correlation | -0.294* | -0.155 | -0.318* |
| Sig. (2-tailed) | -0.024 | -0.240 | -0.014 | |
| IOP | Pearson correlation | -0.075 | -0.145 | -0.611** |
| Sig. (2-tailed) | -0.574 | -0.275 | -0.000 |
DISCUSSION
In the present study, significantly higher IOPs were found in the obese group than in the control group. The PI values of the CRA and the PSV and EDV values of the OA were found to be significantly lower in the obese group than in the control group. Our study has revealed that obesity significantly affects retrobulbar hemodynamics. Whilst undertaking the background research, we did not find any studies on the impact of obesity on retrobulbar blood flow.
Obesity is a major health problem nowadays, with high rates in many countries(17). Although obesity is defined as a high proportion of adipose tissue, focal accumulations of fat tissue in certain anatomical locations can cause morphological and functional changes(18). In a large-scale study, Klein et al.(19) found that IOP values increased as BMI values increased. Similarly, Akinci et al.(20) found that obesity is an independent factor for increased IOP in the early adolescent period. In the present study, we found higher IOP values in obese individuals than in non-obese individuals. This finding is similar to those of previous studies that revealed obesity as an independent risk factor for increases in IOP(19,20).
In the English literature, many investigators have tried to explain the mechanism of the increase in IOP. Recently, Stojanov et al. measured the volume of retrobulbar adipose tissue using magnetic resonance imaging in obese patients, and reported that increased retrobulbar adipose tissue also increased IOP by its mass effect(18). Causes related to obesity that increase IOP include its harmful effects on episcleral venous pressure and aqueous humor outflow, increased blood viscosity, and enhanced IOP secondary to oxidative stress caused by hyperleptinemia in obesity(18,21,22). Similar to our study, Karadag et al.(23) investigated the impact of BMI on IOP and the ocular pulse am plitude, and detected increases in IOP in parallel with increases in BMI and an indirect decrease in the ocular pulse amplitude, which shows choroidal perfusion and ocular blood flow. In the present study, IOP values were found to increase with increasing BMI, even though the IOP values were still within the normal limits for both groups.
Obesity induces vascular endothelial and autonomic dysfunction, thus resulting in impaired blood flow and unstable perfusion(24). Obesity increases the risk of development of impaired IOP, as well as systemic abnormalities such as hypertension and atheros clerosis(19,25). Therefore, because of increased IOP and vascular irregularity, obesity may play a role in the development of glaucoma.
Among the few studies on this topic that have demonstrated a correlation between obesity and glaucoma is a large population-ba sed study performed by Leske et al., who reported that increased BMI also increases the risk of open-angle glaucoma(8). In their ocular CDU examinations, Jimenez-Aragon et al.(26) noted that a decrease in the flow rates through the retrobulbar arteries led to marked disease progression in patients with glaucoma. Suprasanna et al..(27) detected decreases in ocular blood flow velocities, especially in patients with open-angle glaucoma. In light of this information and our results, it appears that both the decrease in retrobulbar blood flow and the increase in the IOP contribute to the risk of glaucoma development in obese patients.
Autoregulation is defined as the ability of an organ to stabilize blood flow velocity despite alterations in the perfusion pressure of that organ. Ocular blood flow is affected by systemic and local cau ses. An increase in IOP causes decreases in uveal, choroidal, and retinal blood flow(28). The retina has an autoregulatory response to alterations in blood pressure to allow blood flow to remain constant. However, the autoregulatory function of the retina is impaired when IOP is above 30 mmHg(29-31).
Our results showed no statistically significant difference in the RI values of the CRA between the obese and healthy groups. On the contrary, we found a significant decrease in the PI values of the CRA. RI reflects vascular resistance. However, because the diameters of the retrobulbar vessels are extremely small, they are not only affected by distal vascular resistance but also proximal vascular resistance(32). Moreover, a study using hyperoxia (breathing 100% O2) to detect changes in vascular resistance in the CRA did not support RI as a good measure of vascular resistance(33).
PI is a variable that also reflects vascular resistance. However, be cause PI is not associated with the vascular PSV value, but is dependent on the mean flow velocity, it is associated with the mean vascular resistance and compliance. PI can be affected by local and regional hemodynamic, respiratory, neurohormonal, and hematological parameters. Previous studies have demonstrated increased arterial resistance and decreased compliance in large and mode ra te-sized arteries in obese patients, and these findings are reportedly the result of the increased cardiac output related to obesity(34,35). In the present study, the PI of the CRA was significantly lower in the obese group than in the control group. We believe that this is related to the decreased reactive vascular compliance from the increased cardiac output in obese patients, which is a similar conclusion to that of previous studies.
In the present study, the IOP values were found to increase with increasing BMI, even though the IOP values were still within the nor mal limits for both groups. In the obese group, we found a significant decrease in the PSV and EDV of the OA and the PI of the CRA as assessed by CDU. We hypothesized that the alterations in the flow parameters of the OA results, increase in episcleral venous pressure secondary to the increased amount of retro-orbital fat, and secondary increase in the blood viscosity were due to the obesity and the associated oxidative stresses such as hyperleptinemia.
One of the main limitations of our study was the small sample sizes of both the obese and healthy volunteer groups. Further investigation with larger study populations would allow a more accurate reflection of the results in the population. Another limitation of our study was the information bias. We included morbidly obese patients in our study, with a median BMI of 50 kg/m2 in the obese group. More knowledge about the role of obesity on BMI in a larger study population and in patients with various stages of obesity (mildly, moderately, and morbidly obese groups) and duration of obesity could provide more detailed data on the effect of obesity on the parameters of the retrobulbar vascular structures. Additionally, CDU, which we used to evaluate the ocular hemodynamics, does not provide information on ocular blood flow. However, it provides data on retrobulbar blood flow, which can easily be influenced by local and regional alterations, predominantly in the OA and CRA.
In conclusion, we found that obese individuals have markedly higher IOPs than non-obese individuals. We also found a decrease in the PI of the CRA, which aims to compensate for decreased ocular blood flow secondary to the decreased blood flow through the OA among the retrobulbar arteries and increases the IOP in the CRA via an autoregulation mechanism. Our findings have also demonstrated increased IOP in obese individuals and related decreases in the blood flow velocities of the OA. Increased IOP, together with decreased retrobulbar blood flow, especially in obese individuals, may increase the risk of developing glaucoma. Therefore, it is important to measure the IOP and retrobulbar blood flow in obese patients to ensure early detection of glaucoma, thus allowing prompt management of this disease.


 English PDF
 Print
Print
 Send this article by email
 How to cite this article
 Submit a comment
 Mendeley
 Scielo
 Pocket
 Share on Linkedin

