INTRODUCTION
Tilted disc syndrome (TDS) is a nonhereditary syndrome characterized by a congenital optic disc abnormality with an elevation of the superotemporal part and depression of the inferonasal part of the disc, leading to an oblique orientation of its longitudunal axis that affects males and females equally(1,2). Situs inversus (oblique orientation of retinal vascular structures), myopic astigmatism, peripapillary atrophy, ectasic inferonazal fundus, inferior retinal pigment epithelium, and choroid thinning are frequently present in these cases(1,2). These findings can be associated with bitemporal hemianopsia, central retinal vein thrombosis, peripapillary subretinal hemorrhage, macular neurosensory retinal detachment, and secondary choroidal neovascularization(3,4). Myopic astigmatism, which has been reported to be mainly corneal in origin, is the main cause of poor vision in TDS patients(5). Another study reported clinically significant lenticular astigmatism in these cases(3). A marked relationship between abnormal corneal configuration and abnormal optic discs has been reported in the literature. Another study reported that the orientation of the long axis of the optic disk could indicate the corneal astigmatism axis(6), and Pakravan et al.(7) reported an inverse correlation between the optic disk area and central corneal thickness (CCT).
The Scheimpflug imaging system (Pentacam) provides data on the elevation of the anterior and posterior corneal aspects, and pachymetric measurements without making contact with the ocular surface using a procedure that is easy to perform and repeatable. The Scheimpflug imaging system also provides user-independent high reliability(8).
The aim of this study was to evaluate the detailed structure of the cornea in patients with a diagnosis of TDS using the Scheimplug imaging system and to compare these data with those of a normal population. The difference between this study and other previous studies is the use of the Scheimpflug imaging system to evaluate the anterior and posterior surfaces and the volume of the cornea in detail.
METHODS
The study protocol was approved by the Ethics Committee of Inonu University (Malatya, Turkey). All patients participated in the study voluntarily. Information and consent forms were obtained from the patients and volunteers in the control group.
This was a cross-sectional study conducted between May 2012 and December 2012 that included one eye from each participant. The eye with a spherical equivalent closer to the control group in bilateral cases was chosen. Patients diagnosed with TDS and control cases were recruited from approximately 1350 patients who presented to the Department of Ophthalmology, School of Medicine, Inonu University. The patients and controls were aged 18-60 years with no ocular or corneal pathology or history of ocular surgery, use of any topical or systemic drugs in the last 3 months, or systemic disorder (diabetes mellitus, rheumatologic diseases, Down syndrome, pregnancy) that could affect the eyes. The cases were evaluated as two groups in the study. Power analysis showed that the minimum number of cases for each group was 32.
The study group (Group 1) consisted of 35 eyes of 35 patients with TDS. The following criteria were used for a diagnosis of TDS: elevation of the superotemporal part and backwards dislocation of the inferonasal part of the optic disc, oblique orientation of the longitudinal axis of the optic disc, the presence of retinal pigment epithelium and choroidal atrophy together with inferonasal peripapillary atrophy (Figure 1). The fundus of all study participants was photographed.
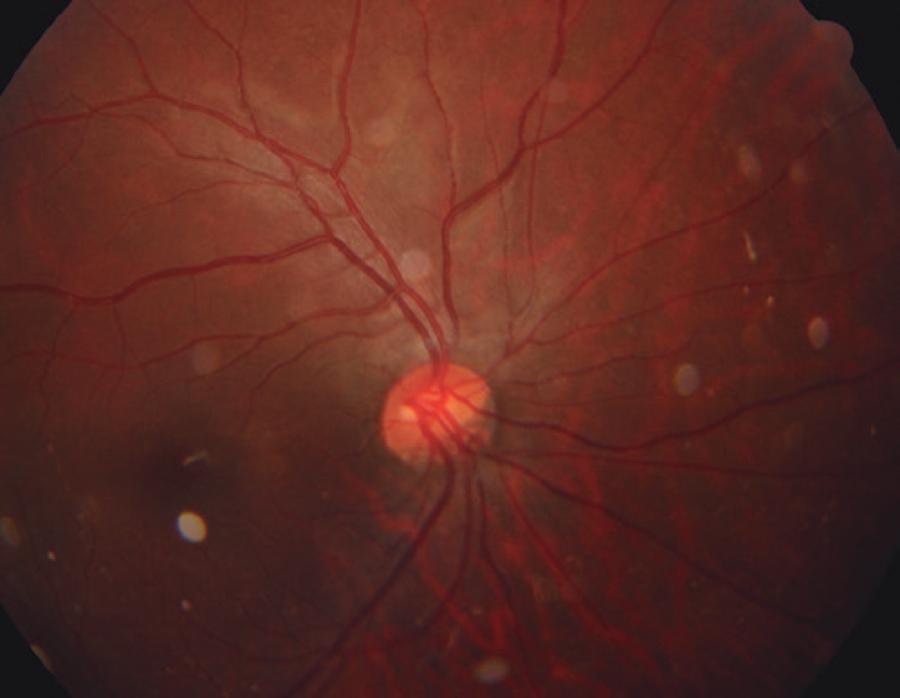
Figure 1 An optic disc image of a 32-year-old male TDS patient with a spherical equivalent of -3.25 diopter
The control group (Group 2) consisted of 35 eyes of 35 age- and sex-matched healthy patients chosen according to spherical equivalents. We made sure that the cycloplegic refraction spherical equivalent value (calculated by adding half the minus astigmatism value to the spherical value) of the control group was similar to that of the study group. Also, the same exclusion criteria were used for the control group and the study group.
An ophthalmologist performed standard ophthalmic examinations of participants in both groups that included refraction, best corrected visual acuity (BCVA), cornea and anterior segment evaluation with a slit lamp, and intraocular pressure (IOP) measurements. Only patients with no pathology were included in the study. All eyes were evaluated with the Scheimpflug imaging system (Oculus Optikgerate GmbH, Wetzlar, Germany) and axial length measurement and cycloplegic refraction were performed with an auto kerato-refractometer (KR-8900; Topcon Corporation, Tokyo, Japan) 45 min after administration of 1% cyclopentolate hydrochloride drops at 10-min intervals.
Both groups consisted of patients with no systemic disease who had not used any systemic or topical drugs in the last 3 months. Patients who underwent ocular surgery, had a history of contact lens use, had ocular trauma, or had symptoms of ocular allergy or dry eye were excluded from the study. Eyes with a corrected visual acuity of less than 0.5 on a standard ophthalmic examination and eyes with an axial length (ALX) of less than 22.0 mm or more than 26.0 mm were also excluded.
Pentacam measurements
All measurements were obtained under standard dim light conditions and without dilation. The instrument automatically starts the measurement once correct alignment with the corneal apex and focus is achieved. One measurement with the Scheimpflug imaging system takes approximately 2 s, during which time the Scheimpflug camera captures 25 images by rotating 360 degrees around the optical axis of the eye. Three images were evaluated and the one with the best quality was recorded for each eye. CCT measurements and anterior and posterior elevation maps were obtained with this instrument. Once the screening was completed, the Pentacam software automatically recorded the CCT, corneal volume (CV), the volumes of 3, 5, and 7 mm3 (CV3, CV5, and CV7, respectively), and mean keratometry (mK) values. The data obtained from the anterior and posterior maps were evaluated as reported by Uçakhan et al.(8). Accordingly, the Max AE5, Max AD5, AER, and AEDD parameters were calculated from the anterior corneal maps and the Max PE5, Max PD5, PER, and PEDD parameters from the posterior corneal maps. These parameters were then used to evaluate the anterior and posterior aspects of the cornea. These abbreviations of the indices are explained in table 1.
Table 1 Abbreviations
| MaxAE5 | The maximum elevation value above the BFS at the central 5.0 mm of the anterior elevation map obtained by moving the cursor to the highest point on the anterior elevation map. |
| MaxAD5 | The maximum depression value below the BFS at the central 5.0 mm of the anterior elevation map obtained by moving the cursor to the lowest point on the anterior elevation map. |
| AER (anterior elevation ratio) | Obtained from the anterior elevation data. The maximum elevation value above the BFS at the central 5.0 mm of the anterior elevation map divided by the BFS (AER Z MaxAE5/BFS). |
| AEDD (anterior elevation depression difference) | Obtained from the anterior elevation data. The highest minus lowest value above and below the best-fit sphere (BFS) (AEDD Z MaxAE5 _ MaxAD5). |
| MaxPD5 | The maximum depression value below the BFS at the central 5.0 mm3 of the posterior elevation map obtained by moving the cursor to the lowest point on the posterior elevation map. |
| MaxPE5 | The maximum elevation value above the BFS at the central 5.0 mm3 of the posterior elevation map obtained by moving the cursor to the highest point on the posterior elevation map. |
| PEDD (posterior elevation depression difference) | Obtained from the posterior elevation data. The highest minus lowest value above and below the BFS (PEDD = MaxPE5 - MaxPD5). |
| PER (posterior elevation ratio) | Obtained from the posterior elevation data. The maximum elevation value above the BFS at the central 5.0 mm3 of the posterior elevation map divided by the BFS (PER = MaxPE5/BFS). |
Axial length measurements
Proparacaine HCl 0.5% drops (Alcaine; Alcon-Couvreur NV, Puurs, Belgium) were used for topical corneal anesthesia before measurement of axial length (Alx). by ultrasound using a Biovision A-Scan V-Plus Echograph (Biovision, Milpitas, CA, USA) equipped with an 8-MHz linear probe. The average of 10 Alx measurements was used for analysis.
Statistical analysis
SPSS software version 18.0 (SPSS Inc., Chicago, IL, USA) was used for statistical analysis. The Shapiro-Wilk test was used to determine whether the distribution of values was normal. The independent sample t-test was used for normally distributed values and the Mann-Whitney U test was used for non-normally distributed values. The chi-square test was used to compare the ratio of males to females between the groups. An α-value of 0.05 indicated a type I error. A probability (p) value of >0.05 was considered statistically significant.
RESULTS
There were 18 males and 17 females in group 1 and 16 males and 19 females in group 2. Table 2 presents the age, BCVA, IOP, sex, axial length, and spherical equivalent values of the patients. There were no statistically significant differences in age, gender, axial length, or spherical equivalent values between two groups (p=0.864, 0.618, 0.234, and 0.850, respectively).
Table 2 Age, sex, axial length and cycloplegic spherical equivalent mean values of the study subjects
| Group 1 (n=35) | Group 2 (n=35) | ||
|---|---|---|---|
| Patient | (Mean ± SD) | (Mean ± SD) | p-value |
| Age, years | 34.68 ± 15.48 | 34.11 ± 12.01 | 0.864 |
| BCVA | 9/10 | 10/10 | 0.963 |
| IOP | 16 | 17 | 1 |
| Sex | |||
| Male, n (%) | 18 (51.42%) | 16 (45.71%) | 0.618 |
| Female, n (%) | 17 (48.57%) | 19 (54.28%) | |
| ALX, mm | 23.50 ± 0.38 | 23.39 ± 0.41 | 0.234 |
| Spheric equivalent, D | 3.62 ± 1.75 | 3.69 ± 1.51 | 0.850 |
n= number; SD= standard deviation, BCVA= best corrected visual acuity; IOP= intraocular pressure; ALX= axial length; mm= millimeter; D= diopter.
The CCT and mK value were obtained directly from the Scheimpflug imaging system and the CV3, CV5, CV7, and total CV data were compared between the two groups. As presented in table 3, there were no significant differences in mK values between the two groups (p=0.232). There was also no statistical difference in CV of the central 3-mm3 volume between the two groups (p=0.172). However, there were statistically significant differences in CCT, CV5, CV7, and total CV values between the groups (p=0.008, 0.003, 0.023, and 0.019, respectively). The values for all three parameters were lower in the study group than in the control group.
Table 3 Comparison of the corneal central thickness (CCT) and mean keratometry value and the CV3, CV5, CV7 and CV data that show the corneal volume obtained directly from the Pentacam between groups
| Group 1 (n=35) | Group 2 (n=35) | ||
|---|---|---|---|
| Pentacam data | (Mean ± SD) | (Mean ± SD) | p-value |
| Mean K | 40.91 ± 14.66 | 43.93 ± 12.96 | 0.232 |
| CCT, µm | 517.06 ± 36.31 | 542.66 ± 41.33 | 0.008* |
| CV3, mm3 | 3.75 ± 0.27 | 3.86 ± 0.37 | 0.172 |
| CV5, mm3 | 11.00 ± 0.77 | 11.59 ± 0.79 | 0.003* |
| CV7, mm3 | 23.86 ± 1.86 | 24.83 ± 1.60 | 0.023* |
| CV, mm3 | 57.92 ± 4.25 | 60.40 ± 4.30 | 0.019* |
*statistically significant; n= number; SD= standard deviation; K= keratometry; CCT= central corneal thickness; CV3= corneal volume in 3 mm3; CV5= corneal volume in 5 mm3; CV7= corneal volume in 7 mm3; CV= total corneal volume.
The anterior corneal values calculated from the anterior maps obtained via the Scheimpflug imaging system are presented in table 4. There were statistically significant differences in the Max AE5, Max AD5, AER, and AEDD parameters between the two groups that showed elevation of the anterior cornea (p=0.001, 0.001, 0.001, and 0.001, respectively). The mean values of these four parameters were greater in the study group than in the control group.
Table 4 Comparison of the Max AE5, Max AD5, AER, and AEDD values that were obtained from the anterior elevation map from the Pentacam and that showed the corneal anterior elevation between the two groups
| Group 1 (n=35) | Group 2 (n=35) | ||
|---|---|---|---|
| Pentacam data | (Mean ± SD) | (Mean ± SD) | p-value |
| Max AE5, µm | 12.22 ± 6.66 | 7.51 ± 4.23 | 0.001* |
| Max AD5, µm | -13.11 ± 6.68 | -8.31 ± 5.17 | 0.001* |
| AER | 1.42 ± 0.95 | 0.96 ± 0.62 | 0.001* |
| AEDD, µm | 24.80 ± 11.82 | 15.02 ± 9.00 | 0.001* |
*statistically significant; n= number; SD= standard deviation; MaxAE5= the maximum elevation value above the BFS at the central 5.0 mm3 of the anterior elevation map; MaxAD5= the maximum depression value below the BFS at the central 5.0 mm3 of the anterior elevation map; AER= anterior elevation ratio obtained from the anterior elevation data; AEDD= anterior elevation depression difference obtained from the anterior elevation data.
The values calculated from the posterior surface maps of the cornea obtained via the Scheimpflug imaging system showing elevation of the posterior cornea are shown in table 5. There were statistically significant differences in the PER and PEDD parameters between the two groups (p=0.001 and 0.048, respectively), while there were no significant differences in Max PE5 and Max PD5 values between the two groups (p=0.066 and 0.14, respectively).
Table 5 Comparison of the Max AE5, Max AD5, AER, and AEDD values that were obtained from the posterior elevation map from the Pentacam and that showed the corneal posterior elevation between the two groups
| Group 1 (n=35) | Group 2 (n=35) | ||
|---|---|---|---|
| Pentacam data | (Mean ± SD) | (Mean ± SD) | P |
| Max PE5, µm | 26.28 ± 15.56 | 19.74 ± 11.40 | 0.066 |
| Max PD5, µm | -29.17 ± 13.15 | -24.51 ± 12.32 | 0.140 |
| PER | 4.21 ± 2.45 | 2.88 ± 1.51 | 0.001* |
| PEDD, µm | 54.77 ± 27.06 | 43.17 ± 20.83 | 0.048* |
*statistically significant. n, number; SD= standard deviation; MaxPD5= the maximum depression value below the BFS at the central 5.0 mm3 of the posterior elevation map; MaxPE5= the maximum elevation value above the BFS at the central 5.0 mm3 of the posterior elevation map; PER= posterior elevation ratio obtained from the posterior elevation data; PEDD= posterior elevation depression difference obtained from the posterior elevation data.
DISCUSSION
There is a relationship between the optic disc and cornea, which are the anterior and posterior windows of the sclera to the outside. A marked relationship between abnormal optic disc shape and abnormal corneal configuration has been reported in the literature(6). Thick corneas have been shown to be present with optic disc drusen, indicating a relationship between development of the optic nerve head and corneal thickness(9). These findings indicate that factors that play roles in corneal development also play roles in optic disc development. A previous study reported a relationship between cornea and optic disc dimensions and that the larger the cornea, the larger the optic disc(10). Another study found a reverse relationship between CCT and the optic nerve area in primary open angle glaucoma patients and this relationship was shown to result in larger optic nerve areas with thinner corneas(11).
TDS is a congenital optic disc anomaly that affects the anterior and posterior segments of the eye. A significant relationship has been found between an abnormal optic disc shape and abnormal corneal structure in TDS cases(6). Another study found no statistically significant relationship between CCT values of TDS patients and normal controls(12). However, they found that the CCT was 6-μm thicker in TDS patients than in the control group. Dehghani et al.(4) also found no statistically significant relationship in corneal thickness between the TDS and control groups, although CCT values were greater in TDS cases. In contrast, we found significantly smaller CCT values in eyes with TDS than in those in the control group (517.06 ± 36.31 vs. 542.66 ± 41.33 microns, respectively, p=0.008). We believe that the difference in CCT between our study and these previous reports is due to the technique used to measure corneal thickness and racial differences of the included subjects. The A-scan ultrasound used in the literature is highly user-dependent compared to the Pentacam system, which can also influence the results(13).The technique used in the present study provides more reliable results in this respect. Studies have also shown that CCT can vary between subjects of different races(14,15).
The parameters for evaluation of CV were also checked in this study. There was no difference in the CV3 value while there were statistically significant differences in the CV5, CV7, and CV values between the two groups, which indicated that CV is decreased and the cornea is thinner in eyes with TDS. We therefore believe that the lower volume in the peripheral cornea than in the central cornea in TDS cases can increase the risk of ectasia following refractive surgery.
Current technology has facilitated the detection of ectasia of the anterior and posterior aspects. Identification of elevations of the anterior and posterior corneal surfaces is especially important for refractive surgery. It has also been reported that elevation of the posterior cornea is important for early detection of keratoconus in addition to anterior corneal elevation(16,17). We found a significant difference in anterior curvature changes of the cornea between the control and TDS groups in this study. We also found changes in elevation of the posterior corneal surface, although these changes were not as significant as those in the anterior surface. Since this is the first study to compare the degree of elevation of the anterior and posterior cornea in TDS cases, we were unable to compare our data with other data sets in the literature. However, we believe these corneal elevations could be important in TDS patients who are candidates for refractive surgery.
The main difference of this study from others in the literature is the use of the Scheimpflug imaging system to evaluate the anterior and posterior surfaces, and volumes of the cornea in detail in TDS cases. Prior studies only evaluated refractive and pachymetric measurements of the cornea. The Scheimpflug imaging system uses the elevation-based tomography principle and therefore provides accurate and reliable data on the actual shape of the cornea, independent of position, orientation and axis(18). It therefore enables a much more detailed evaluation of the cornea than do refractive or ultrasonographic pachymetry measurements.
There were some limitations to this study. The main limitations were the small number of cases and the lack of blinding during the examinations. Multicenter studies with larger patient cohorts may provide more valuable results. Another limitation was that the study and control groups consisted of Caucasians only. Thus, future studies of multiracial study groups will provide more valuable information.
In conclusion, we performed a detailed evaluation of the cornea in eyes with TDS and found that CCT was lower, the cornea volume was decreased especially in the peripheral regions, and there were important changes, especially in the anterior corneal elevation in eyes with TDS, as compared to normal eyes. The decreased peripheral CV together with anterior corneal elevation in TDS cases can cause serious problems during refractive surgery procedures resulting in CV loss. We therefore feel that the cornea should be evaluated more carefully in eyes with TDS before refractive surgery. Repeating this study with a larger cohort could reinforce the results.

