INTRODUCTION
In modern society, the ability to read is essential for daily life. The loss of this ability has a severe impact on quality of life, with loss of independence and productivity(1-4). There are several methods to correct presbyopia, such as reading lenses, laser treatments, and multifocal intraocular lenses. It is fundamental to have a standardized test to compare the outcomes of these options (1). Routine single optotype distance visual acuity (VA) tests have been shown to be poor predictors of reading performance and cannot elucidate the full functional impairment of several ophthalmic diseases(2,3,5). It is therefore becoming increasingly necessary to use methods that reproducibly measure the impact of visual disabilities on the patient's everyday life and to show that the recommended therapies successfully improve quality of life(4,6). Modern reading charts, such as the highly standardized Radner Reading Charts, allow the simultaneous evaluation of reading acuity and reading speed and thus provide more detailed information about visual impairment than traditional near vision tests (e.g., Jaeger, Nieden, Parinaud). In addition, such reading charts provide increased accuracy(6) for the evaluation of near visual performance and have become a valuable clinical tool for pre- and postoperative assessment and for visual rehabilitation(7-12).
International standards should be applied to the evaluation of reading performance. Bailey and Lovie described a logarithmically scaled near-vision chart and suggested that it was possible to simultaneously determine reading acuity and speed with single words in a row(13). Legge et al developed the computer-based Minnesota Low-Vision Reading Test (MNread), which presents short sentences at decreasing time periods on a computer screen(14). These sentences have then been used for the MNread cards and consist of 3 lines and 60 characters (including spaces), representing 10 standard length words of 6 characters, as given by Carver(15,16). However, the number, length, and position of words vary considerably(14,17).
Radner et al. emphasized the importance of sentence standardization, because sentence complexity also influences reading speed(4). Therefore, they developed and standardized highly comparable sentences in terms of lexical difficulty, syntactical complexity, word length, number of syllables, and position of words.(4) This concept of "sentence optotypes" results in optimally constant geometric proportions and minimal variation between the test items. High reliability and validity of the sentence optotypes as well as high test-retest and interchart reliability have been shown for Radner Reading Charts(4,18).
A German version of Radner Reading Charts and versions in Spanish, English, French, Dutch, Danish, Swedish, Hungarian, Italian and Turkish have already been developed(6,19-21). Other language versions are in process. Portuguese is the fifth most spoken language in the world, and the Lusophone (Portuguese-speaking) space is estimated to have approximately 241 million people(22).
The purpose of this study was to standardize Portuguese sentence optotypes for the Portuguese version of the Radner Reading Charts (Radner-Coimbra Reading Charts), allowing the evaluation of reading parameters in Portuguese speakers, including reading acuity, reading speed, and logarithm of the minimal angle of resolution (logMAR)/logarithm of the reading acuity determination (logRAD) differences.
METHODS
Study population
The study population consisted of 50 native Portuguese-speaking volunteers with university education and a mean age of 30.98 years ± 6.99 (range, 19-47 years).
Inclusion criteria were: best corrected visual acuity of 0.0 logMAR (20/20 Snellen) or better in each eye and absence of systemic and/or ocular pathology or medications that could influence the results of the study. All volunteers took the test binocularly, with near vision properly corrected if necessary. Binocular reading acuity at 40 cm was at least 20/20 Snellen. All tests were performed at a constant luminance of 80-90 cd/m2. The study followed the tenets of the Declaration of Helsinki. An informed consent document was reviewed and signed by all volunteers.
Design of test sentences
The sentence optotypes (Figure 1) are relative clauses, which represent the first complex but still easy readable and commonly used adult sentences.

Figure 1 Sample sentences from the 34 sentence optotypes developed and tested for the Radner-Coimbra Chart.
A total of 34 sentences were developed to be as comparable as possible in terms of grammatical difficulty as well as in number (14), length, and position of words. The sentences followed the rules that have been generated for sentence optotypes of the Radner Reading Charts, with minor language-specific modifications(4).
Measurements
The 34 sentences were printed in 12-point Arial font, with a maximum of 8 on each page. The reading distance was 40 cm, and luminance was 80-90 cd/m2. The sentences were covered with a blank piece of paper, and the volunteers were asked to uncover the sentences sequentially, reading each one aloud as quickly and accurately as possible. They were advised not to stop or repeat part of the sentence to correct mistakes. The procedure was the same for all sentences. Reading time was measured with a stopwatch. Reading speed in words per minute (wpm) was calculated on the basis of the number of words in a sentence (14 words) and the time needed to read the sentence (14 words × 60 seconds divided by the reading time). Reading errors were noted by marking the wrong words in the sentence on a study form. Errors were counted even when immediately corrected. The criterion for selection of sentences for the chart was a reading time within the range defined by the overall mean reading time for each of the sentences ± 0.40 × SD (standard deviation). A longer text of 106 words ("A Fada Oriana") at the 5th grade reading level (ie, for 10-year-old school children) was tested for reading speed to assess the validity of the results obtained with the short sentences. The main outcome measures were reading time and number of mistakes for each sentence.
Statistical analysis
Statistical analyses were performed using SPSS for Windows (version 19.0, SPSS, Inc.). The mean ± SD of both the reading time and number of mistakes made in each sentence were calculated. The data showed a fairly symmetric unimodal distribution, so that the assumption of a normal distribution for the mean, as required for the t test, was justified (Kolmogorov-Smirnov). Correlation analyses were performed using Pearson correlation. The cut-off level for statistical significance was set at P<0.01, two-tailed.
RESULTS
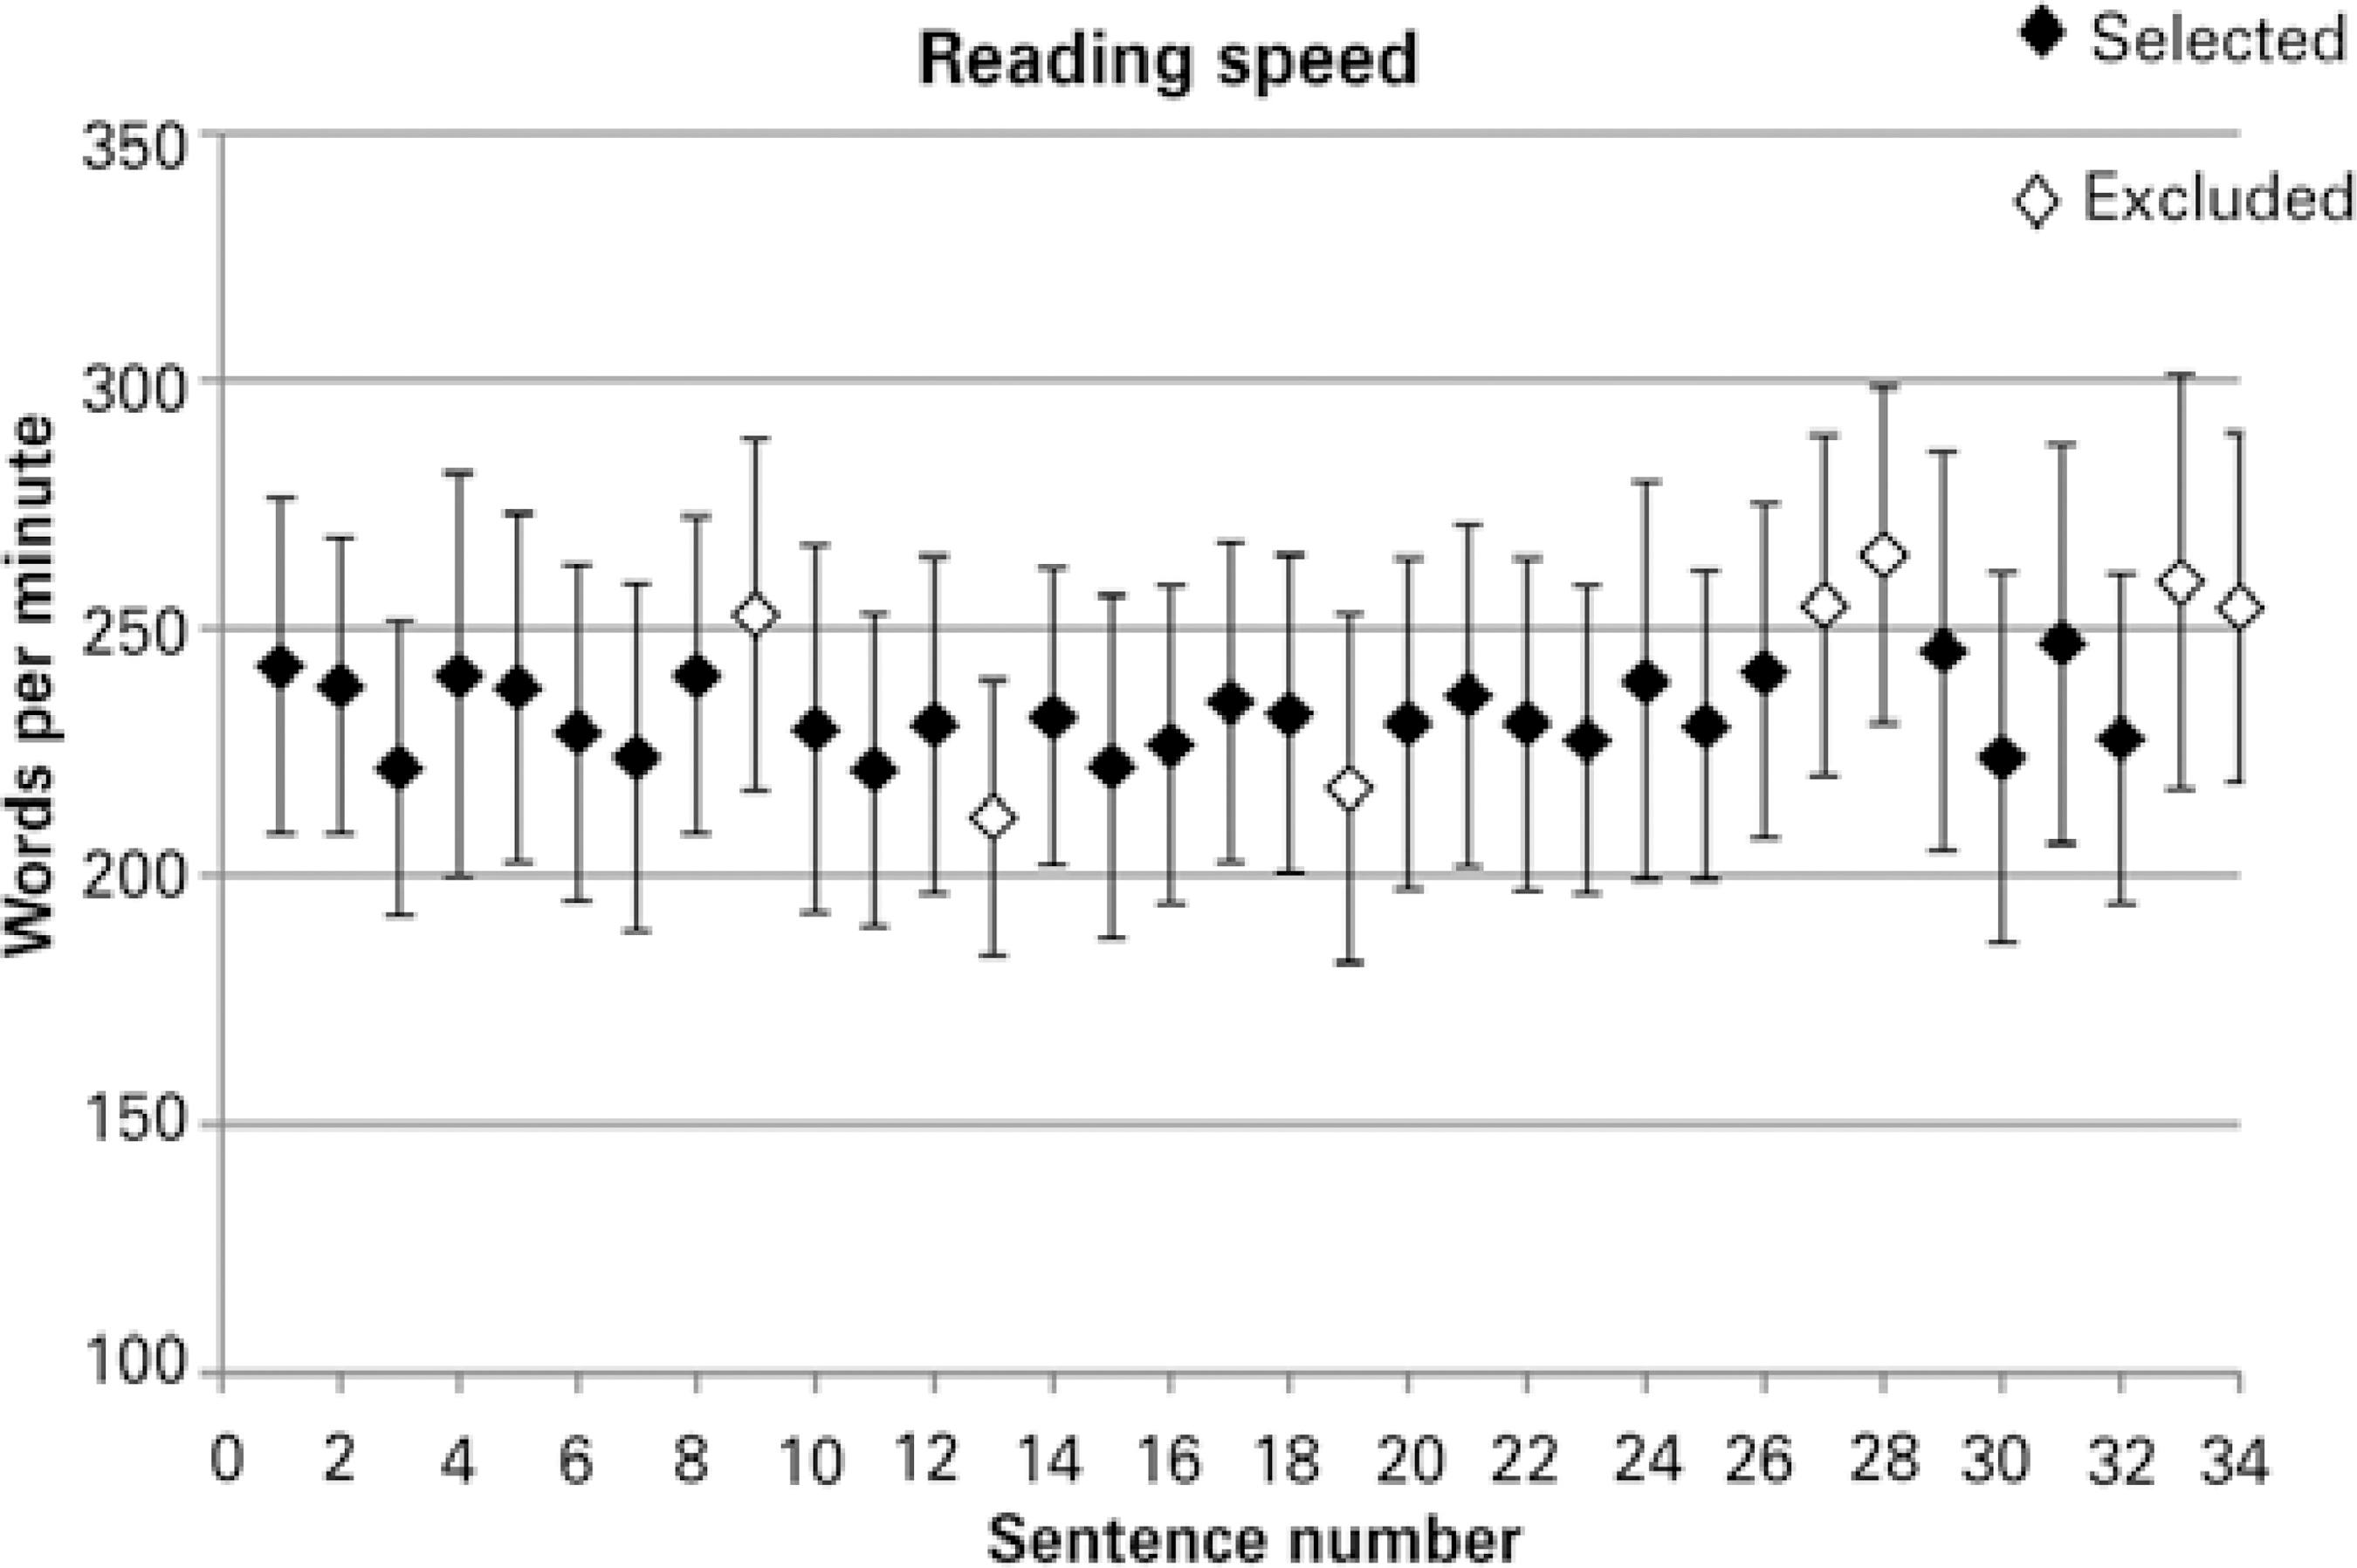
The mean reading speed for all sentences was 235.43 ± 36.39 wpm (range, 126.5 to 389.6). The mean reading time per sentence was 3.66 ± 0.59 seconds (sec). To be selected for the reading charts, the mean time to read a sentence optotype had to be within the range of 3.42 to 3.89 sec (range calculated as 3.66 ± 0.4 × SD), with a reading speed between 220.8 to 250.0 wpm (range calculated as 235.43 ± 0.4 × SD). Of the 34 sentences tested, 27 met the reading time and speed criteria. Seven sentences (numbers 9, 13, 19, 27, 28, 33, and 34) were excluded because they were outside the prescribed range. Figure 2 shows the mean reading time for each sentence.

Figure 2 Mean reading speed and standard deviation for 34 sentence optotypes (overall mean reading speed: 235.43 ± 36.39 wpm). Black diamonds represent the sentences selected for the Radner-Coimbra Chart; white diamonds represent excluded sentences.
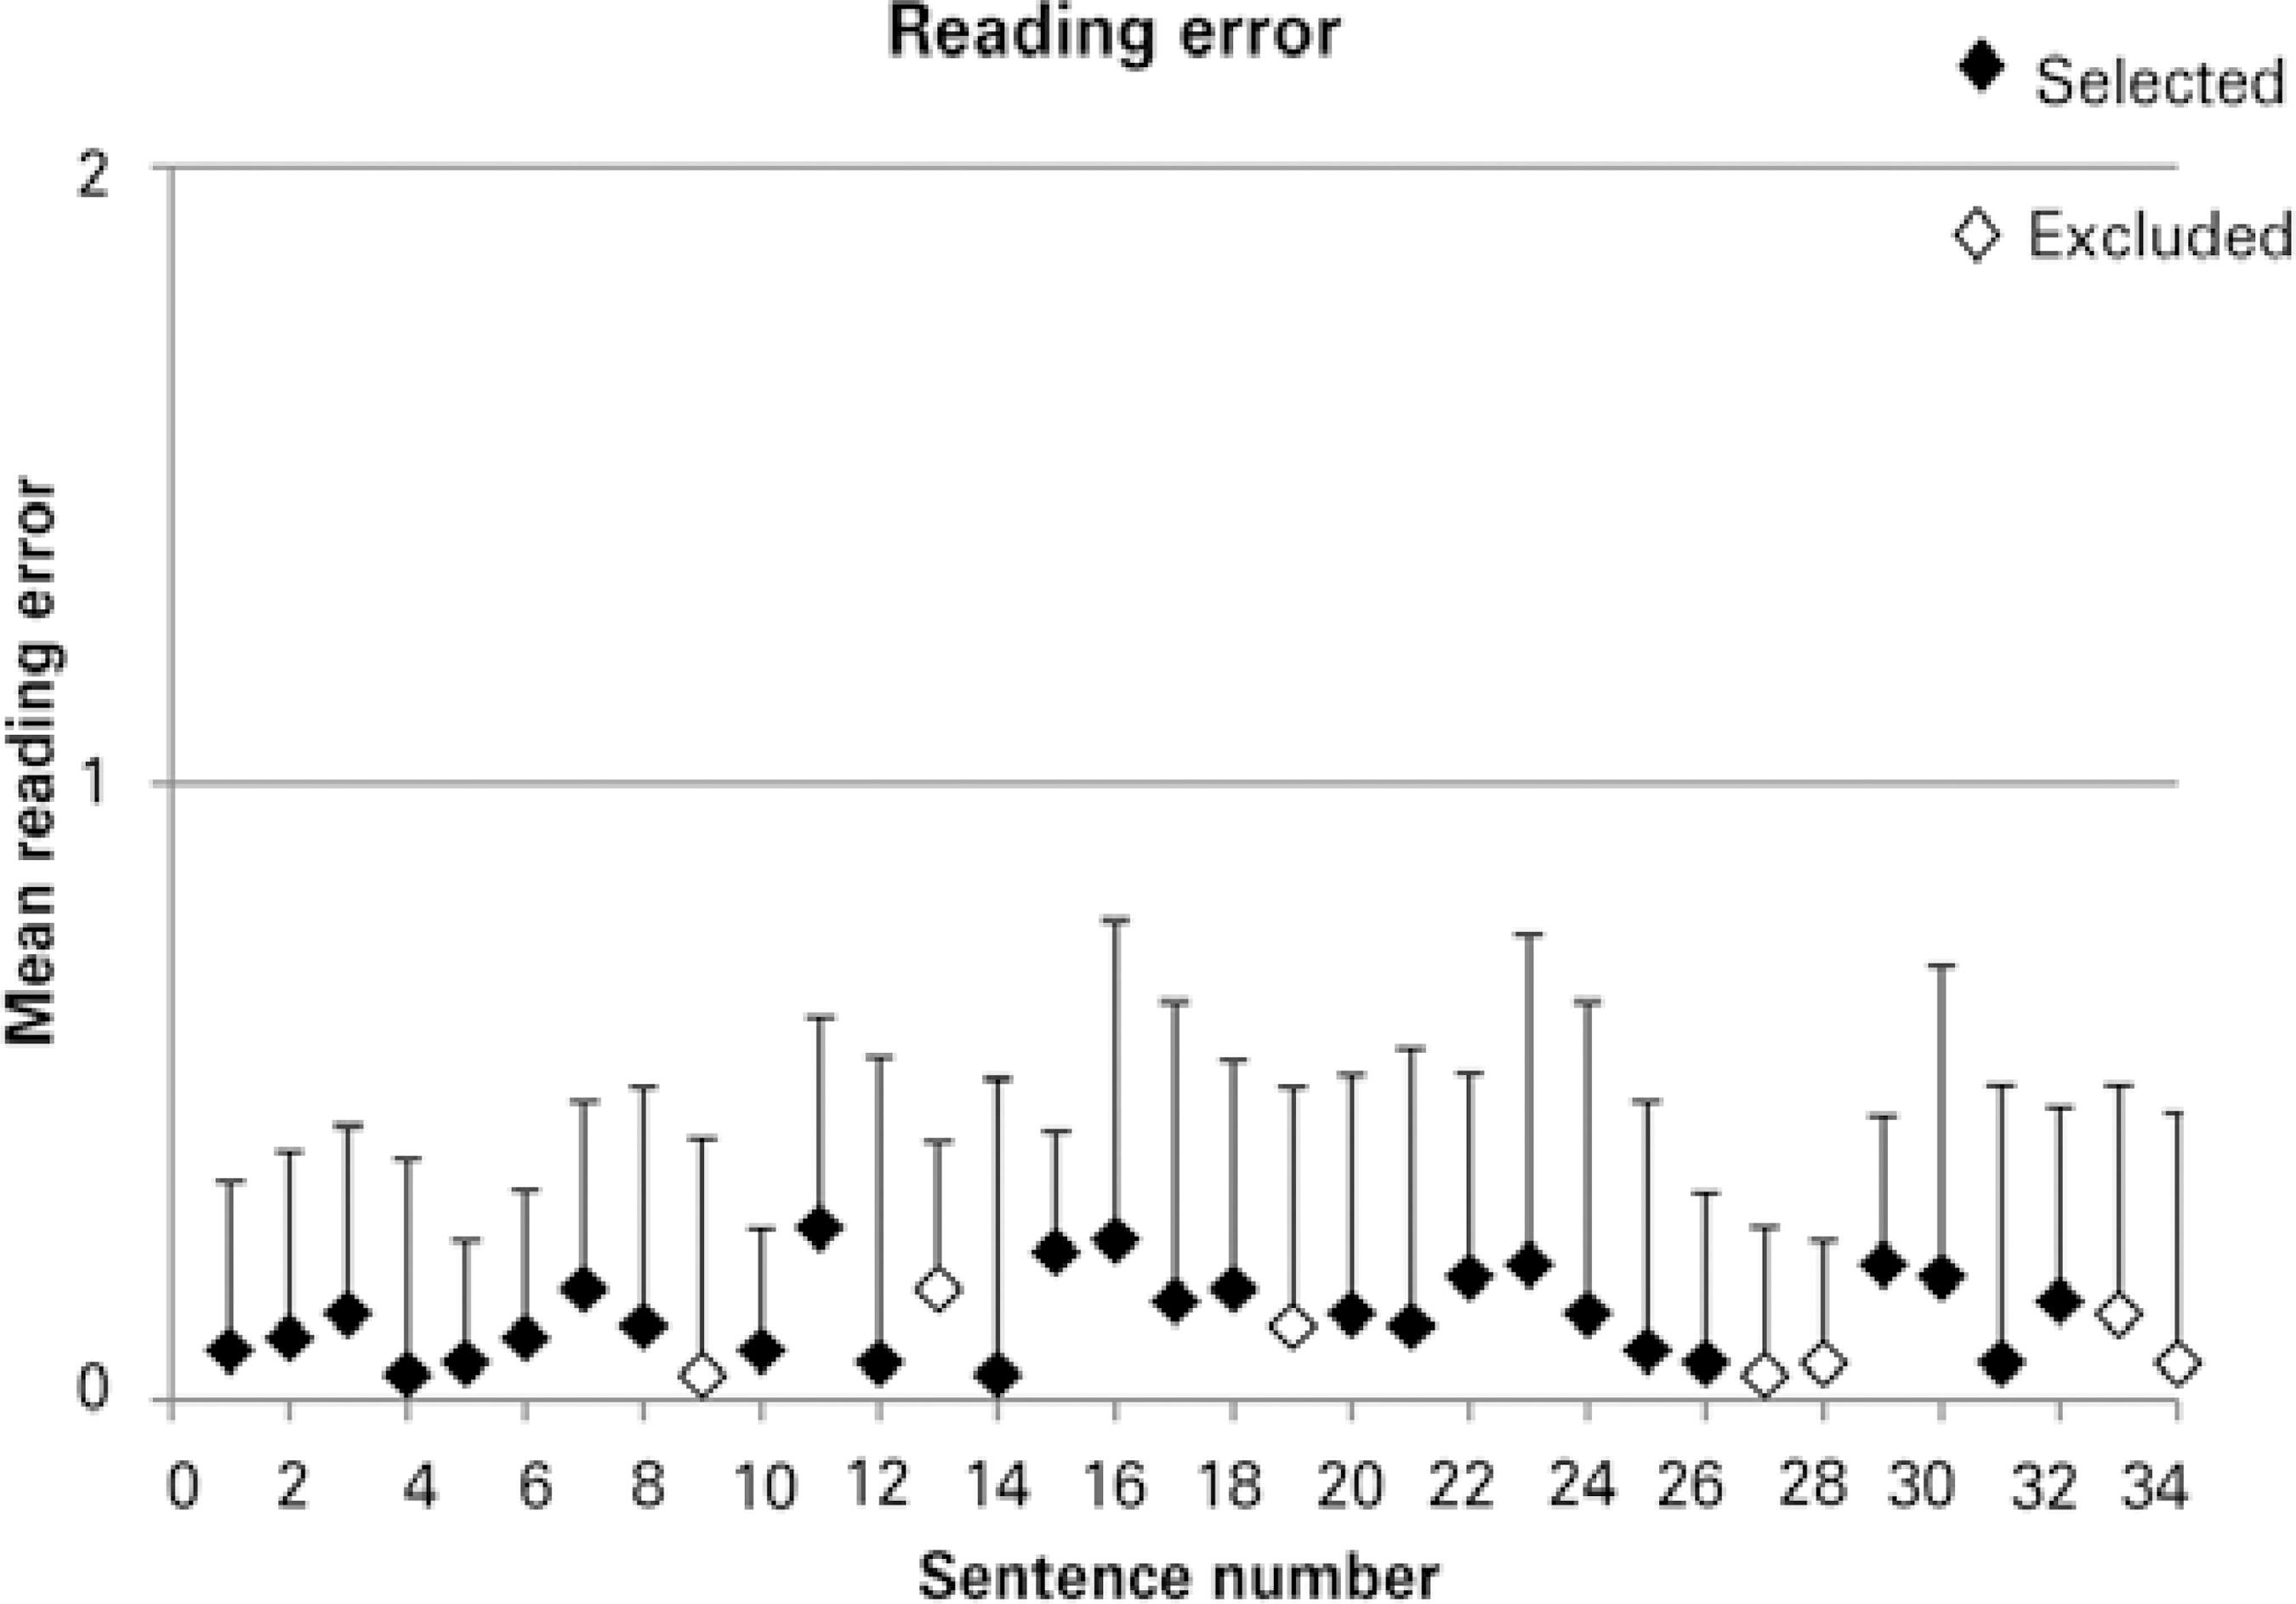
The mean number of reading mistakes for all sentences was 0.13 ± 0.37 words/sentence (Figure 3). The mean number of reading mistakes for the long text was 0.80 ± 0.99 words/sentence.

Figure 3 Mean error number and standard deviation for the 34 sentence optotypes. The mean number of reading errors was 0.13 ± 0.37 errors. Black diamonds represent the sentences selected for the Radner-Coimbra Chart; white diamonds represent excluded sentences.
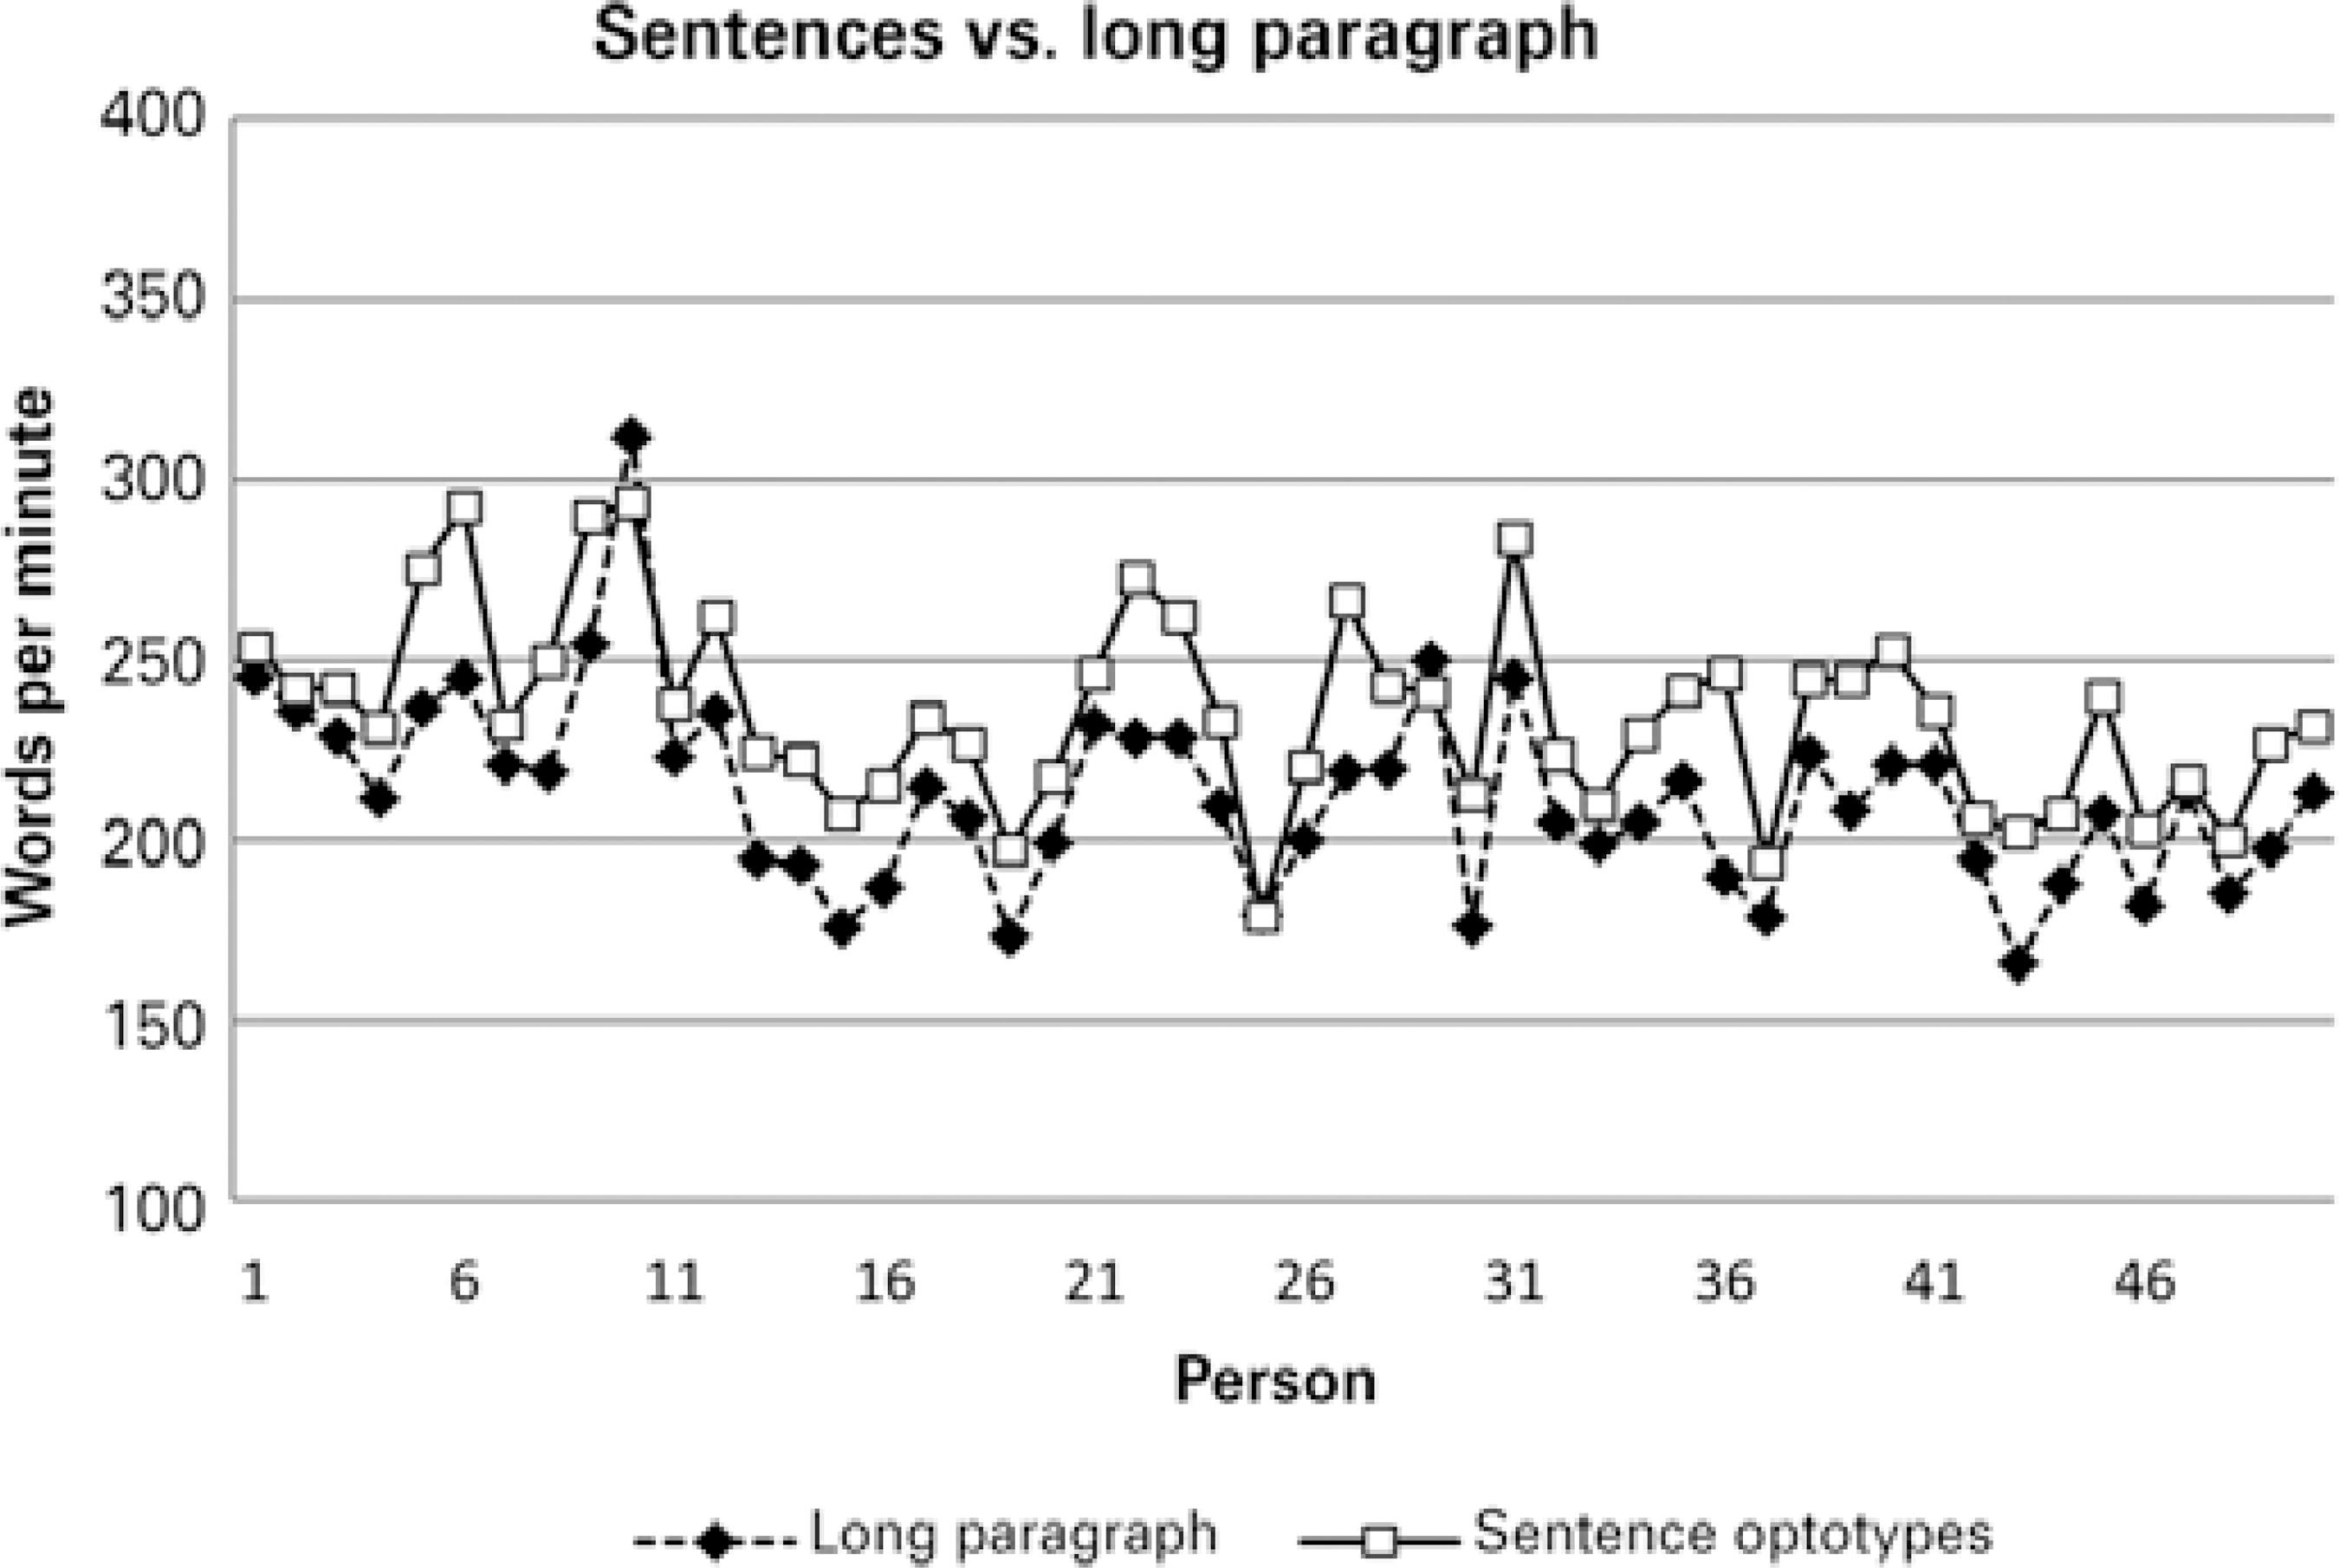
To assess the validity of the reading speed measurements obtained with our short sentences, we compared these reading speed results to those obtained with the long text (Figure 4). The mean reading speed for the long text was 212.42 ± 26.20 wpm. This was lower than that for the short sentences, but the correlation between the two methods was high (r=0.86, p<0.001), thus confirming the validity of the results obtained with the short sentences.

Figure 4 Reading speeds of 50 readers, comparing reading of a long paragraph (106 words; diamonds) vs. sentence optotypes (squares).
The reliability analysis for reading speed results for the short sentence optotypes yielded an overall Cronbach's alpha coefficient of 0.98 for all 34 sentences and 0.97 for the 27 selected sentences. The coefficient of reliability for each of the 27 sentence optotypes varied from 0.62 to 0.89.
DISCUSSION
Reading is a complex task that involves not only visual sensorial input but also accurate eye movements and cognitive capacity(23). Therefore, reading tests are not only different from distance acuity tests but also differ from near acuity tests using single optotypes(24). LogMAR defines the minimal angle at which two points can be recognized as being two. Although angular resolution is a key factor in reading acuity, it is not what is evaluated when reading ability is examined. LogRAD is the reading equivalent of logMAR. For a more differentiated documentation of reading acuity, the use of logRAD is preferred. LogMAR should be used exclusively for single-optotype visual acuity testing(7).
A reading speed below 80 wpm has been found to be the lower limit for recreational, sense-capturing reading performance(25,26). In addition, because normal newspaper print size varies from 10 to 12 points, a reading acuity of at least 0.4 logRAD is a basic requirement for reasonable reading performance(26). A recent review of the measurement properties of reading acuity tests identified 2334 articles(24). Of these 2334, only 20 articles had information concerning the measurement properties of the tests. Of particular note, only three reading tests, IReST, MNRead, and Radner Reading Charts, were included in these assessments(24). Both the MNRead chart and the Radner Reading Charts meet the requirements of a logarithmically progressing print size from one sentence to another and the possibility of measuring reading speed (in wpm) and reading acuity simultaneously. The original Radner Reading Charts in German are different from other performance-reading charts like the MNRead, because Radner et al. developed the concept of sentence optotypes(4). The MNRead used sentences that were only similar in number of lines and number of characters, not in the length and position of words. Because sentence complexity also influences reading speed, Radner et al.(4,20) focused also in the importance of sentence standardization. They therefore developed and standardized highly comparable sentences in terms of lexical difficulty, syntactical complexity, word length, and number of syllables, thus establishing sentence optotypes. This principle makes these charts superior, more reliable, and easier to standardize(3,14,19). Radner and his co-workers also demonstrated that the Radner Reading Charts with highly comparable and standardized sentence optotypes could provide reliable, reproducible and comparable measurements of reading performance for both clinical practice and scientific investigation(4,20). They also have shown that these charts provide highly reproducible measurements of reading acuity and speed in individuals with either no or varying degrees of visual impairment. In fact, Radner Reading Charts have been successfully used in cases with a variety of ocular pathology (e.g., cataract, macular disease, amblyopia)(2,5,12,18).
The Radner Reading Charts have been developed in several languages (e.g., German, Dutch, English, French, Spanish, Danish, Hungarian, Italian, Swedish, and Turkish). However, the original German sentences cannot be literally translated. New sentence optotypes have to be composed and tested for reliability with specific modifications to fit each particular language. Similar to other language versions which are less related to German, such as the Spanish or Italian versions, the sentence criteria for the Portuguese version had to be modified also, reflecting the typical characteristics of our language with regard to lexical difficulty, syntactical complexity, word length, number of syllables, and position of words. Therefore, it is important for every language to test the reliability of the Radner Reading Charts, as has been stated in other studies(6,20,21). Although there are important dissimilarities within a language group in the way people speak the same language, written Portuguese has fewer differences. Words are essentially the same and can be read by people from different Portuguese-speaking countries, as is true for the English and Spanish versions. Furthermore, the instructions that come with the test explain that each sentence should be read word by word, so that it becomes less important if the subject performing the test would choose to say the sentence in a different way.
The sentences were created as consistently as possible, following highly defined rules, including the same number of words (14), same word length, and same word position. The typical word length and word distribution of the Portuguese language was taken into consideration. The length of a line was chosen to be between 27 and 29 characters, as in other Radner Reading Charts, because this number is used in many newspaper columns(4). To define a set of comparable sentences as test items for the reading charts, we selected from among the initial 34 sentences the 27 with the most equivalent results. The validity of reading speed measurements obtained with the short sentences was found to correlate well with the reading speeds obtained with a long text. For example, subjects reading the long text slower also read the short sentences slower.
The test psychology and the psychological backgrounds behind the Portuguese version follow the ones originally applied in the German version. The principles and methods for sentence selection remain consistent between all languages.
Thus, reading speed measurements with our 27 short Portuguese sentence optotypes provided a valid measure of reading performance. These 27 sentences optotypes were then used for the development of the Portuguese version of the Radner Reading Charts.
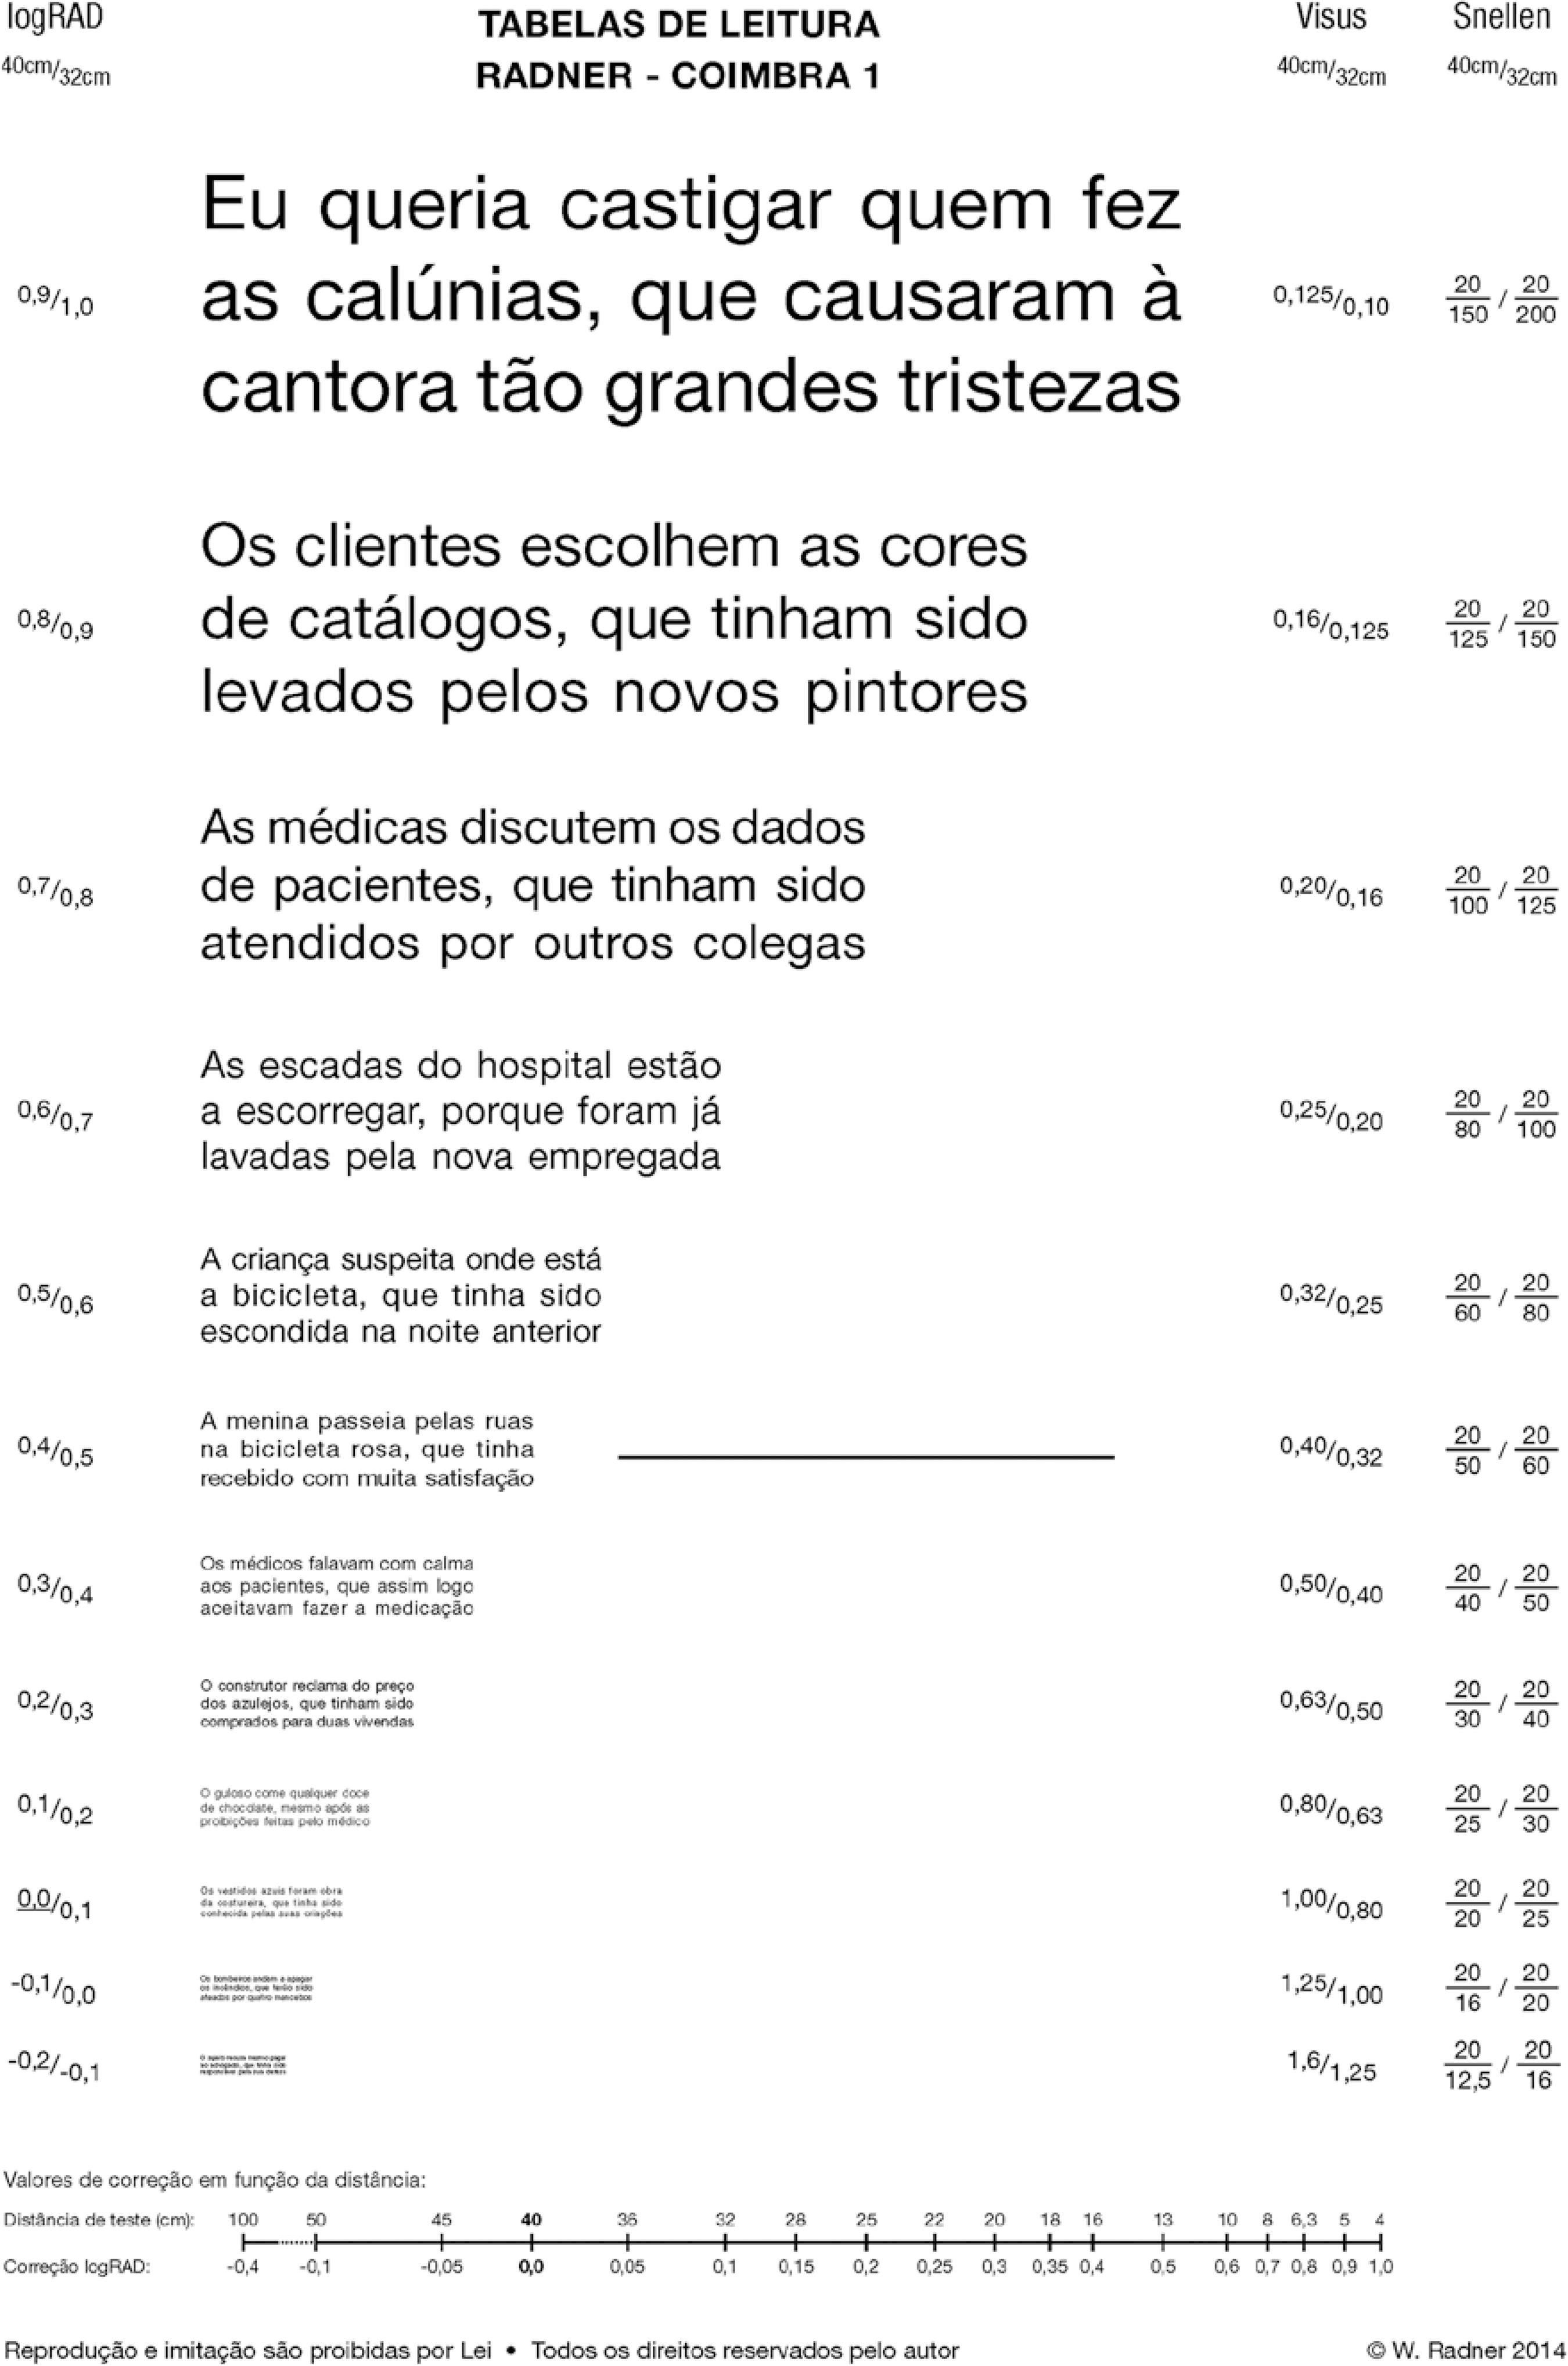
In the Radner-Coimbra Reading Charts, the standardized sentence optotypes are presented in logarithmical scaling (logRAD format) in accordance with international standards in order to maintain constant geometrical proportion at all distances and limit changes in reading speed mainly to the print size (Figure 5).
In conclusion, a new version of the Radner Reading Charts in Portuguese (Radner-Coimbra Charts) was developed. The development of standardized reading charts in Portuguese for the simultaneous determination of reading acuity and reading speed in the same examination is a refinement in the diagnosis of reading performance in Portuguese speaking patients, allowing adherence to international standards for clinical research and potentially improving diagnosis in daily practice.


 English PDF
 Print
Print
 Send this article by email
 How to cite this article
 Submit a comment
 Mendeley
 Scielo
 Pocket
 Share on Linkedin

