INTRODUCTION
Lacrimal gland (LG) secretion of proteins and fluid into the tear film is essential for maintaining the health of the ocular surface (OS). With regard to the corneal epithelium, its smooth optical properties, its transparency, and its protective effect against pathogenic infiltration are sustained by lacrimal gland functions(1,2). Tears are a complex mixture of various constituents containing more than a thousand different proteins(3). Lysosomal hydrolases, secretory IgA(4), lactoferrin, transferrin(5), and growth factors are secreted through vesicles or granules in a regulated or constitutive manner(6).
Diabetes mellitus (DM) impairs tear secretion and induces LG and OS changes(7). Although the effects of DM-induced hyperglycemia, oxidative stress, nerve damage, and impaired insulin signaling have been described in the LG, changes in the secretory mechanism caused by this disease are not clearly understood(8,9). A recent work revealed that high glucose levels reduced the expression of secretory granule-associated vesicle-soluble N-ethylmaleimide-sensitive factor attachment protein receptors (SNARE) in the pancreatic beta-cells(10).
Metabolic and neurogenic inputs are needed to sustain LG function. Specifically, they control secretory and anti-oxidant mechanisms(11,12). Such support is needed to enable the secretory products in the lacrimal acini to go through sorting into immature secretory vesicles in the trans-Golgi network and to acquire the external proteins characteristic of mature secretory vesicles (SVs) as they move towards the apical membrane prior to their exocytotic release(13).
Local and systemic pathways highly control the LG exocytosis of tear fluid components. The exocytosis is modulated by cholinergic and adrenergic stimuli, through changes in protein-kinase A (PKA) activity and intracellular calcium transients(14). This process has several diverse roles, including the release of neurotransmitters, hormones, enzymes, and cytokines. It is regulated in the intracellular environment by a group of cytosolic proteins that include receptors specific for anchoring vesicles. SNAREs and some Rab GTPases participate in this process and comprise proteins responsible for mediating secretion from neural, endocrine, and other exocrine tissues(15). They include vesicle-associated membrane protein 2 (Vamp2), Rab 3d, and syntaxin 1, which are responsible for the docking of molecules and the driving of the plasma membrane vesicle fusion that leads to the release of their soluble components into tears(16).
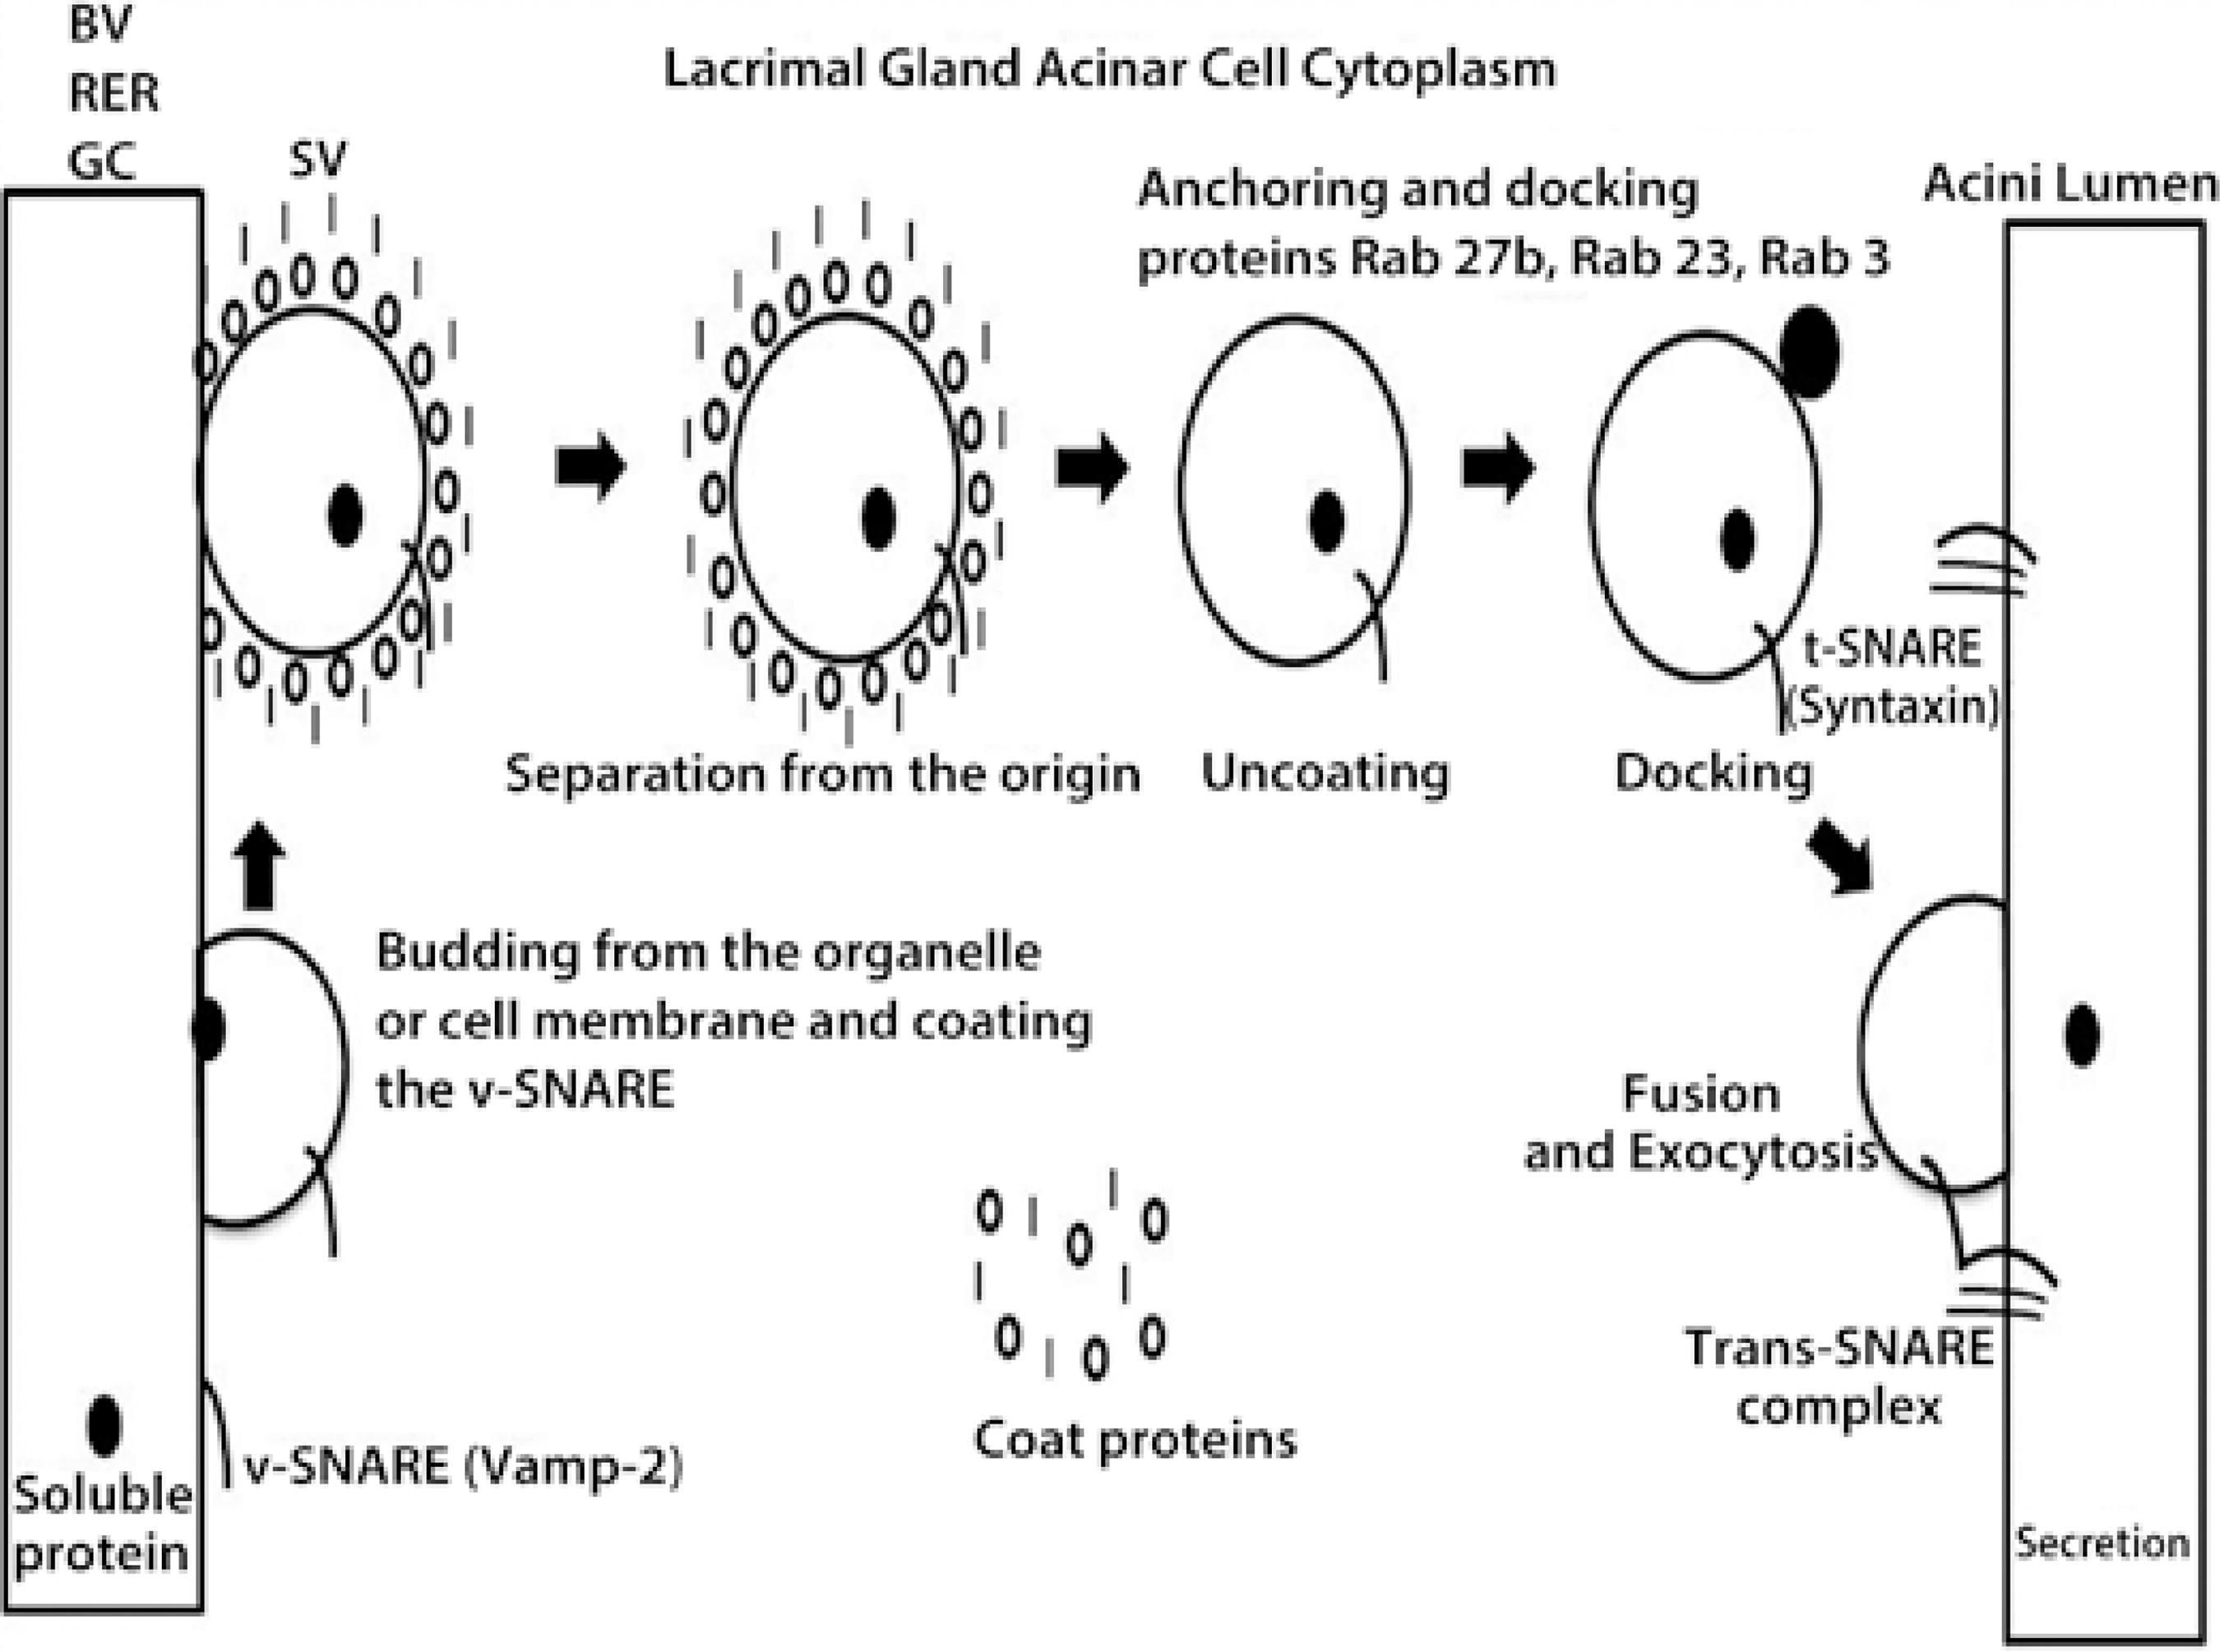
In the LG, the most abundant protein in the acinar secretory pathway is Rab3, which is localized to mature SVs. This protein drives vesicular docking and apical membrane fusion and it can also play a role in determining vesicular size(17) (Figure 1). In previous studies, aging rats had presented with dry eye disease, an insulin-signaling impairment, oxidative stress, and declines in the parasympathetic control of LG function; this revealed an interesting similarity with DM dry eye(18,19). Some SNARE and Rab family members were also altered in aged LG; particularly, Rab 3 expression was reduced at both the mRNA and protein levels(20). In addition, advanced glycation end products can accumulate in aged and diabetic rat LGs(7,18).

Figure 1 Schematic figure of the protein trafficking in the acinar cell cytoplasm of the lacrimal gland (ACLG) that showed the role of the following SNARE proteins (SNAP (Soluble NSF, N-ethylmaleimide sensitive fusion proteins, Attachment Protein Receptor”), Vamp-2 and syntaxin, and the Rab proteins 3, 23, and 27 b, that were previously described in this tissue. The figure indicates the caption of protein from the blood vessel (BV), the rough endoplasmic reticulum (RER), or the Golgi complex (GC) by a vesicle SNARE (v-SNARE), Vamp-2; this was transported into the secretory vesicle (SV) to the GC (where they were modified) or ready in the acinar cell cytoplasm, but coated by proteins that protected them for secretion (storage and regulated secretion). Once ready or requested by extracellular triggers, the SV was uncoated, and SNARE-v was anchored to target the SNARE (t-SNARE), syntaxin, where the docking and exocytosis included the protein in the tear secretion (regulated and constitutive).
In the current study, we characterized the impact of DM on rat LG acetylcholine (ACh) content, the expression of Rab and SNARE family proteins, and the structure of secretory vesicles (SV) as well as the protective effects rendered by insulin supplementation on such changes.
METHODS
Animal model
Eight-week-old male Wistar rats were obtained from the Animal Breeding Center of the Faculty of Medicine of Ribeirão Preto (Ribeirão Preto, São Paulo, Brazil). The animals had free access to standard rodent chow and water. Food was withdrawn 12 h before the experiments and diabetes was induced with a single dose of streptozotocin (Sigma, St. Louis, MO, USA), 60 mg/kg body weight, diluted in 1 mL of 0.01 M citrate buffer that was administered through the caudal vein. Controls were injected with citrate buffer alone. Each of the three different groups used 10 rats.
Two days later, the diabetic status was verified with a glucose meter test (Accu-check, Roche Diagnostica Brazil Ltda., São Paulo, SP, Brazil) of blood obtained from the caudal veins of rats that had fasted for 12 h. A fasting hyperglycemia of over 200 mg/dL was thought to indicate the presence of diabetes; on the 4th day, insulin treatment was initiated in part of the diabetic group (subcutaneous injections of 1 IU every other day). This dose was not sufficient to maintain adequate glycemic control, but was enough to avoid body weight loss and growth retardation(21).
Comparative studies of the three groups, i.e., control (C), diabetic (DM), and diabetic with insulin treatment (IT), were performed 10 weeks later.
The animals were weighed, anesthetized with intraperitoneal injection comprising a combination of ketamine (5 mg/100 g b.w.) (União Química Farmacêutica S.A, Embu-Guaçu, SP, Brazil) and xylazine (2 mg/100 g b.w.) (Laboratorio Callier S.A., Barcelona, Spain). LGs were extirpated after ensuring that the corneal and caudal reflexes were abolished. Thereafter, the rats were euthanized with excess anaesthesia.
Tissue collection and storage
Each LG obtained from the right side of a rat was dissected into two parts and processed according to the protocol for each set of experiments. LGs were collected and homogenized in a buffer containing 50 mM Tris at a pH of 7.5, 500 mM NaCl, 0.1% Triton, and the protease inhibitor cocktail set III (Calbiochem, San Diego, CA) with a Polytron (Virsonic, Biopharma, Winchester, UK). RNA from the LGs was extracted with Trizol after homogenization, according to the manufacturer's protocol. The left LG was used for transmission electron microscopy (EM). This tissue was fixed in 2% glutaraldehyde and 2% paraformaldehyde (Sciences, Hatfield, PA, USA) in 0.1 M of phosphate buffer at a pH of 7.4, for 40 min at room temperature.
Acetylcholine (ACh) measurements in LG
ACh was measured in LG using an ACh assay kit (Amplex Red; Molecular Probes, Eugene, OR, USA) to compare the amounts of this neurotransmitter in LGs of the three groups (n=5/group)(22). In brief, 0.1 mL of medium and tissue aliquots of homogenates containing 200 µg of protein were spotted in duplicate onto 96-well microplates. Standard ACh curves were constructed to evaluate the ACh content in each experiment. A 0.1 mL aliquot of assay buffer (50 mM Tris-HCl at a pH of 7.5) containing 0.2 M of reagent (Amplex Red; Molecular Probes), 2 U/mL of horseradish peroxidase, 0.2 U/mL of choline oxidase, and 10 U/mL of acetylcholinesterase was added to each well. After incubation, absorbance was determined with a spectrophotometer (Beckman Instruments, Inc., Fullerton, CA) at 530 nm. The ACh levels were expressed on a millimolar (mM) basis.
Transmission electron microscopy
LG tissues from the three groups that were fixed for TEM were rinsed in a 0.1 M phosphate buffer, dehydrated through a graded ethanol series, rinsed in acetone, and embedded in an Embed 812 (EM Sciences). Sections (60-70 nm) were cut with a diamond knife and stained for 25 min each in 2% uranyl acetate and 5 min in Reynolds' lead citrate. Sections were examined with a TEM (Jeol, Jem 100cx, Tokyo, Japan). Pictures were taken and converted to digital files (Hamamatsu, ORCA-HR Amtv542, Hamamatsu City, Japan). The intracellular organelles, including secretory vesicles and nuclei, were evaluated in each group.
RT-PCR for Rab3d, Rab 23, Rab 27b, and Vamp2
The reverse transcriptase polymerase chain reaction (RT-PCR) compared the Rab3d, Rab 23, Rab 27b, and Vamp 2 mRNA levels in the three rat LG groups. In addition, beta-actin mRNA was used for internal normalization. The resulting RNA was quantified by spectrophotometry at 260 nm and the RNA integrity was evaluated on 6.6% formaldehyde and 1% agarose (Gibco/BRL) gels. Reverse transcriptase, oligo dT priming, and the Advantage RT-for-PCR kits from Clontech Laboratories Inc. (Palo Alto, CA, USA) were used for the cDNA transcription.
PCR amplification of cDNA was performed with a GeneAmp polymerase chain reaction (PCR) System 9700 (Applied Biosystems, Foster City, CA, USA) using 1.5 units of Taq DNA polymerase (Gibco/BRL), 0.3 mM each of dATP, dCTP, dGTP, and dTTP (Invitrogen), PCR buffer (Tris -Hcl 60 mM, MgCl2 1.5 mM, NH4 SO4 pH10 15 mM) (Invitrogen), and 10 mM of 5' and 3' primers corresponding to rat Rab 3d, Rab 23, Rab 27b, Vamp2, and beta-actin cDNA (Life Technologies, Gaithersburg, MD, USA), after the preliminary assays identified the parameters to ensure that the products were in the linear range (Table 1). In all PCR procedures, the positive and negative control cDNAs were run in parallel. Our attempts to detect syntaxin 1 mRNA were unsuccessful as in a previous study(23).
Table 1 RT-PCR primers and parameters for SNARE and Rab mRNA detection in LG. of control, DM, and insulin-treated DM rats
| Accession number | Primers sequence | Number of cycles | BP size | Annealing temperature | |
|---|---|---|---|---|---|
| B-actin | NM 031144 | Sense: 5' | 33 | 202 | 59°C |
| agagggaaatcgtgcgtgaca 3' | |||||
| Antisense: 5' | |||||
| cgatagtgatgacctgaccgtca 3' | |||||
| Rab 3 d | NM 080580 | Sense: 5' | 37 | 340 | 59°C |
| actgatggtgacaatgatgc 3' | |||||
| Antisense: 5' | |||||
| acggaagtgaagaaagcaac 3' | |||||
| Rab 23 | NM 016277 | Sense: 5' | 37 | 270 | 57°C |
| tgagccaaattgtgctgttc 3' | |||||
| Antisense: 5' | |||||
| gggcaataatttttccacca | |||||
| Rab27b | NM 053459 | Sense: 5' | 37 | 225 | 60°C |
| cggagctcgagaagactaga 3' | |||||
| Antisense: 5' | |||||
| ggccaggagtttaatcaggt 3' | |||||
| Vamp 2 | NM 012663 | Sense: 5' | 34 | 141 | 58°C |
| gcatctctcctaccctttca 3' | |||||
| Antisense: 5' | |||||
| tttaggggtctgagggtaca 3' | |||||
| Syntaxin | NM 053788 | Sense: 5' | 37 | 260 | 60°C |
| gtacaacgccactcagtcag 3' | |||||
| Antisense 5' | |||||
| agcatgtcttccaactcctc 3' |
The PCR program used the following cycle profile: denaturation for 1 min at 94°C, annealing for 1 min at the indicated temperatures, extension for 1.5 min at 72°C, and maximization of strand completion for 7 min at 72°C. Following amplification, the cDNA fragments were analyzed on 1% agarose gels containing a 100 bp DNA molecular weight ladder (Gibco/BRL) and were post-stained with ethidium bromide to confirm the anticipated base pair (bp) sizes for Rab 3d, Rab 27b, Rab 23, and Vamp 2, and beta-actin products.
Positive controls for Rab3d, Rab 23, Rab 27b, and Vamp 2 included cDNA isolated from rat pancreatic islets. Negative controls included samples without reverse transcriptase or samples of cDNA. The results were recorded on the Gel Doc system (Bio-Rad Laboratories, Richmond, CA, USA). The membranes were scanned and analyzed by Scion Image Analysis Software (Scion Corp, Frederick, MD, USA).
Western blotting
Western blots evaluated Rab 27b, Rab 3d, Vamp 2, and syntaxin 1 protein expression in cell lysates obtained from the rat LGs from the three different groups (n=5/group). LGs were solubilized in 1 mL of homogenization buffer containing the following: 100 mM-2-amino-2-hydroxymethyl-propane-1,3-diol (Tris) (pH 7.5), 10 mM-sodium pyrophosphate, 100 mM-sodium fluoride, 10 mM-EDTA, 10 mM-sodium vanadate, 2 mM-phenylmethylsulfonyl fluoride, and 1% Triton-X 100. LGs were disrupted using a Polytron PT 1200C homogenizer (Brinkmann Instruments, Westbury, NY, USA). The extracts were then centrifuged at 12,000 rpm at 4°C for 15 min to remove insoluble materials. Protein concentrations in the supernatant fractions were assayed with the Bradford dye method. For SDS gel electrophoresis and Western blotting, the samples were treated with a Laemmli sample buffer containing dithiothreitol. After heating at 95°C for 5 min, the proteins were separated by electrophoresis (70 µg protein/lane, 10%-12% gels). Following electrophoresis, the proteins were transferred to nitrocellulose membranes. The nitrocellulose filters were treated with a blocking buffer (5% non-fat dried milk, 10 mM-Tris, 150 mM-NaCl, and 0.02% Tween 20) overnight and were subsequently incubated with rabbit polyclonal antibody anti-Rab 3d, Vamp 2, Rab 27b, syntaxin 1, and GAPDH as internal controls (Table 2). Visualization of specific protein bands was performed by incubating the membranes for 2 h with a peroxidase-conjugated secondary antibody (1:10.000; Zymed Laboratories, Inc., San Francisco, CA, USA), followed by detection with enhanced chemiluminescence reagents (Pierce Biotechnology, Rockford, IL, USA) and exposure to X-ray film (Kodak, Manaus, AM, Brazil). The band intensities were quantified by optical densitometry (Scion, Image, Frederick, MD, USA).
Table 2 Antibodies used for Western blot analysis of SNARE and Rab protein detection in LG of control, DM, and insulin-treated DM rats
| Protein | Catalog # | Type | Molecular weight | Concentration |
|---|---|---|---|---|
| GAPDH | Santa Cruz | Rabbit polyclonal | 37 KDa | 200 μg/mL |
| SC 367715 | ||||
| Rab 3 d | Santa Cruz | Goat polyclonal | 25 KDa | 200 μg/mL |
| SC 26392 | ||||
| Rab 27b | Santa Cruz | Goat polyclonal | 30 KDa | 200 μg/mL |
| SC 22993 | ||||
| Vamp 2 | Calbiochem | Rabbit polyclonal | 12 KDa | 1 mg/mL |
| 627724 | ||||
| Syntaxin | Santa Cruz | Mouse monoclonal | 35 KDa | 200 μg/mL |
| SC 12736 |
Statistical analysis
Data were reported as mean ± SEM. Comparisons were made using the Kruskal-Wallis test followed by Dunn's post hoc test (GraphPad 5.0 software; Prism, San Diego, CA). Densitometry values were reported as ratios of beta-actin in RT-PCR and GAPDH in the Western blot assays, respectively. The ratio of densitometric values of one control sample of each blot was defined as 1.0 (100%), and the subsequent values were expressed as a ratio relative to its control value and submitted to statistical analysis with the Kruskal-Wallis test followed by the Dunn's post hoc test.
RESULTS
Body and LG weight were significantly lower in the DM group than in its control group whereas insulin treatment prevented such declines. The ACh levels remained unchanged at 10 weeks after DM induction (Table 3).
Table 3 Changes in parameters of the control, DM, and insulin-treated DM rats. Data is expressed as mean ± standard error, *denotes p<0.05
| Control | DM | DM-ins | |
|---|---|---|---|
| Body weight (g) | 699.8 ± 25.02 | 205.20 ± 11.37* | 504.0 ± 54.67 |
| LG weight (mg) | 128.2 ± 4.83 | 50.10 ± 1.87* | 97.0 ±1 8.61 |
| Glycemia (mg/dL) | 156.5 ± 12.65 | 542.30 ± 53.53* | 295.3 ± 38.15 |
| Acetylcholine (μM) | 110.6 ± 18.60 | 86.70 ± 13.5 | 117.6 ± 16.50 |
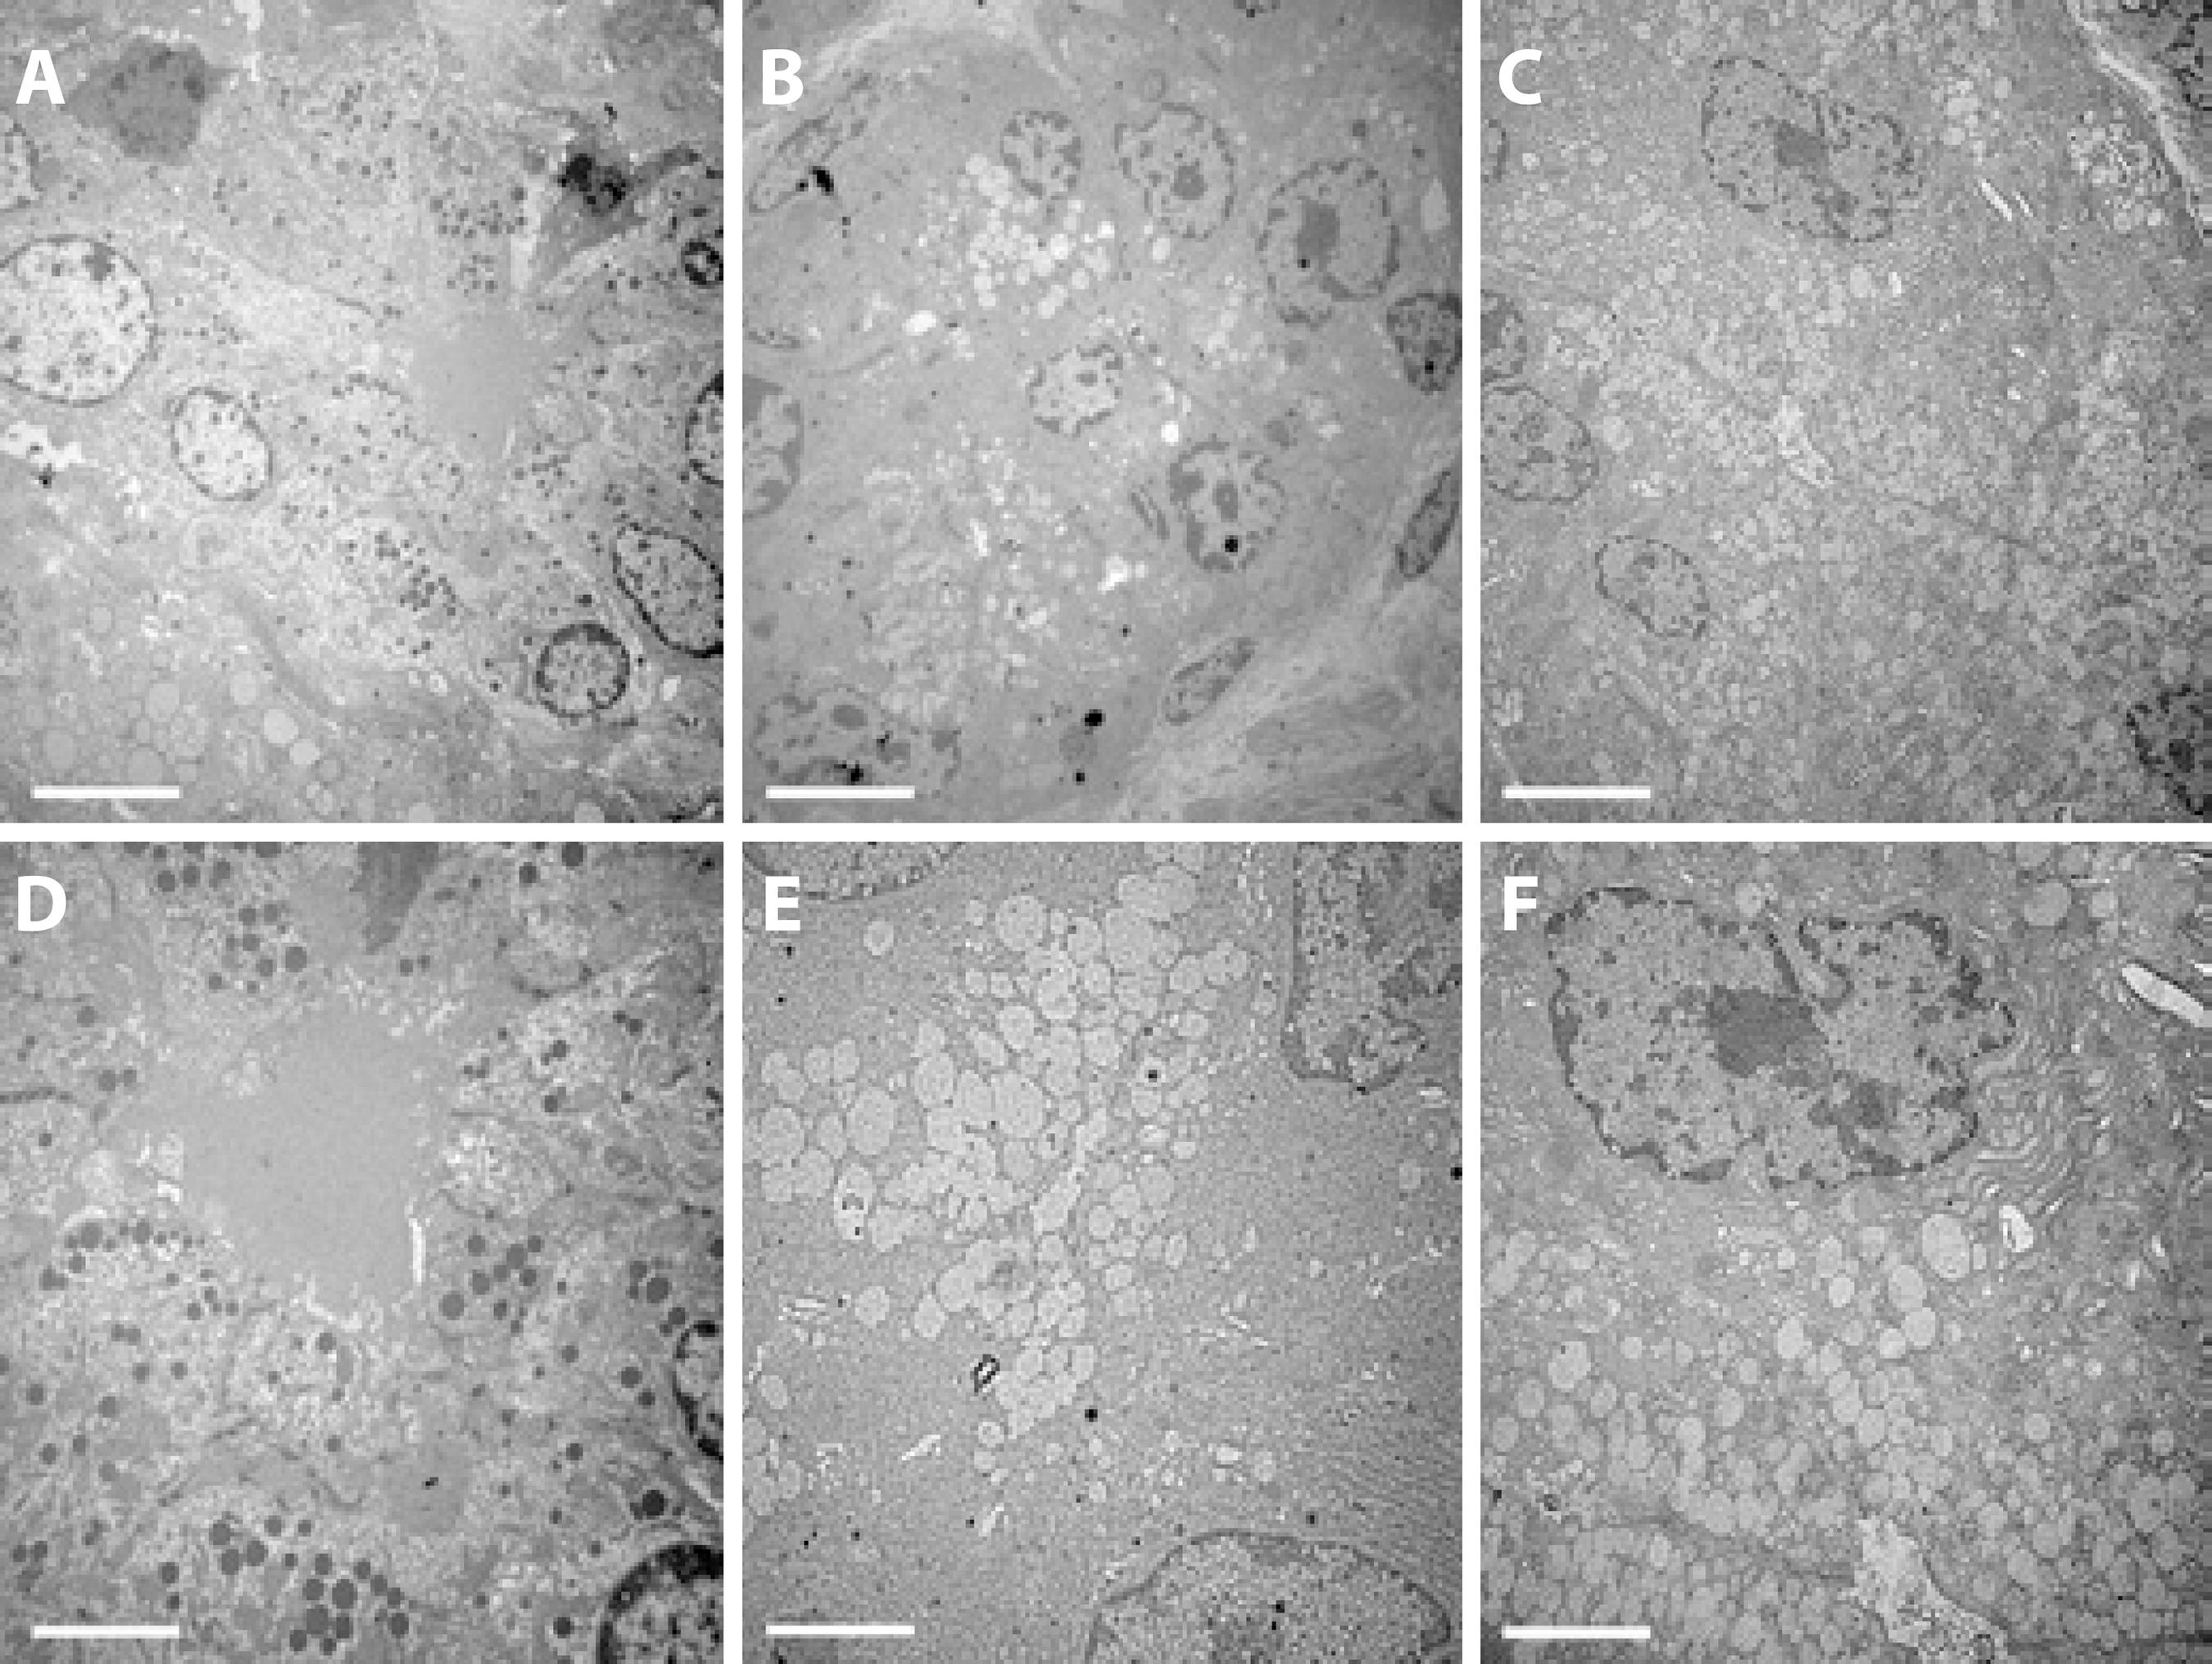
In the apical areas of the acinar cells in the DM group, there were fewer and enlarged secretory vesicles (SV) predominantly encapsulating the white content and there were fewer dark vesicles than in the controls. On the other hand, the cell size and nuclear appearance were unchanged in the DM group. In the insulin-treated group, the predominant white vesicular coloration in the DM group was less evident, but there were fewer black SVs than in the apical areas of the acinar cells of the control LGs (Figure 2).

Figure 2 Transmission electron microscopy of the acinar cells in the exorbital LG of control (A, D), DM (B, E), and insulin-treated (C, F) DM groups. The images are representative of sections of LGs from 5 animals/group. Magnification ×2000 in the upper lane and ×4000 in the lower lane (scale bar=5 µm and 2.5 µm, respectively).
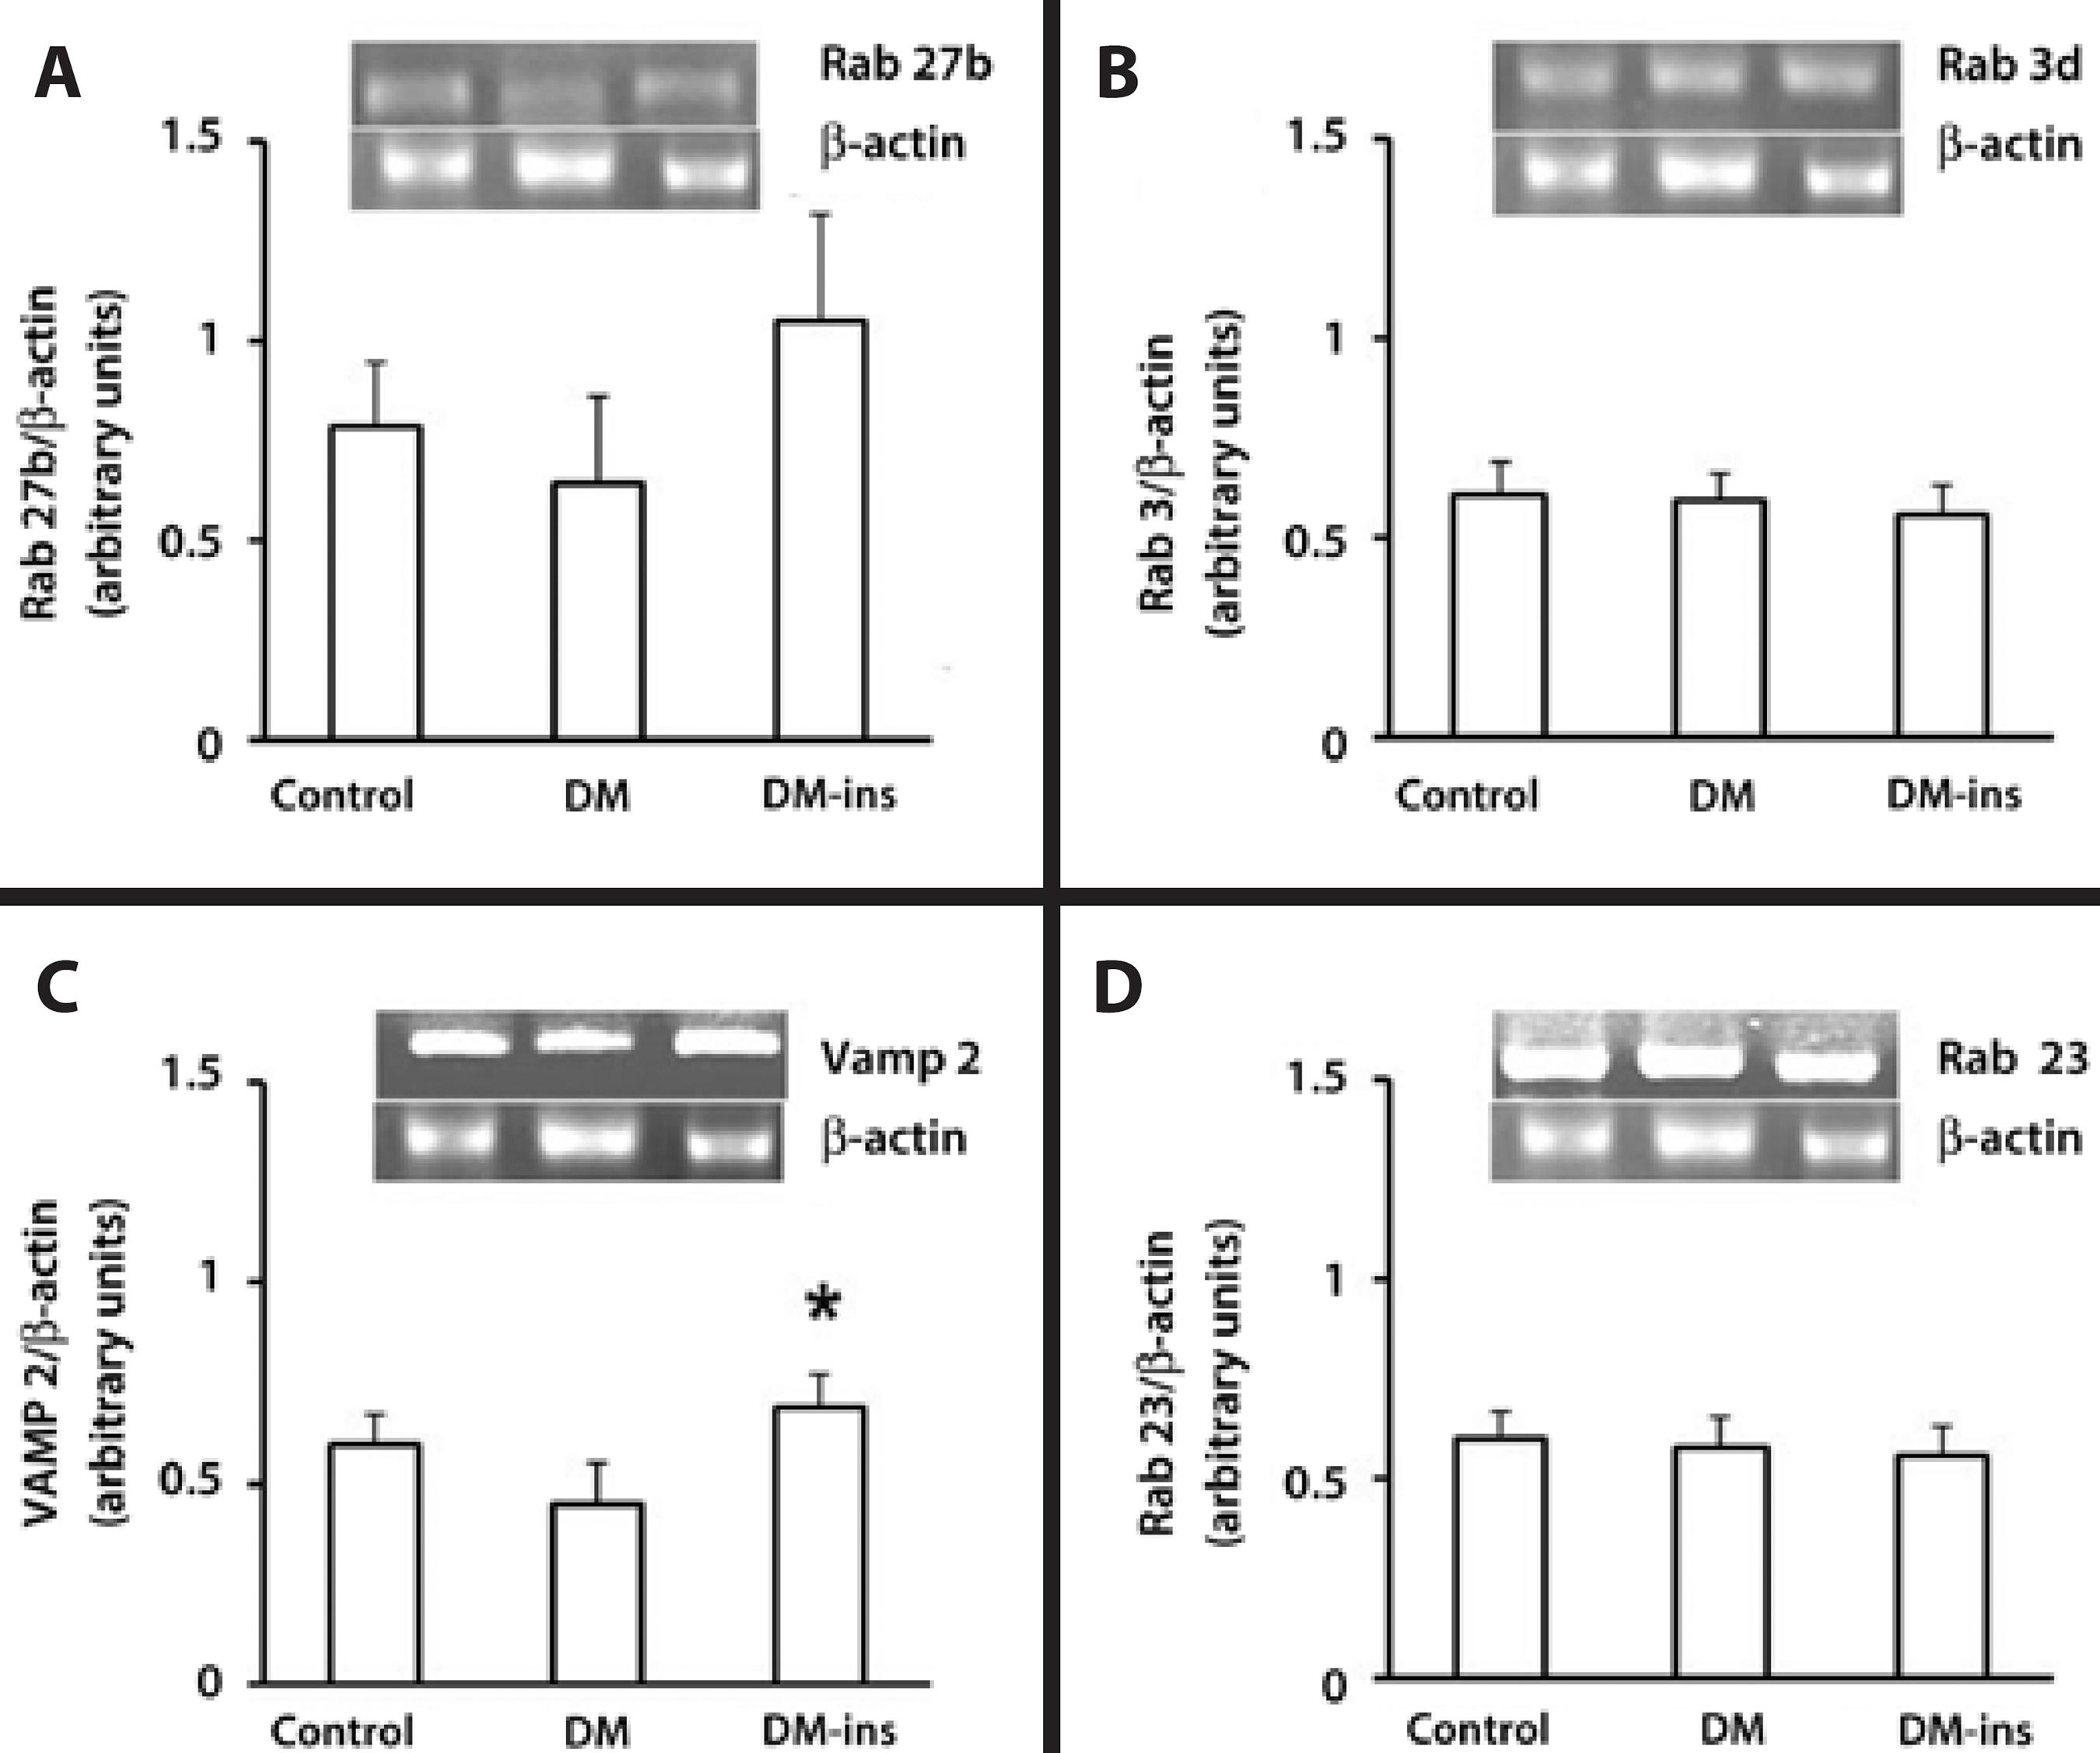
RT-PCR revealed that the Rab 3d, Rab 27b, and Rab 23 mRNA levels were not changed by DM or insulin treatment, but the Vamp 2 level was higher in the insulin-treated group (Figure 3).

Figure 3 Insulin replacement increased the mRNA content of Vamp2. RT-PCR of (A) Rab27b, (B) Rab3d, (C) Vamp2, and (D) Rab 23 in LGs of the control, DM, and insulin-treated DM rats. Densitometric arbitrary units were normalized to β-actin expression and were expressed as mean ± standard error of the mean (*denotes p value <0.05). Results are representative of three independent experiments (n=5/group/experiment).
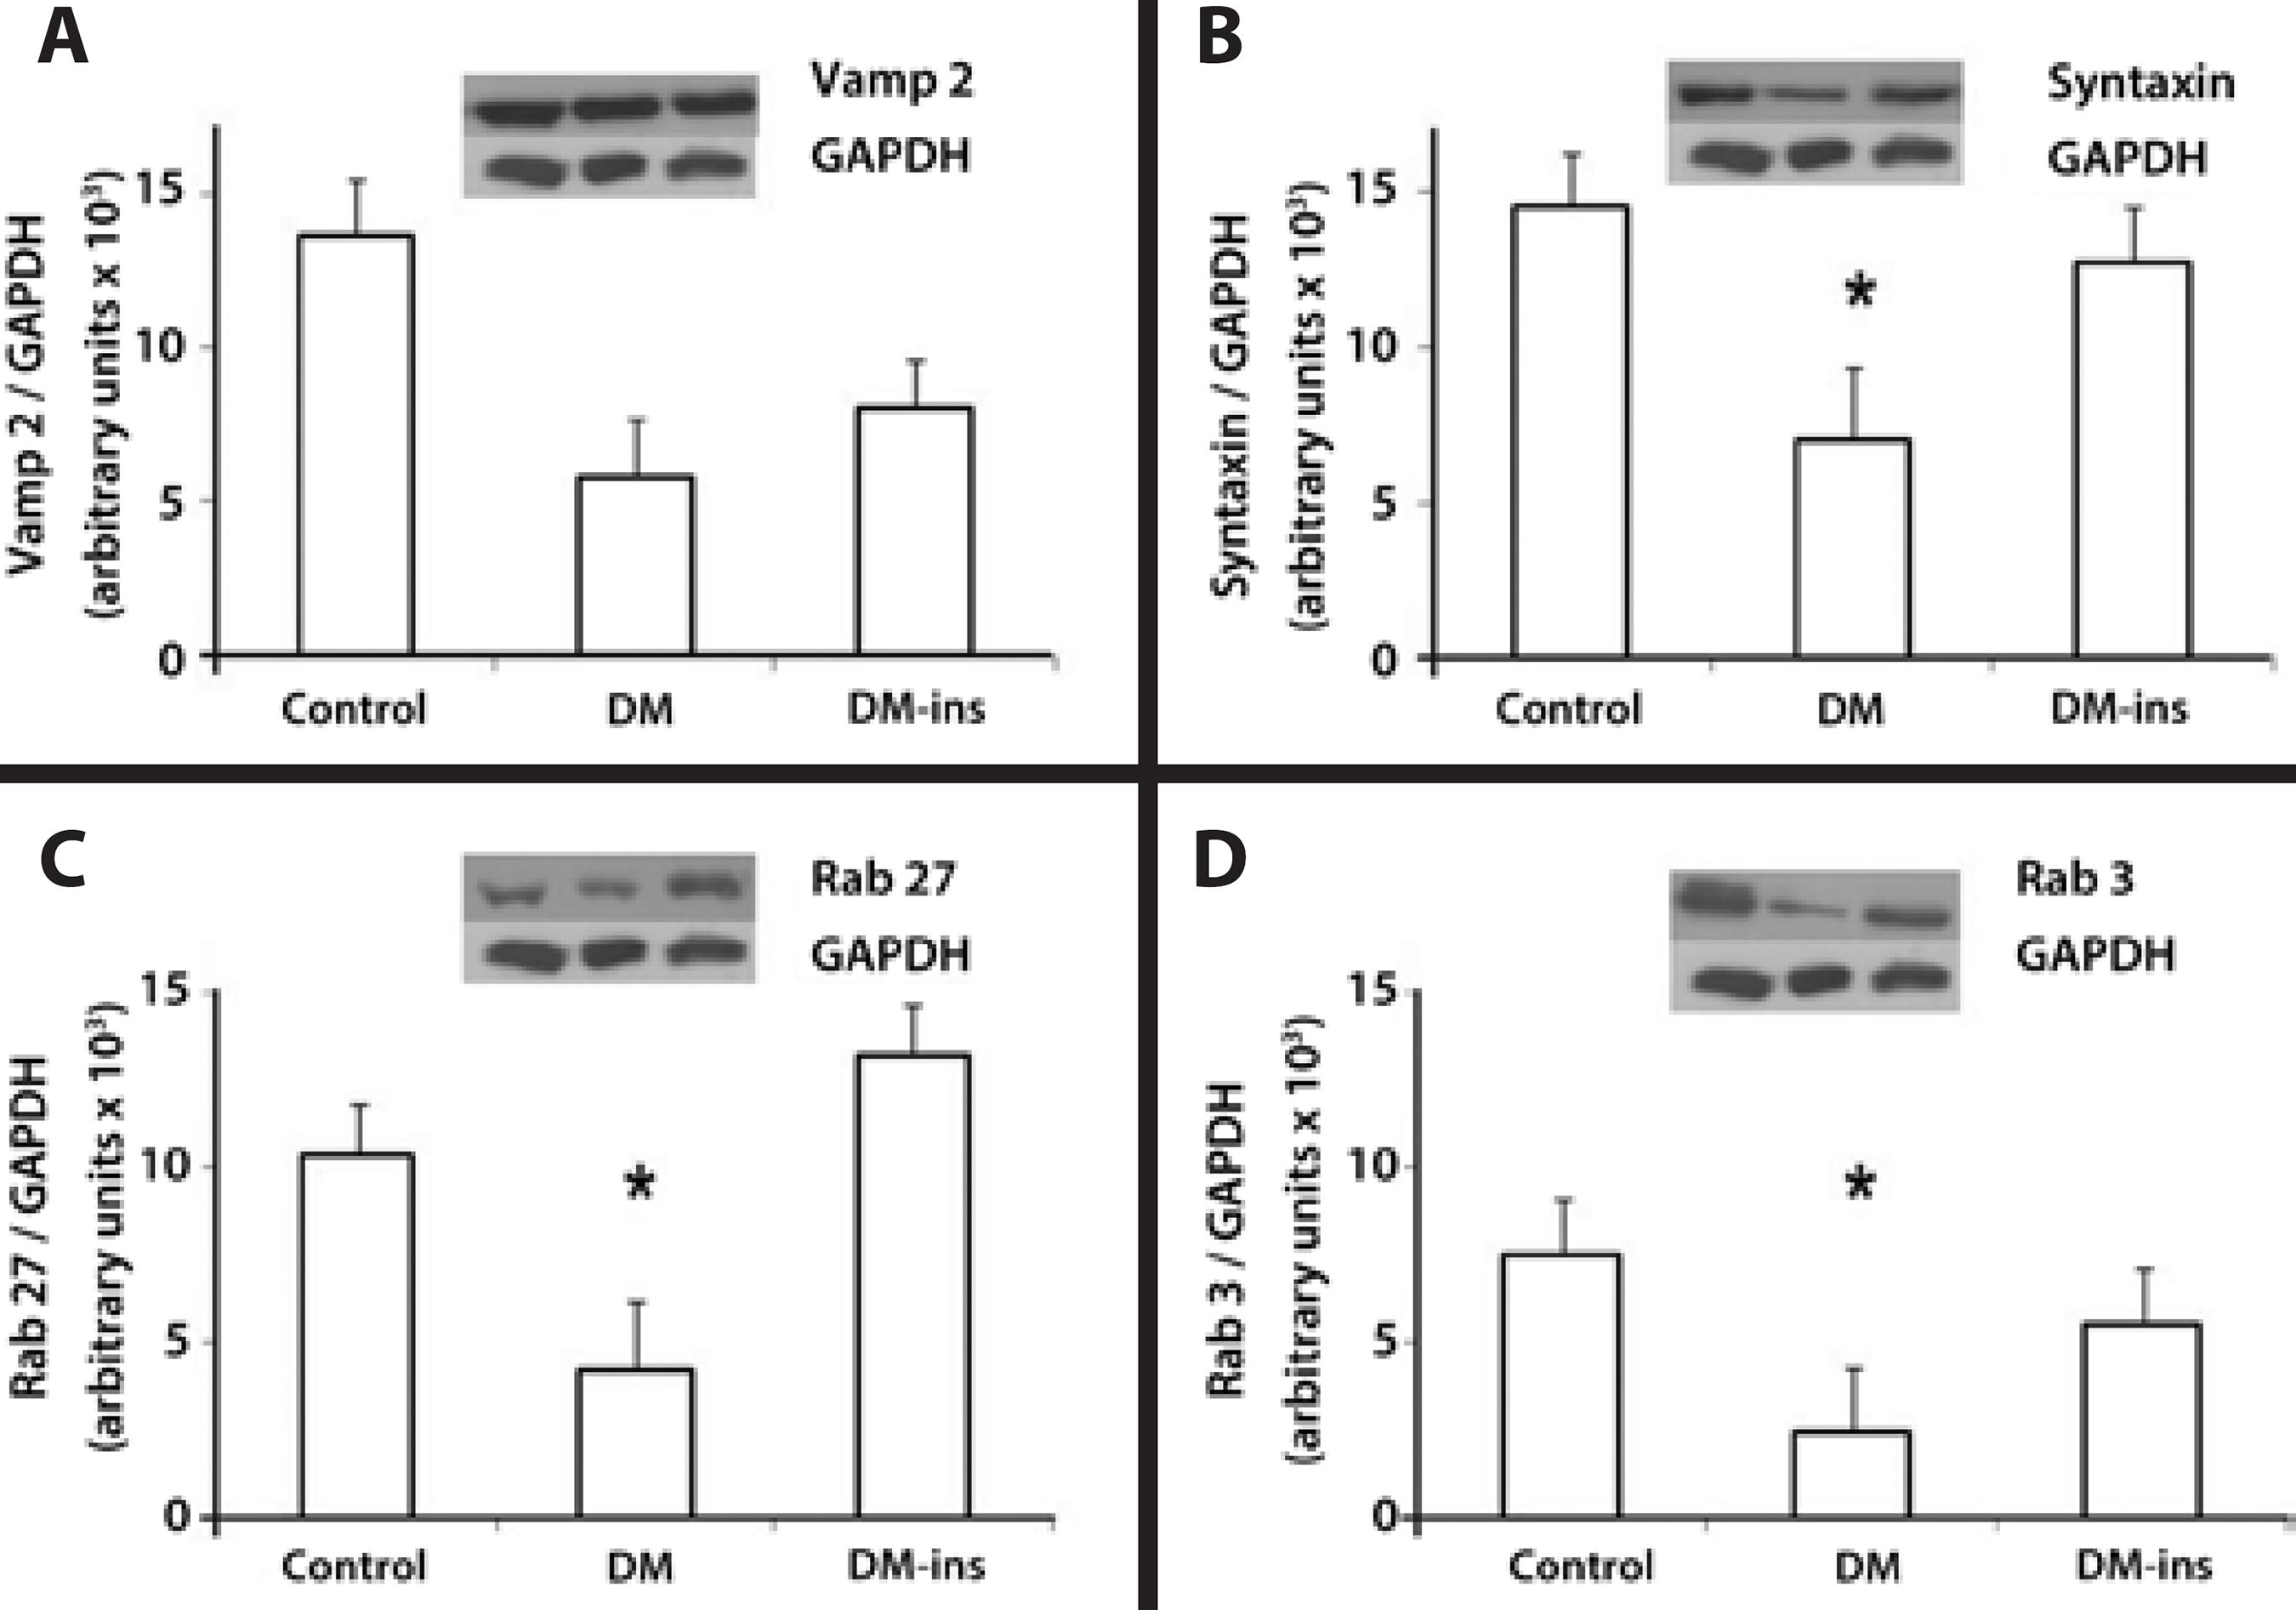
Western blotting revealed that the expression of syntaxin 1, Rab 27b, and Rab 3d were significantly lower in the DM group, whereas the decline in Vamp 2 was insignificant. However, insulin treatment prevented the declines in Rab 27b, syntaxin 1, and Rab 3d expression as they remained at levels similar to those in the control group (Figure 4).

Figure 4 Impaired expression of SNARE and Rab proteins was rescued by insulin treatment in LG of diabetic rats. Western blotting of (A) Vamp2, (B) syntaxin 1, (C) Rab27b, and (D) Rab3d in LGs of control, DM, and insulin-treated DM rats. Densitometric arbitrary units were normalized to GAPDH expression. Data are expressed are means ± standard error of the mean; * p<0.05. Results are representative of three independent experiments (n = 5/group/experiment).
DISCUSSION
The present study indicated that there was a correspondence between changes in the secretory mechanisms in LGs that were isolated from DM rats and the dry eye syndrome manifestations. Such an insight will provide a better understanding of dry eye pathophysiology(7,12,21). The major current finding was that lower intracellular transport protein expression levels in the DM group were associated with declines in delimited SV density and their ultra-structural appearance of the acinar apical cell membranes.
Different animal models of DM have found that LG secretory product content changes can accompany OS neuronal and structural damage(24). Taken together, the present findings, in particular, the similar levels of ACh among the diabetic and control groups, suggested that the damage in the signaling machinery of diabetic LG preceded the neurogenic damage to the LG and OS(25). These results are consistent with a previous study where LG synaptic junctional ultrastructure of the DM rats were preserved after 4 weeks of disease, although the insulin signaling cascade was already impaired just 1 week after DM onset(8,26).
Although animal models in general have some limitations in fully simulating a disease condition (e.g., dry eye syndrome), in streptozotocin-diabetic rats, these structural changes were described in the secretory granules of the acinar cells of LGs along with the functional impairment(24). Moreover, in different models of diabetic rodents, mechanisms other than those described here triggered declines in tear secretion and corneal epithelial damage associated with inflammation, lower proliferative capacity, and oxidative damage(27).
The fact that in LGs of DM rats there is a discrepancy between the declines in Rab 3d and Rab 27 protein expression and the lack of changes in their mRNA expression suggested that DM promoted changes at a post-transcriptional level. They may be caused by a reduction in translational events or a decline in the protein half-life. Such decreases could be attributable to hyperglycemia or a secondary vascular disturbance(28).
In an aging rodent, which is another model of the dry eye syndrome, similar alterations in SV appearance and declines in their density were associated with lower Rab 3d levels(20). Similar to the DM model used here, this model had high levels of oxidative stress and insulin resistance(19,21). As in that study, we were unable to identify syntaxin 1 at the mRNA levels, but detected it with Western blotting. A possible explanation was that the antibody that we used cross-reacted with another LG acinar cell syntaxin isoform, which we did not probe for at the mRNA level.
A recent publication revealed that SV were highly expressed in human LGs with dry eye induced by prolonged visual display terminal exposure compared to controls and Sjögren's syndrome patients. Taken together, those findings indicated that distinct diseases differentially affected the LG secretory mechanisms, as did evaporative, inflammatory, and diabetic dry eye. In agreement with those findings in humans subject to video display terminals or Sjogren's syndrome, the present work revealed that Vamp-2 increased in a DM model of dry eye and the SV were dimorphic; their localization was changed in the acinar cells of LG. This observation may indicate that therapeutic measures to prevent such changes could compensate for the abnormal secretory changes induced by DM. Insulin induced multiple responses through a myriad of interacting intracellular signaling cascades(29). It was demonstrated that either systemic insulin or topical treatment prevented LG damage and reduced ocular surface damage in DM animal models with dry eye(21). In the present work, systemic insulin was sufficient to protect against body and LG weight loss due to increases in catabolism and more severe SV content and ultra-structural changes along with modified secretory protein profiles(30).
In conclusion, the present work demonstrated that the LG secretory impairment secondary to DM was involved in reducing the expression of some Rab and SNARE protein family members that were responsible for intracellular SV trafficking that could be prevented by insulin treatment. The consequent reduction in tear secretion and content in the untreated DM rats may help to explain early ocular surface epithelial damage in DM(21). Moreover, the present findings may help to identify new therapeutic measures in DM for use in the dry eye syndrome, including insulin hormone therapy.
Ethical standards
All experimental procedures adhered to the Principles of Laboratory Animal Care (NIH publication no. 85 to 23) and the ARVO Statement for the Use of Animals in Ophthalmic and Vision Research and were approved by the committee on animal experimentation of the School of Medicine at Ribeirão Preto, University of São Paulo.


 English PDF
 Print
Print
 Send this article by email
 How to cite this article
 Submit a comment
 Mendeley
 Scielo
 Pocket
 Share on Linkedin

