INTRODUCTION
Tumor necrosis factor alpha (TNF-α) is an inflammatory cytokine derived from T cells and macrophages, involved in the regulation of cellular apoptotic activity(1,2). Despite having a critical role in controlling inflammatory processes in the human body, raised levels of TNF-α have been associated with cellular and vascular malformations, edemas, and neurovascular degeneration(1,3,4). For instance, patients with non-infectious uveitis demonstrate increased levels of TNF-α, suggesting that TNF-α is a key mediator of uveal inflammation(5-7). Therefore, suppression of TNF-α activity through antagonist drug administration offers a promising treatment for patients with ocular inflammatory diseases(2,8-10).
Adalimumab is a recombinant human monoclonal antibody specifically inhibiting TNF-α activity. Systemic use of TNF-α inhibitors is widely recognized as a treatment for autoimmune(11) and rheumatic diseases(12). Subcutaneous adalimumab administration shows promising clinical improvement in patients with refractive uveitis(13) and macular edema secondary to non-infectious uveitis(14). However, systemic administration of adalimumab and other anti-TNF agents has produced several side effects(15). Thus, the use of intravitreal injection is the preferred method for treating ocular diseases because it provides higher drug concentrations with fewer injections of low dosage, preventing the risk of systemic exposure. However, few studies on the safety of intravitreal use of adalimumab have been published; for these, electroretinography and histological techniques have been used(14,16-18). These techniques cannot detect toxicity at the submicroscopic level and therefore we tested new methods to address intravitreal adalimumab toxicity at the cellular and molecular level in this study.
The purpose of this study was to evaluate, for the first time, the toxicity of adalimumab intravitreal administration in an animal model using cytological and molecular techniques. We administered adalimumab intravitreously in rabbits to obtain live retina samples, with a view to determine apoptotic activity at the cellular level using flow cytometry. At the molecular level, we assed DNA damage using comet assays and expression of apoptosis-inducing caspases using quantitative real-time polymerase chain reaction (qPCR).
METHODS
Medical procedures and experimental design
Eighteen New Zealand albino male rabbits weighing 2.5-3.0 kg were used to analyze cytotoxic and genotoxic effects of intravitreal adalimumab injections. The experimental procedures followed the ARVO statement for the Use of Animals in Ophthalmic and Vision Research as well as our institutional guidelines. Animals were anesthetized before performing any medical procedures. They were subjected to dilated fundus examination to determine overall ocular health at the beginning of the experiment and after 30 and 60 days using eye drops of 10% phenylephrine (Allergan® Pharmaceuticals, San Diego, CA, USA) and 1% tropicamide (Mydriacyl®, Alcon Laboratories, Fort Worth, TX, USA). We used an indirect binocular ophthalmoscope (Welch Allyn, Skaneateles Falls, NY, USA) with 20 diopter lenses (Volk Optical, Mentor, OH, USA) to examine the vitreous cavity, retina, and opacity of the medium. Only animals with healthy eyes were selected for the study.
Animals were randomly allocated to three groups: group 1 was the control (no injections, n=2), group 2 received adalimumab injections (n=8), and group 3 placebo injections (n=8). Animals in group 2 were administered 0.1 mL (0.5 mg) of adalimumab (Humira®, Abbott, Abbott Park, IL, USA) via the right eye. The procedure was performed by inserting a 30-gauge needle via pars plana, 1-mm distant from the limbus. The treatment was reapplied after 30 days. Animals in group 3 were administered the same volume (0.1 mL) of a balanced saline solution (BSS®, Alcon, Fort Worth, TX, USA) using the same method, which was also reapplied after 30 days.
Retina dissection and analysis
To perform the biological assays, the retinas of all study animals were dissected. Immediately after eye enucleation, an ocular dissection was performed and retina samples were obtained by the dislocation method. Retinal cell samples were analyzed by flow cytometry, comet assays, and qPCR at the Molecular Genetics and Cytogenetic Laboratory at the Federal University of Goiás, Goiânia, Brazil.
Flow cytometry
Death of retinal cells was determined using an Annexin V-FITC Apoptosis Detection Kit (Sigma-Aldrich, St. Louis, Mo, USA), according to the manufacturer’s instructions. Detection of apoptosis was based on the binding properties of phosphatidylserine annexin to the cell membrane (Annexin V+ to early and Annexin V- to late apoptotic cells), whereas the detection of necrosis was based on the binding properties of propidium iodide to cell DNA. Isolated cells (100 µL) were suspended in 400 µL of buffer solution and subsequently 5 µL of Annexin and 1 µL of propidium iodide were added. Flow cytometry analyses were performed using a FACSCaliburTM (BD Biosciences, San Jose, CA, USA) flow cytometer in conjunction with the software Diva ModFit®.
Comet assay
DNA damage was assessed by comet assays, a single-cell gel electrophoresis method, as previously described(19). For the comet assays, retinal samples were placed in Falcon® tubes with 500 µL of 100% trypsin solution (Cultilab, Campinas, SP, Brazil) for 5 min. Subsequently, 500 µL of culture medium supplemented with fetal bovine serum (10%) was added. A 20-µL cell suspension was homogenized with 100 µL of low-melting-point agarose (0.5%) spread onto microscope slides pre-coated with normal-melting-point agarose (1.5%). After 10 min at 4°C, slides were immersed in a cold lysis solution (2.4 M NaCl, 100 mM EDTA, 10 mM Tris, 10% DMSO, and 1% Triton-X, pH 10) for 24 h. After lysis, slides were placed in an electrophoresis chamber and covered with electrophoresis buffer (300 mM NaOH/1 mM EDTA, pH >13) for 20 min to allow for DNA unwinding.
The electrophoresis proceeded for 20 min (25 V and 300 mA). Subsequently, slides were submerged for 15 min in a neutralization buffer (0.4M Tris-HCl, pH 7.5), dried at room temperature, and fixed in 100% ethanol for 5 min. Slide staining was performed immediately before analysis with ethidium bromide (20 µg/mL). Slides were prepared in duplicates and 100 cells were screened per sample (50 cells from each slide) using a fluorescence microscope (Leica, Wetzlar, Germany) interfaced with a computer.
Nucleus analysis was performed using the image software Comet Score ver. 15 (TriTek Corp., Sumerduck, VA, USA), according to the migration of DNA fragments as follows: class 0 (no damage), class 1 (little damage with a short tail length smaller than the diameter of the nucleus), class 2 (medium damage with a tail length one or two times the diameter of the nucleus), class 3 (significant damage with a tail length between two and a half to three times the diameter of the nucleus), and class 4 (significant damage with a long tail of damage greater than three times the diameter of the nucleus)(20). A damage index (DI) value was assigned to each comet assay according to formula (1), where n=number of cells in each class analyzed.
DI=(0 x n0) + (1 x n1) + (2 x n2) + (3 x n3) + (4 x n4) (1)
DI may range from 0 (completely undamaged; 100 cells x 0) to 400 (maximum damage; 100 cells x 4)(21).
qPCR
The molecular markers used to evaluate the apoptotic activity included the expression of the messenger RNA (mRNA) of caspase 8 (apoptosis initiator) and caspase 3 (apoptosis effector). Retinal cell mRNAs were extracted using TRIzol reagent (Sigma-Aldrich, St. Louis, MO, USA), according to the manufacturer’s instructions. Total mRNA (2 µg) was then used to produce complementary DNA (cDNA) using a random initiator (Applied Biosystems, Foster City, CA, USA) with a total reaction mixture of 20 µL. The primer sequences used were 5’-ACGAAACCTCCGTGGACGCAA-3’ and 5’-AGACCGGGACGACATTC CAGTG-3’ (185 bp) for caspase 3 and 5’-TGGCAGCAGATGATGACAA TGGTG-3’ and 5’-TGGAAGCACTGTCAGAAACAGCAC-3’ (135 bp) for caspase 8. The qPCR was performed using a Line-gene K Real-time PCR Detection System (Bioer Technology, Binjiang, China) in total volumes of 20 µL reaction mixture: 2 µL of cDNA, 10 µL of SYBR Green PCR Master Mix (LGC Biotecnology, Teddington, Middlesex, UK), and 2 µL of each primer (400 nM). The qPCR was initiated at 95°C for 40 thermal cycles of 15 min each, followed by 15 s at 55°C and 30 s at 72°C. All qPCR analyses were performed in triplicates.
Statistical analysis
Data was presented as mean ± SE (standard error). The cytotoxicity of adalimumab in the flow cytometry experiment was analyzed using a multivariate permutational analyses of variance (PERMANOVA). Data was first reassembled in a Bray-Curtis similarity matrix, after which unrestricted permutations of raw data were applied. PERMANOVA were conducted using Primer-e 6 PERMANOVA+1.0 software (Ver. 6.1.14). The genotoxicity of adalimumab measured by the comet assays (comet tail length and damage index) was analyzed using one-way fixed effect analyses of variances (ANOVA–SYSTAT Ver. 12). For the ANOVA, assumptions of homogeneity of variance and normality were assessed by scatter plots and normal curves of residuals, respectively(22). Finally, the expression of caspase 8 and 3 as measured by qPCR was also analyzed using PERMANOVA, with the same operational inputs used for the abovementioned cytotoxicity analyses above.
RESULTS
Cellular apoptosis and necrosis analysis
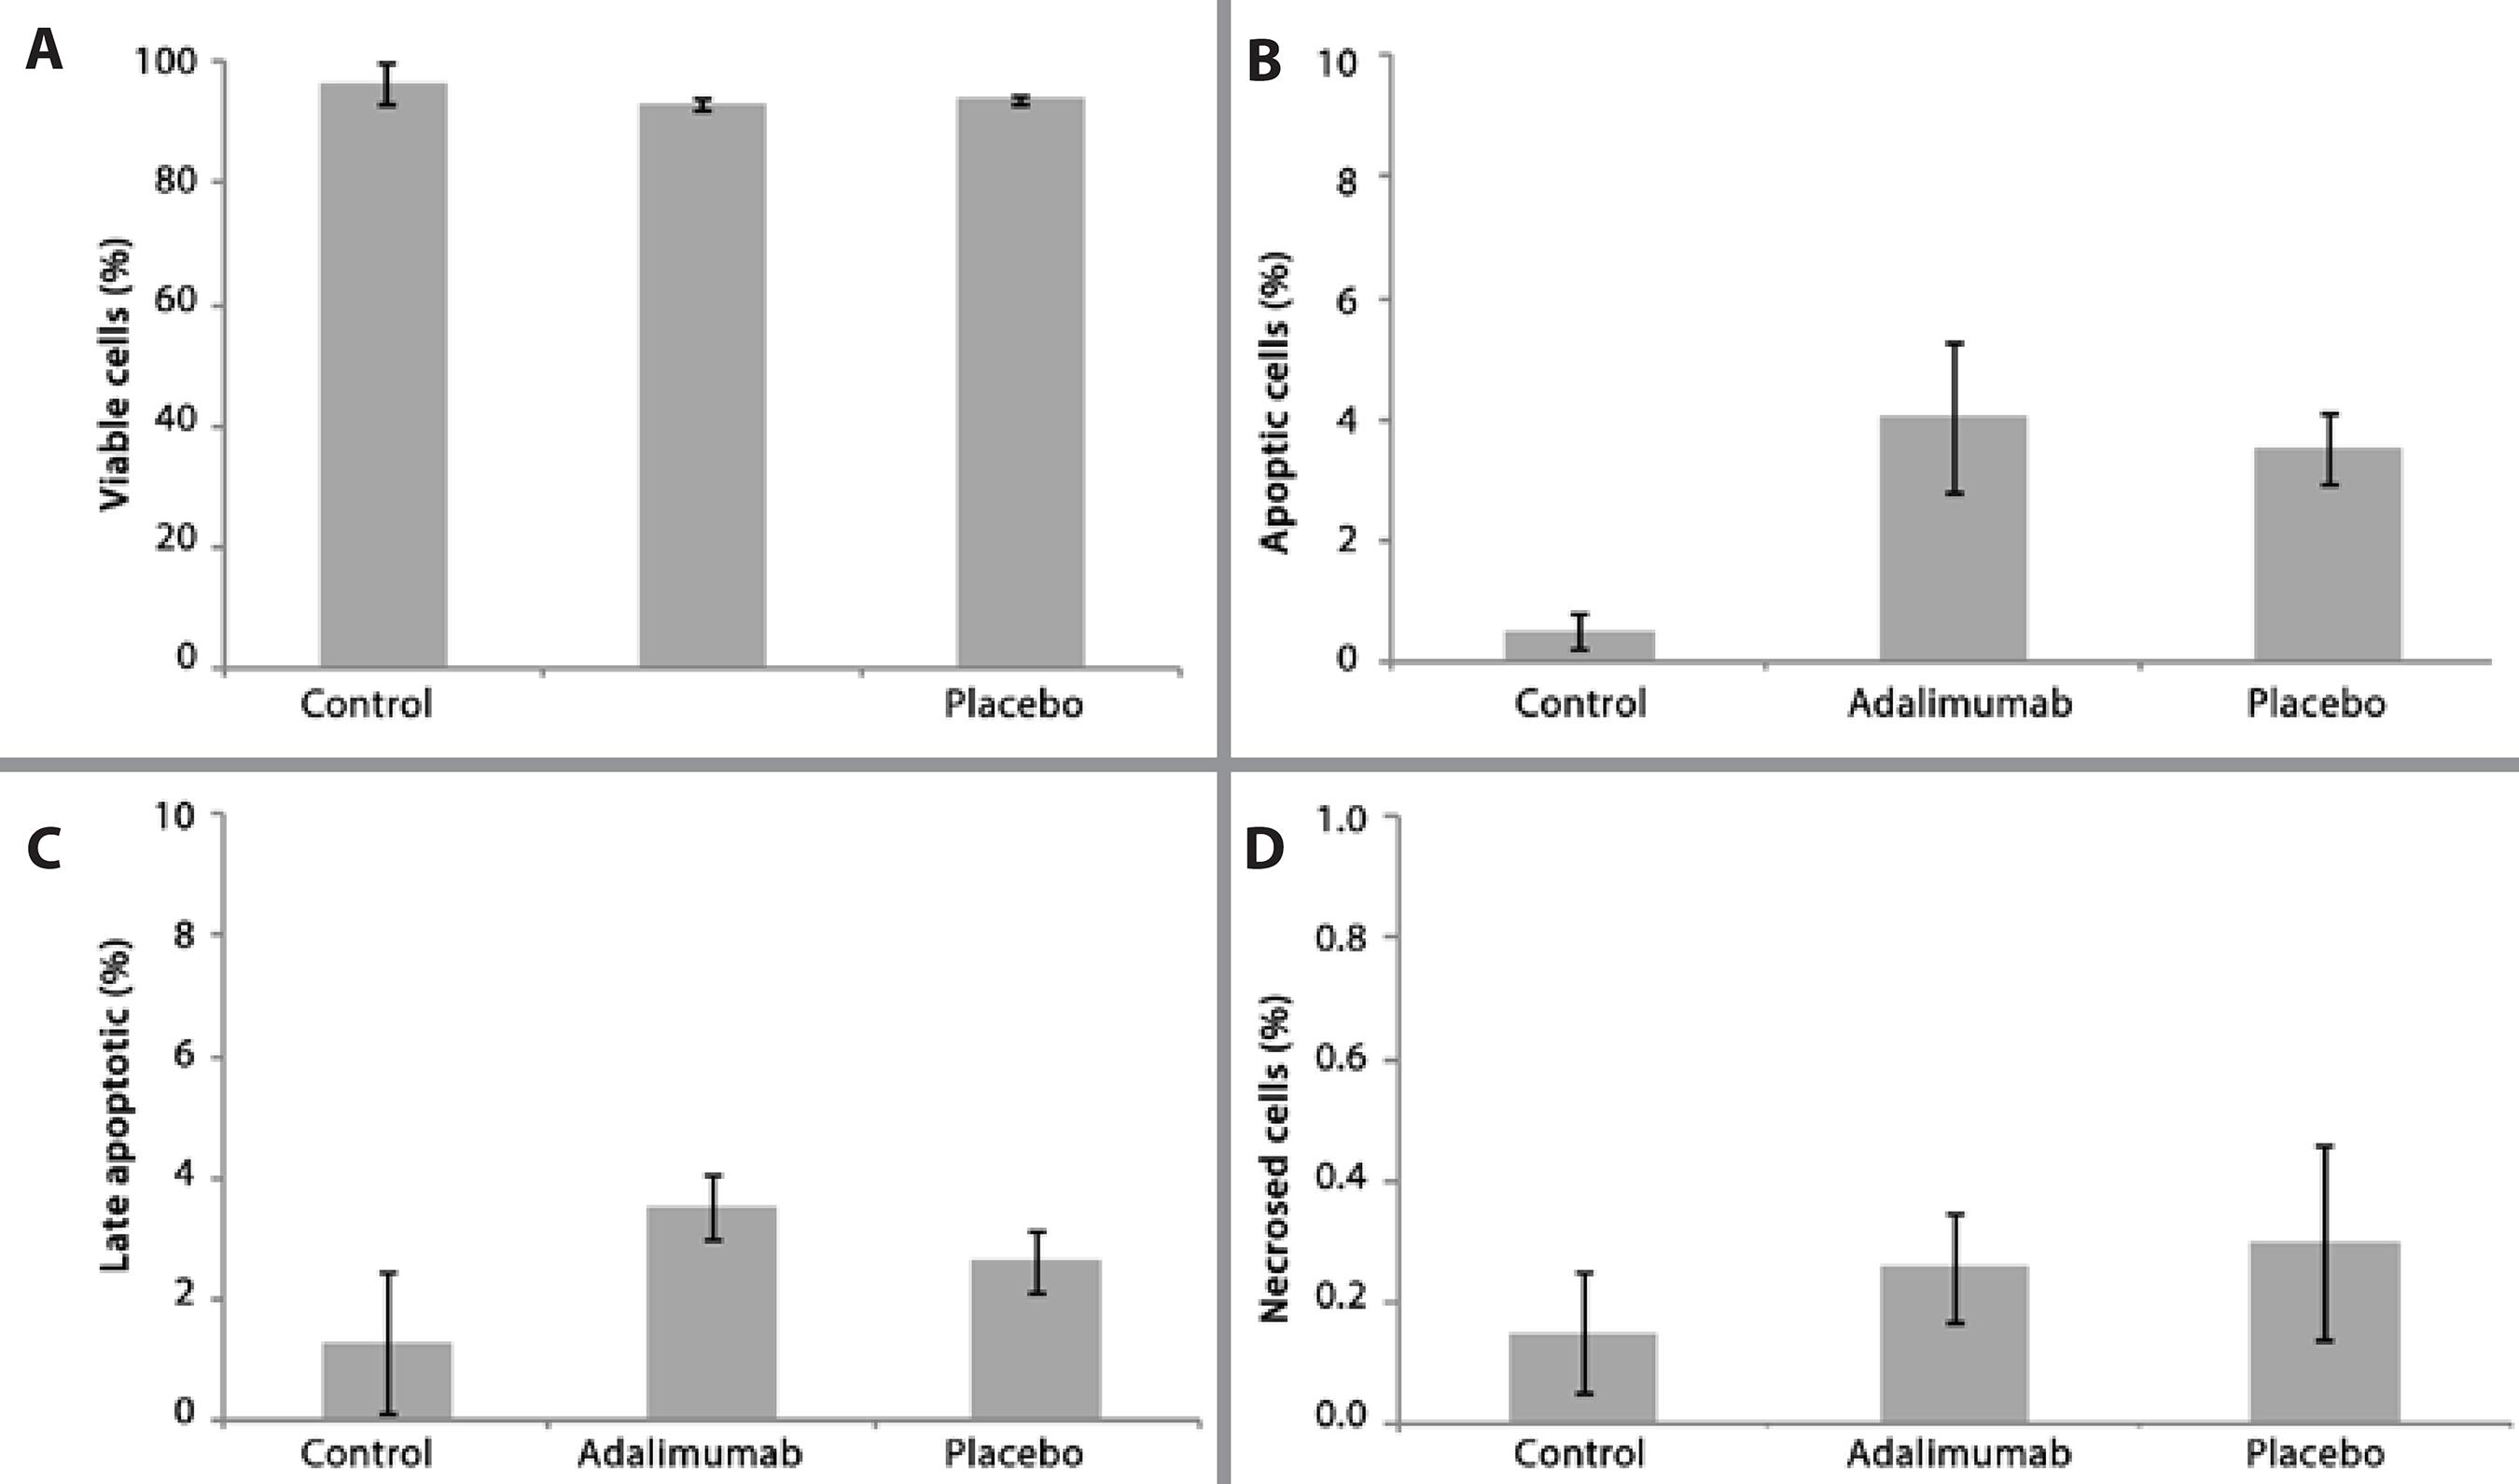
The parameters of cell viability, apoptosis, late apoptosis, and necrosis were determined by flow cytometry analysis. There were no significant differences in any of these parameters between the healthy (control), adalimumab injection, and the placebo injection groups (PERMANOVA, F4,29=0.859, p>0.05). The viability of retinal cells was similar for all groups, with over 90% viable cells detected by flow cytometry (Figure 1 A). The mean percentage of early and late cell apoptosis (Figures 1 B and 1 C respectively) was lower for the control group (0.51 ± 0.50 and 1.37 ± 1.16, respectively) than for both the adalimumab (4.05 ± 1.23 and 3.58 ± 0.52, respectively) and placebo (3.52 ± 0.58 and 2.65 ± 0.51, respectively) groups. However, no significant differences were detected. The proportion of cell necrosis detected by flow cytometry was very low, with values of 0.15 ± 0.12% for the controls, 0.26 ± 0.08% for the adalimumab group, and 0.30 ± 0.15 % for the placebo group (Figure 1 D).
DNA damage analysis
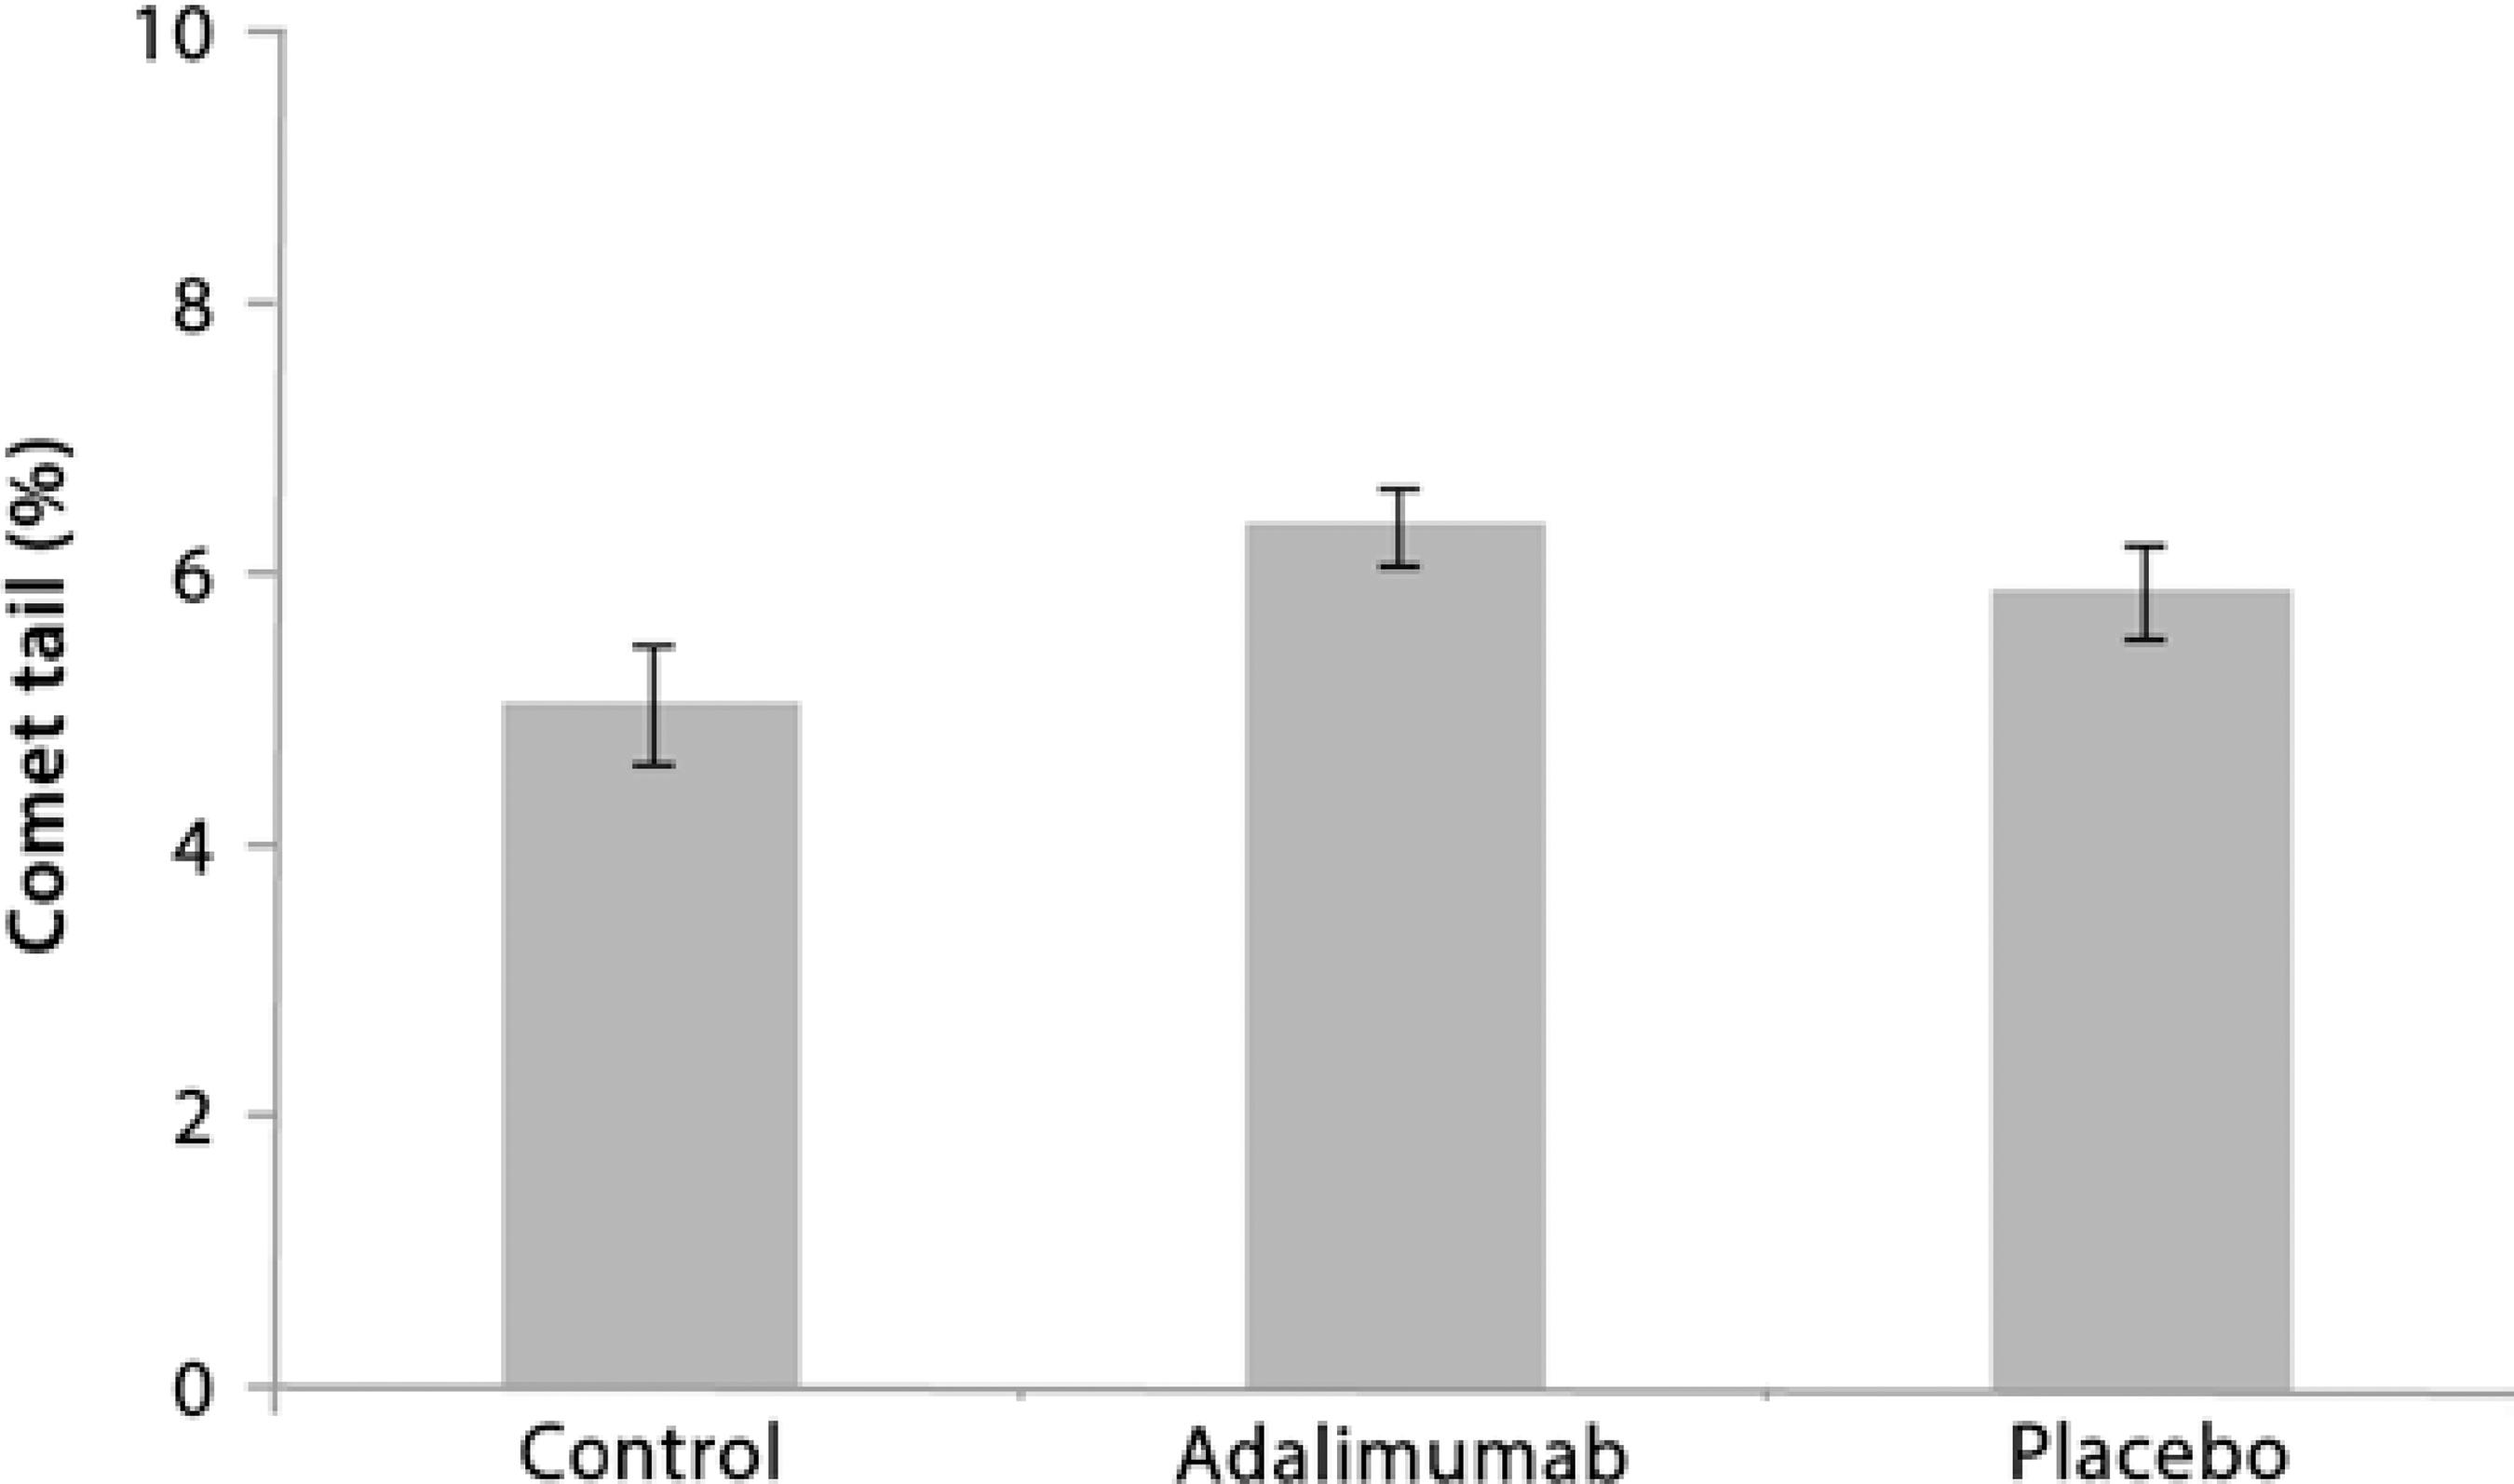
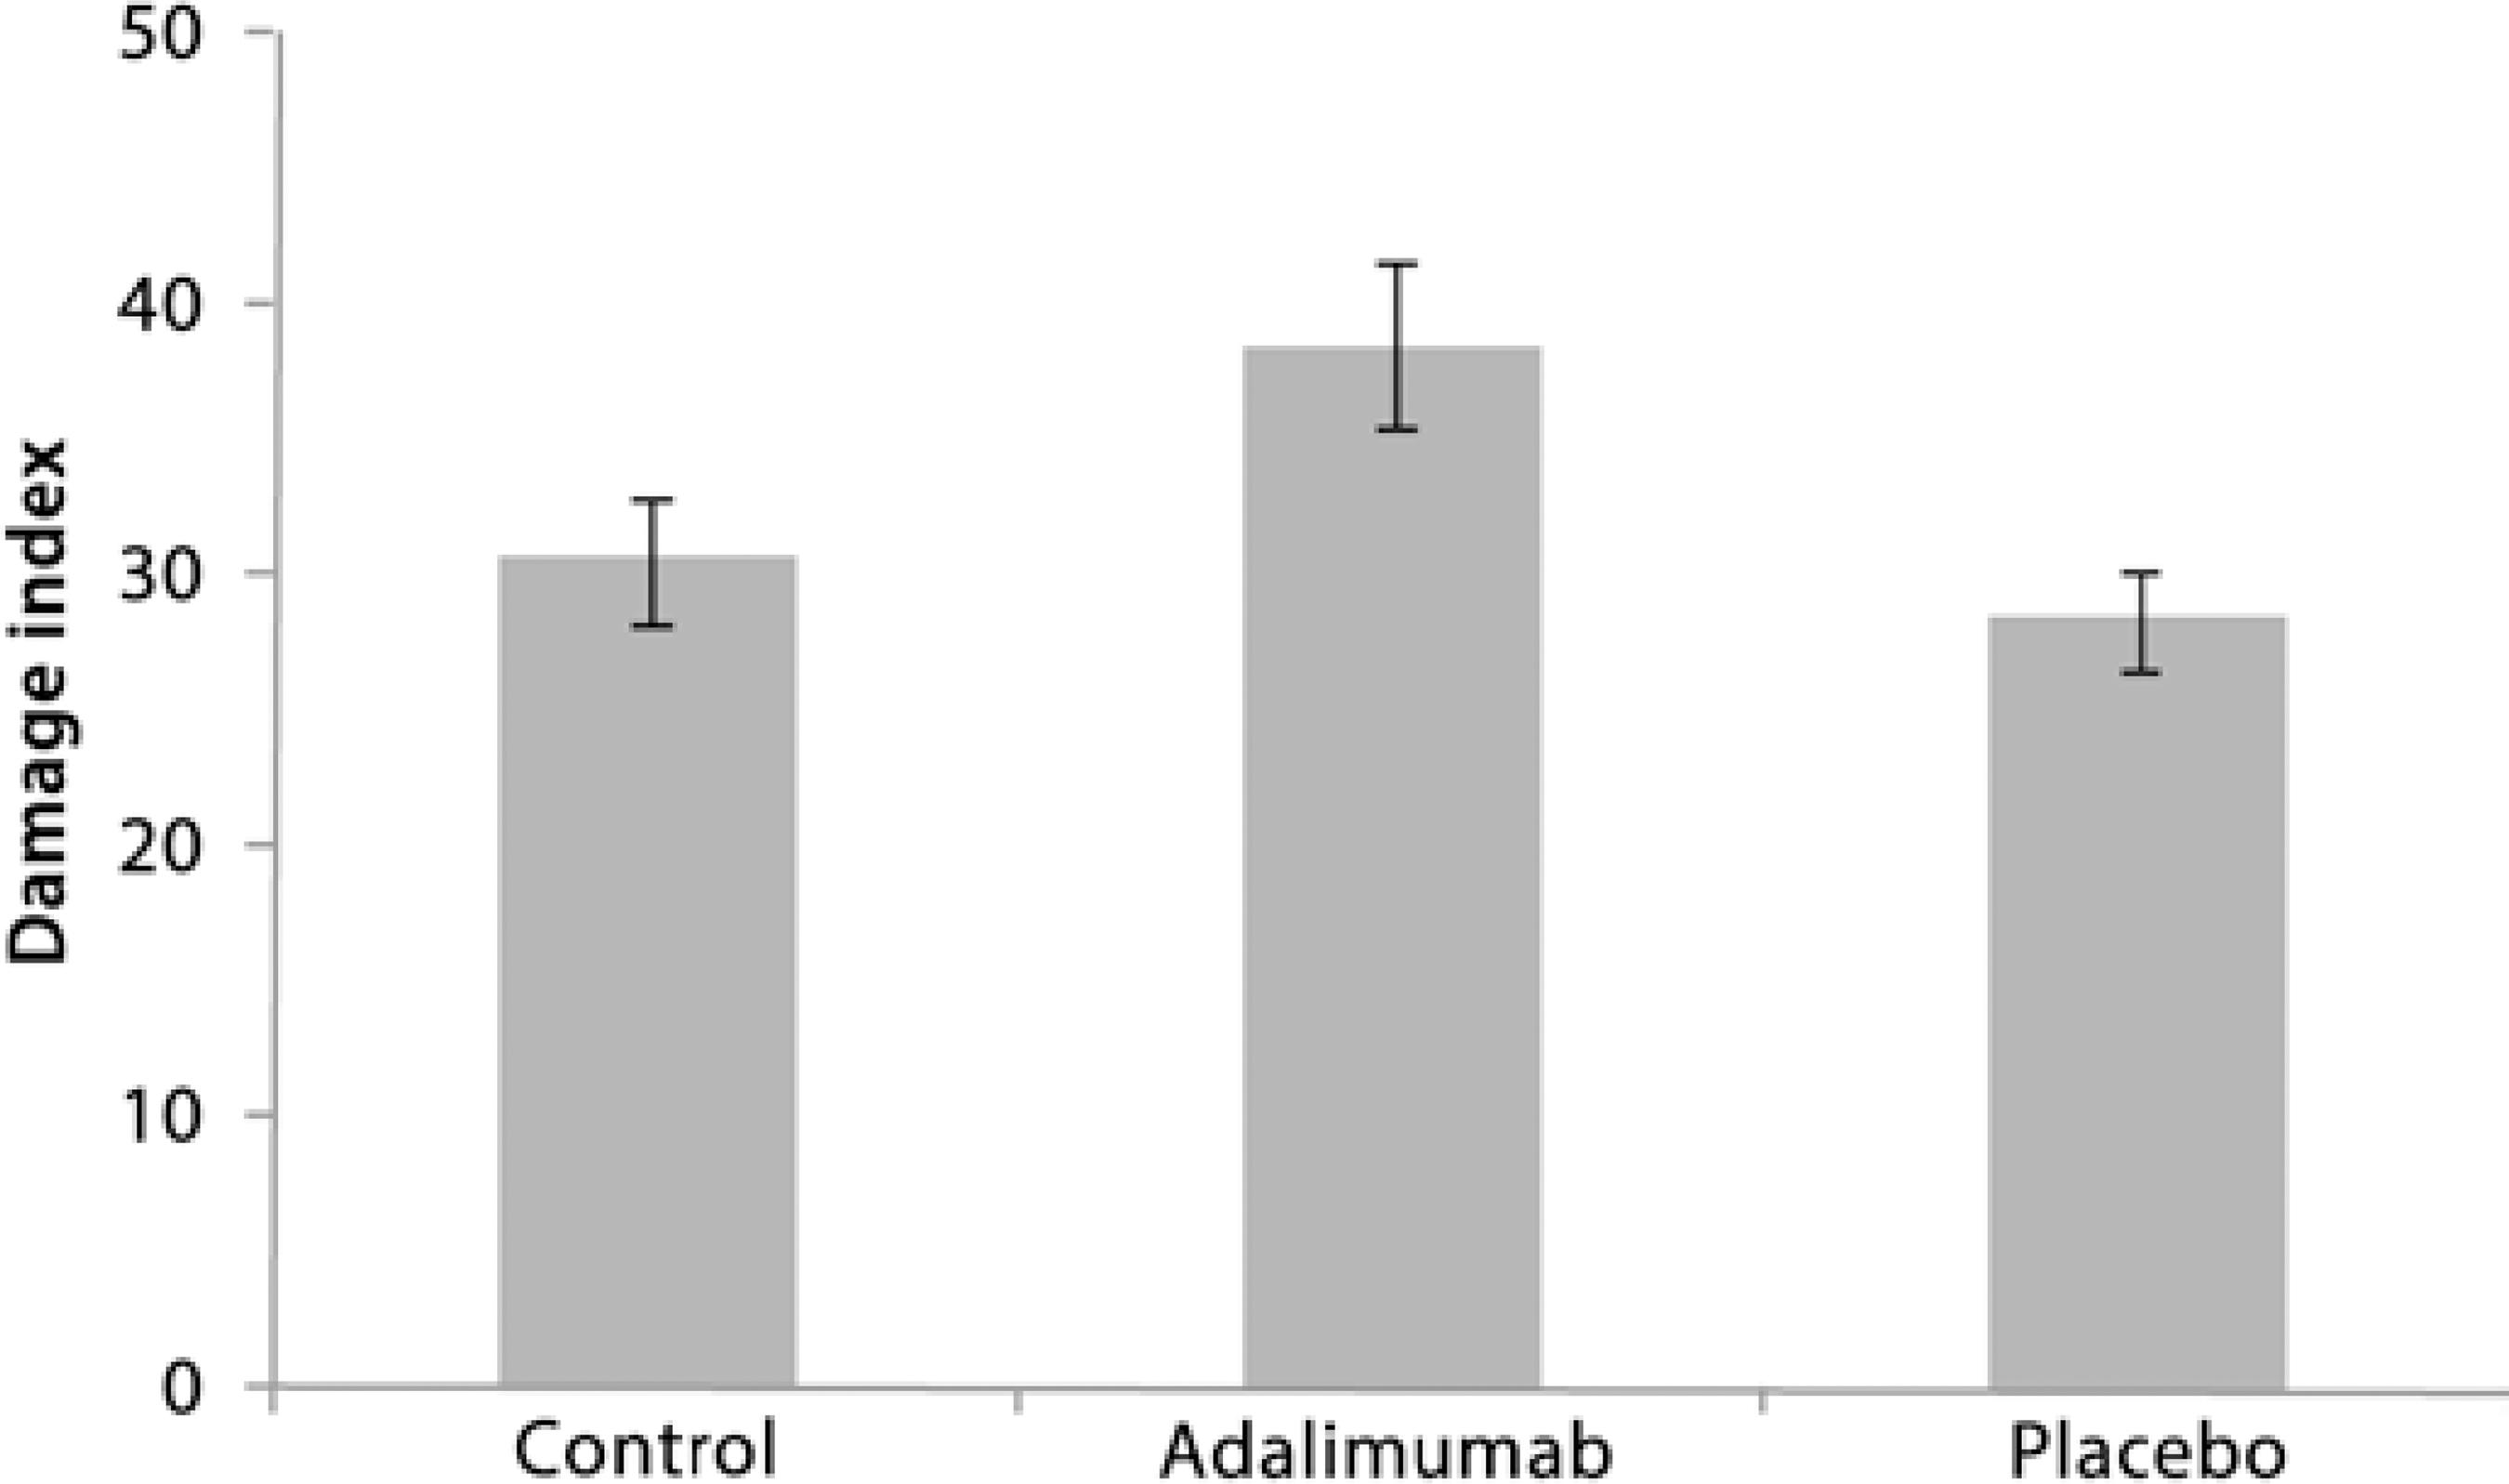
Low DNA damage was observed after the intravitreal injections with adalimumab and placebo. The comet assays showed that there was no significant difference in DNA damage (tail length) between the control, adalimumab, and placebo groups (ANOVA, F2,18=2.437, p>0.05, Figure 2). The percentage of tail length was similar at 5.0 ± 0.42 for the control group, 6.4 ± 0.28 for the adalimumab group, and 5.0 ± 0.36 for the placebo group (Figure 2). The DI was also low for all groups (<40), with no significant differences (ANOVA, F2,16=3.312, p>0.05) in DI between the controls (30.6 ± 2.3), the adalimumab group (38.6 ± 3.0), and the placebo group (28.5 ± 1.8; Figure 3).
Apoptosis-inducing caspases 8 and 3 expression analysis
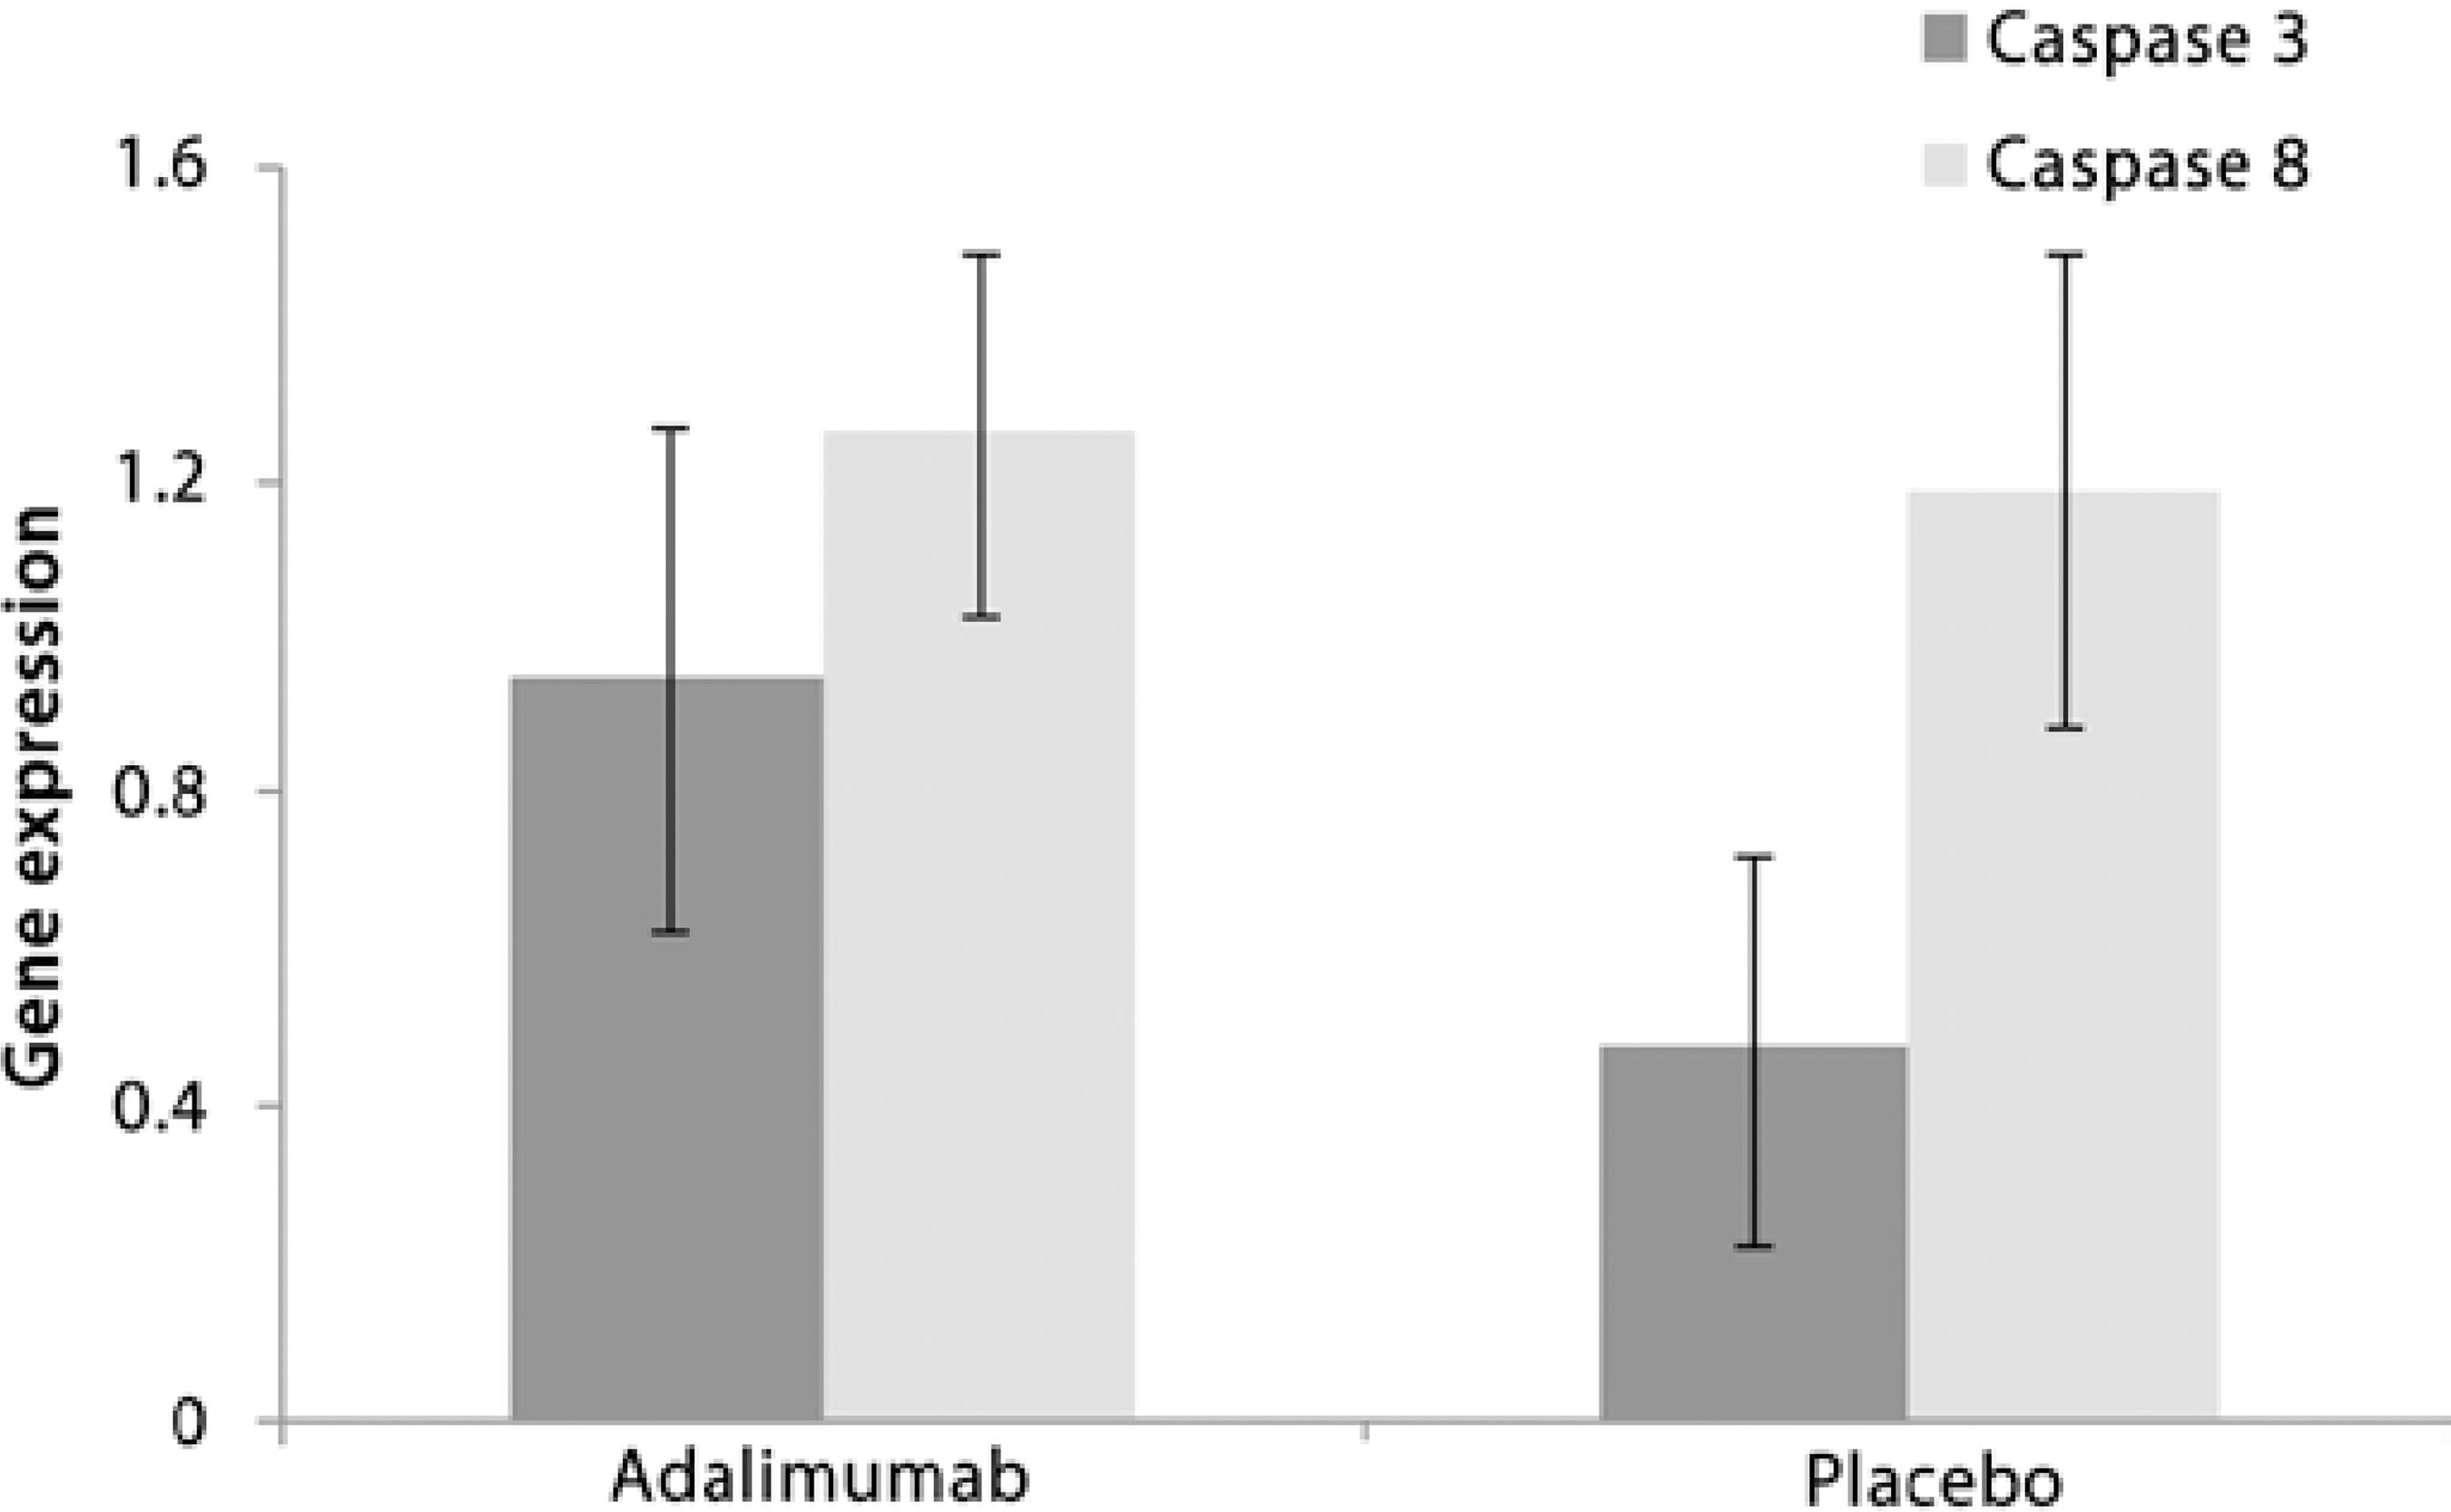
To determine the values of mRNA expression for both caspases (8 and 3) in retinal cells, we used healthy animals (controls) as a calibrator group with an absolute genetic expression value of 1, with values over and below representing higher and lower gene expression, respectively. There were no significant differences between the control, adalimumab, and placebo groups (PERMANOVA F2,18=0.8482 and p>0.05). Gene expression in the adalimumab group was 1.26 and 0.95 for caspase 8 and 3, respectively (Figure 4). For the placebo group, the values were 1.19 for caspase 8 and 0.48 for caspase 3 (Figure 4).
DISCUSSION
In this study, we detected no significant cytological or molecular toxicity to the retinal cells; therefore, these results provide strong evidence that adalimumab is safe for intravitreal treatment of non-infectious ocular inflammatory diseases. Our data show that adalimumab treatment results in only slight cytotoxic and genotoxic effects on rabbit retinal cells for up to 60 days, comparable with the effects observed in the control and placebo groups. Cellular apoptotic activity was very low with >90% viable retinal cells observed by flow cytometry. Furthermore, the comet assay and qPCR demonstrated that DNA damage was minimal and expression of the apoptosis-inducing caspases 8 and 3 was low.
The use of intravitreal adalimumab has been evaluated previously in animal models by dose dependence studies. The administration of doses up to 5 mg of adalimumab produced no functional or structural ocular toxicity(16-18). These studies evaluating adalimumab toxicity have, however, used electroretinography and histological methods, which cannot detect at sub-microscopic levels. Therefore, complementary studies using cellular and molecular techniques should be used for early detection of cytotoxic and genotoxic effects such as the onset of cellular apoptosis or expression of caspases. Furthermore, we used a longer time span of 60 days compared with the span of 14 or 42-days previously used. This allows a longer contact between the substance and the retina and more closely resembles the clinical situation.
Based on the systemic adalimumab administration(18), a study suggested that 0.5 mg may be the therapeutically appropriate dose for intravitreal treatment. Using flow cytometry analysis, we confirmed that a dose of 0.5 mg of intravitreal adalimumab conferred no cytotoxicity to the retinal cells. More than 90% of the analyzed cells were viable with a small proportion of apoptotic and necrotic cells in both the control and adalimumab groups. In contrast, other studies have demonstrated that adalimumab may increase cell apoptosis(23-25). However, these studies used subcutaneous administration, which requires a higher drug concentration (40 mg) compared with the low dose applied intravitreously (0.5 mg). Higher doses of adalimumab, subcutaneously or intravitreously, may be the cause of increased cell apoptosis and in some cases even necrosis(16).
Molecular assays have been increasingly used to determine genotoxicity of novel chemicals and pharmaceuticals(26). The comet assay is a microgel electrophoresis technique that measures DNA damage at single-cell level(19). Single-cell gel electrophoresis (comet assay) has proven to be a highly sensitive method to assess DNA damage induced by several agents(27). For example, TNF-α-induced experiments in pancreatic cells resulted in a 50% increase in comet tail length(28). The use of etanercept, another TNF-α antagonist drug, has also resulted in DNA damage as observed by comet assay(29). In our study, we observed only small increases in comet tail length in the adalimumab and placebo groups compared with the control group. Large molecules, such as monoclonal antibodies, have limited access to the genetic material via cellular membranes and generally promote low molecular damage(26). Therefore, the minimal DNA damage observed here shows that adalimumab confers no genotoxicity on retinal cells for up to 60 days.
Evaluation of the molecular mechanisms that induce apoptosis is also an effective strategy for drug genotoxicity evaluation. The process of apoptotic cell death involves the activation of caspase pro-teases. Caspase 8 is an initiator of cellular death signaling pathways, whereas caspase 3 is an effector caspase linked to the process of cellular destruction that accompanies apoptotic signals(24). The use of adalimumab and other anti-TNF agents such as infliximab may increase the expression of apoptosis-inducing caspases in response to drug administration in in vitro studies of human monocytes and in vivo animal studies(24,30). In this study, however, there were no significant increases in the expression of these apoptosis-inducing caspases in retinal cells in any of the treatment groups (adalimumab and placebo) compared with the control group. These contrasting results may reflect differences in drug administration type and suggest that intravitreal adalimumab treatment is a less toxic administration method than subcutaneous injections.
CONCLUSION
In conclusion, we have demonstrated that the use of adalimumab results in no detectable cytotoxicity and genotoxicity in rabbit retinal cells for up to 60 days after intravitreal administration, indicating that this treatment is a safe option applicable to human clinical studies that aim to determine the efficacy of adalimumab for various ocular inflammatory diseases where TNF is implicated. Finally, the use of cytological and molecular techniques provides early and more reliable detection of drug toxicity, offering new approaches in ophtomological research.


 English PDF
 Print
Print
 Send this article by email
 How to cite this article
 Submit a comment
 Mendeley
 Scielo
 Pocket
 Share on Linkedin

