INTRODUCTION
Astigmatism is a visually disabling refractive error, and at least 15%-20% cataract patients have corneal astigmatism of ≥1.50 diopters (D)(1).
One way to correct astigmatism simultaneously during cataract surgery is to place limbal relaxing incisions (LRIs)(2,3). It is possible, however, that late corneal biomechanics may play an unfavorable role in refractive outcomes over time(4). Toric intraocular lens (IOL) implantation is another valuable option for astigmatism correction in cataract patients. Undesired rotation of the toric IOL is the main problem associated with this method. Approximately 1 degree of off-axis rotation results in a loss of up to 3.3% in expected cylinder correction(5).
Vectors are mathematical expressions that combine values for magnitude and direction. Astigmatism, with cylinder power and axis (refractive) or magnitude and meridian (corneal), fits such a description(6,7). The Alpins method is a vectorial analysis method that allows determination of the effectiveness of a specific treatment for astigmatism. Such methods have been used by several authors to analyze astigmatic changes induced by different surgical approaches such as excimer laser refractive surgery, LRI(3,8-11), and toric IOL implantation(1,12,13).
In light of the advantages and limitations of each approach, determination of the more superior treatment remains controversial(14). This study compared LRI placement and toric IOL implantation for the treatment of preoperative astigmatism during phacoemulsification using both nonvectorial (predictability, safety, and efficacy indices(15) and vectorial analyses.
METHODS
This longitudinal, observational case series assessed 31 consecutive cataract patients with preoperative corneal astigmatism of 0.75 D-2.50 D in both eyes. Patients were randomly assigned using the Microsoft ExcelTM "=RANDBETWEEN(1;2)" function into two phacoemulsification groups: a toric IOL group, which received toric IOLs in both eyes (model AcrySof ToricTM, AlconTM, Inc.), and an LRI group, which received spherical IOLs (AcrySof NaturalTM, AlconTM, Inc.) associated with LRI placement in both eyes. All patients provided written informed consent after they were provided with an explanation about the nature of the study and its potential complications, in accordance with the tenets of the Declaration of Helsinki. All surgeries were performed between May 2010 and June 2012.
Inclusion criteria were age >40 years; visually significant cataract, defined as spectacle distance corrected visual acuity (SDCVA) worse than Snellen 20/40 (LogMAR scale of 0.3); regular corneal astigmatism ranging from 0.75 D to 2.50 D; and pharmacological mydriasis of at least 6.0 mm (measured at the slit lamp) to facilitate proper intraoperative visualization of axis marks on the surface of the toric IOL.
Affected eyes with a history of previous surgery, pterygium, ocular disease that would lead to poor postoperative corrected visual acuity (corneal scarring, uveitis, advanced glaucoma, neuroophthalmic disease, and significant macular disease or other retinopathy), and/or zonule or pupil abnormalities were excluded.
Before surgery, all patients underwent complete ophthalmological evaluation by an examiner other than the surgeon (G.F.), including manifest refraction and SDCVA, slit lamp examination, applanation tonometry, and fundoscopy under pharmacological mydriasis in addition to corneal topography (OrbscanIITM, Bausch&LombTM, Inc.) and ultrasound immersion biometry (OcuScanTM, AlconTM, Inc.). The Hoffer Q formula was used in eyes with an axial length shorter than 22 mm, and the SRK/T formula was used for all other eyes.
Toric IOL cylinder power and axis placement were determined using the IOL manufacturer's online calculator (www.acrysoftoriccalculator.com). The size and location of LRIs were also determined via an online open source application (www.lricalculator.com), according to Donnenfeld's nomogram. For both groups, data such as biometry, keratometry, main incision location, and default surgically induced astigmatism (set at -0.50 D) were entered into the calculators with the final aim of achieving postoperative zero sphere and the smallest residual cylinder possible(16,17).
Surgical technique
The same surgeon (M.C.) performed all surgeries under mild sedation and topical anesthesia. Just before surgery, a sterile ink pen was used to place two marks on the corneal limbus at the 0-degree and 180-degree positions with the patient sitting upright at the slit lamp to avoid ocular torsion. In both groups, phacoemulsification followed by IOL implantation was performed through a 2.75-mm, single-plane, temporal incision at the corneal limbus; a Mendez ring was used to mark the steepest meridian. In the toric IOL group, the IOL was rotated to align with the intended axis. In the LRI group, LRIs were placed inside the limbus using a calibrated diamond knife with a preset blade depth of 600 μm.
Postoperative follow-up
All patients were evaluated at 1, 3, and 6 months after surgery (G.F.).
The postoperative manifest refraction, uncorrected distance visual acuity (UDVA), and SDCVA were measured. Spherical equivalent refraction (SE), predictability, and safety and efficacy indices were then calculated. Predictability was expressed as the proportion of eyes within ±1.00 D of the intended SE or the proportion of eyes within an even more strict limit of ±0.50 D of the intended SE. The intended SE was calculated from the difference between the postoperative SE and target SE. The target SE was defined as half of the goal residual cylinder. The safety index (SI) was calculated from the ratio between the postoperative SDCVA and preoperative SDCVA. The efficacy index (EI) was calculated from the ratio between postoperative UDVA and preoperative SDCVA.
The Alpins vectorial method of astigmatism analysis is based on three elementary vectors: target-induced astigmatism (TIA), surgically-induced astigmatism (SIA), and the difference vector (DV). In an ideal scenario, TIA equals SIA, while DV is null. Several relationships between these vectors, such as the magnitude of error (ME= SIA -TIA), index of success (IoS= DV/TIA), and correction index (CI= SIA/ TIA) are capable of fully describing the surgical astigmatic change if analyzed together(6). The Alpins vectorial parameters for refractive astigmatism were calculated using MicrosoftTM ExcelTM for MacIntoshTM spreadsheets (version 12.2.7, MicrosoftTM Corp.).
The Shapiro-Wilk normality tests for data sets were performed using IBMTM SPSSTM for MicrosoftTM WindowsTM software (version 20.0.0). A P-value of ≤0.05 was considered statistically significant(18). Pearson's coefficient of determination (R2) was used as necessary(19); bootstrapping (95% confidence interval) was performed in such cases(20). The Wilcoxon test was used to analyze statistical nonparametric differences within the same group throughout the follow-up period, and the Mann-Whitney U test was used to determine differences between the toric IOL and LRI groups at each evaluation(3).
RESULTS
The study enrolled 62 eyes of 31 consecutive eligible patients. Patient demographics and preoperative data are presented in Table 1. The mean age of patients in the LRI group was 71.75 years, which was significantly higher than that (65.67 years) of patients in the toric IOL group. Accordingly, the number of patients with rule astigmatism was 3 times lower in the LRI group (8 eyes) than in the toric IOL group (24 eyes).
Table 1 Patient demographics and preoperative data
| Group | ||||
|---|---|---|---|---|
| LRI | Toric IOL | P-value* | ||
| Patients (n) | 16 | 15 | - | |
| Eyes(n) | 32 | 30 | - | |
| Sex (F/M) | 8/8 | 11/4 | - | |
| Age (years) | ||||
| Range | 51 to 84 | 52 to 80 | - | |
| Mean ± SD | 71.75 ± 8.87 | 65.67 ± 6.28 | 0.01 | |
| Topographic astigmatism (D) | ||||
| Range | 0.75 to 2.40 | 0.80 to 2.50 | - | |
| Mean ± SD | 1.32 ± 0.47 | 1.41 ± 0.54 | 0.60 | |
| Steepest topographic 180°-semimeridian angle (n) | ||||
| 0° to 30° or 151° to 180° | 18 | 5 | - | |
| 61° to 120° | 8 | 24 | - | |
| 31° to 60° or 121° to 150° | 6 | 1 | - | |
| Axial length (mm) | ||||
| Range | 21.40 to 24.33 | 21.75 to 25.93 | - | |
| Mean ± SD | 23.05 ± 0.63 | 23.33 ± 0.92 | 0.25 | |
| Biometric formulae (n) | ||||
| SRK/T | 30 | 28 | - | |
| Hoffer Q | 2 | 2 | - | |
| Spherical IOL power (D) | ||||
| Range | 18.50 to 27.00 | 13.50 to 24.50 | - | |
| Mean ± SD | 21.50 ± 1.87 | 21.38 ± 2.58 | 0.61 | |
| Toric IOL model (n) | ||||
| T3 | - | 14 | - | |
| T4 | - | 7 | - | |
| T5 | - | 9 | - | |
LRI= limbal relaxing incisions; IOL= intraocular lens; n= number; F= females; M= males; SD= standard deviation; D= diopters; mm= millimeters; T3= AcrySof ToricTM T3 IOL; T4= AcrySof ToricTM T4 IOL; T5= AcrySof ToricTM T5 IOL.
(*)Mann-Whitney U test.
All surgeries were uneventful. None of the eyes required a second intervention. No potentially sight-threatening complications such as persistent corneal edema, pupillary block, retinal detachment, or endophthalmitis were observed.
All patients completed the follow-up period of 6 months.
Table 2 shows the preoperative intended astigmatic correction based on topographic astigmatism and the 1-, 3-, and 6-month postoperative astigmatic corrections based on manifest refractive astigmatism during each follow-up period in both groups. There was no statistical difference in the preoperative intended astigmatic correction between groups: -1.32 D in the LRI group and -1.41 D in the toric IOL group. The manifest refractive astigmatism at 6 months after surgery was -0.74 D in the LRI group and -0.62 D in the toric IOL group; these values were close to statistical significance (P=0.06).
Table 2 Preoperative intended astigmatism and achieved astigmatism at 1, 3, and 6 months after surgery
| Group | ||||
|---|---|---|---|---|
| Cylinder diopters | LRI | Toric IOL | P-value* | |
| Preoperative intended astigmatism | ||||
| Range | -2.40 to -0.75 | -2.50 to -0.80 | - | |
| Mean ± SD | -1.32 ± 0.47 | -1.41 ± 0.54 | 0.60 | |
| 1-month postoperative achieved astigmatism | ||||
| Range | -1.25 to 0.00 | -1.00 to 0.00 | - | |
| Mean ± SD | -0.66 ± 0.30 | -0.58 ± 0.24 | 0.25 | |
| P-value† | 0.00 | 0.00 | - | |
| Achieved astigmatism 3 months after surgery | ||||
| Range | -1.00 to 0.00 | -1.00 to -0.25 | ||
| Mean ± SD | -0.70 ± 0.21 | -0.63 ± 0.20 | ||
| P-value†† | 0.00 | 0.00 | - | |
| Achieved astigmatism 6 months after surgery | ||||
| Range | -1.25 to -0.25 | -1.00 to -0.25 | - | |
| Mean ± SD | -0.74 ± 0.26 | -0.62 ± 0.17 | 06 | |
| P-value††† | 0.00 | 0.00 | - | |
LRI= limbal relaxing incisions; IOL= intraocular lens; SD= standard deviation.
(*)Mann-Whitney U test.
(†,††,†††)Wilcoxon test; preoperative intended astigmatism vs. achieved astigmatism at 1, 3, and 6 months, respectively, after surgery.
At 6 months after surgery, the manifest refraction, as SE (means ± standard deviation), was -0.20 ± 0.42 in the LRI group and -0.21 ± 0.49 in the toric IOL group, with no significant difference between groups (P=0.84).
Figure 1A compares the mean preoperative and 1-, 3-, and 6-month postoperative SDCVAs between the LRI and toric IOL groups. The preoperative mean SDCVA was significantly lower in the toric IOL group than in the LRI group (Mann-Whitney U test, P=0.01). There was no significant difference in the mean SDCVA during the remaining period between groups (Mann-Whitney U test, P>0.05). Within each group, the postoperative SDCVAs were statistically lower than the preoperative corrected acuity and remained stable thereafter (Wilcoxon test; P=0.00). Figure 1B compares the mean 1-, 3-, and 6-month postoperative UCVAs between the LRI and toric IOL groups. The mean postoperative UDVA was comparable between groups throughout the follow-up period (Mann-Whitney U test; P>0.05).
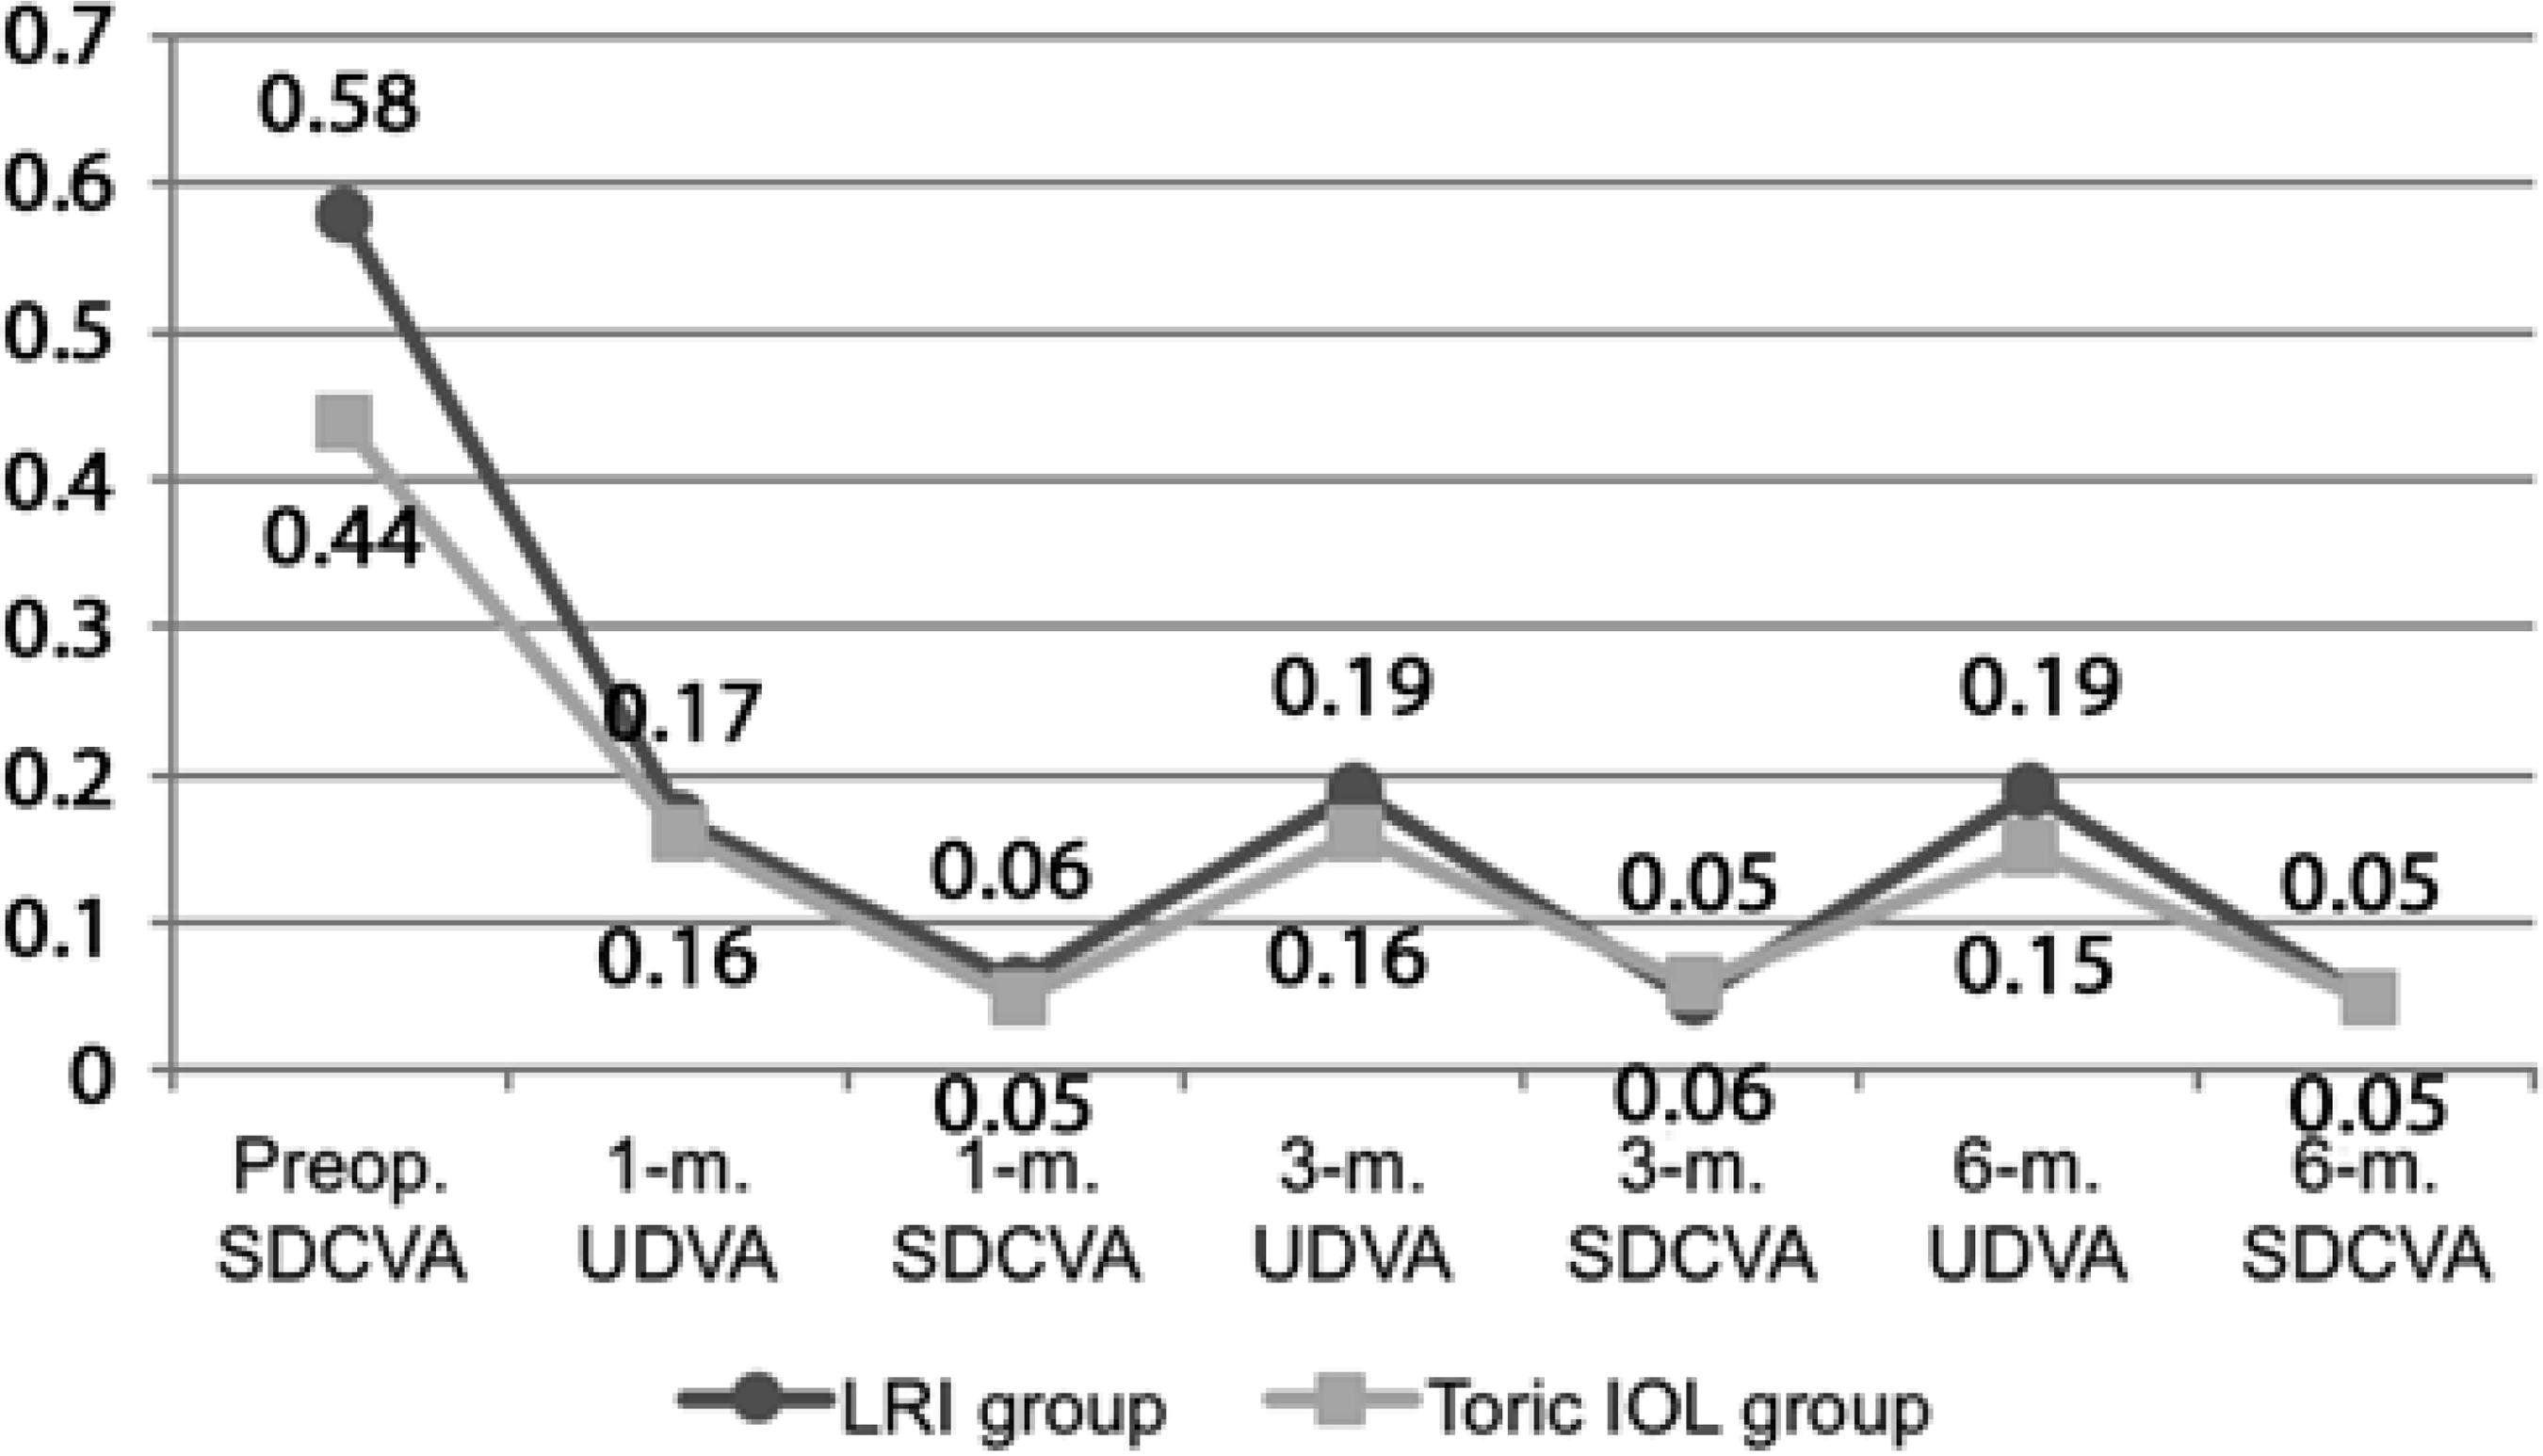
Figure 1 A) Preoperative, 1-m., 3-m. and 6-m. postoperative mean SDCVA (logMAR scale). B) One-month, 3-m. and 6-m. postoperative mean UDVA (logMAR scale). (IOL= intraocular lens; LRI= limbal relaxing incisions; m.= n-month postoperative; Preop.= preoperative period; SDCVA= spectacle distance corrected visual acuity; UDVA= uncorrected distance visual acuity).
Table 3 shows the proportion of eyes within ±1.00 D and within ±0.50 D of the intended spherical equivalent refraction at 1, 3, and 6 months after surgery in both groups. The proportion of eyes within ±0.50 D at 3 months and 6 months after surgery was greater in the LRI group (75% and 71.88%, respectively) than in the toric IOL group (40% and 66.67%, respectively). In the remaining period, the proportion was greater in the toric IOL group.
Table 3 Refractive predictability at 1, 3, and 6 months after surgery
| Group | |||
|---|---|---|---|
| LRI | Toric IOL | ||
| Fraction (%) | Fraction (%) | P-value* | |
| 1 month after surgery | 0.05 | ||
| ΔSE1 ± 1.00 D | 27/32 (84.38) | 28/30 (93.33) | - |
| ΔSE1 ± 0.50 D | 17/32 (53.13) | 18/30 (60.00) | - |
| 3 months after surgery | 0.09 | ||
| ΔSE3 ± 1.00 D | 30/32 (93.75) | 24/30 (80.00) | - |
| ΔSE3 ± 0.50 D | 24/32 (75.00) | 12/30 (40.00) | - |
| P-value† | 0.10 | 0.00 | |
| 6 months after surgery | 0.77 | ||
| ΔSE6 ± 1.00 D | 31/32; (96.88) | 30/30; (100) | - |
| ΔSE6 ± 0.50 D | 23/32; (71.88) | 18/30; (66.67) | - |
| P value†† | 0.02 | 0.71 | |
D= diopters; IOL= intraocular lens; LRI = limbal relaxing incisions; SD= standard deviation; ΔSE1= 1-month postoperative spherical equivalent minus preoperative target spherical equivalent; ΔSE3= 3-month postoperative target spherical equivalent minus preoperative target spherical equivalent; ΔSE6= 6-month postoperative target spherical equivalent minus preoperative target spherical equivalent.
(*)Mann-Whitney U test for mean ΔSEs between groups at 1, 3, and 6 months after surgery.
(†)Wilcoxon test; ΔSE1 (1 month after surgery) vs. ΔSE3 (3 months after surgery).
(††)Wilcoxon test; ΔSE1 (1 month after surgery) vs. ΔSE6 (6 months after surgery).
Table 4 shows the safety and efficacy indices in both groups at 1, 3, and 6 months after surgery.
Table 4 Safety and efficacy indices at 1, 3, and 6 months after surgery
| Group | ||||
|---|---|---|---|---|
| LRI | Toric IOL | P-value* | ||
| 1-month postoperative SI | ||||
| Range | 0.00 to 0.60 | 0.00 to 0.60 | - | |
| Mean ± SD | 0.11 ± 0.14 | 0.13 ± 0.20 | 0.94 | |
| 3-month postoperative SI | ||||
| Range | 0.00 to 0.33 | 0.00 to 0.60 | - | |
| Mean ± SD | 0.10 ± 0.13 | 0.18 ± 0.21 | 0.27 | |
| P value† | 0.92 | 0.13 | - | |
| 6-month postoperative SI | ||||
| Range | 0.00 to 0.38 | 0.00 to 0.60 | - | |
| Mean ± SD | 0.09 ± 0.12 | 0.12 ± 0.18 | 0.81 | |
| P value†† | 0.66 | 0.68 | - | |
| 1-month postoperative EI | ||||
| Range | 0.00 to 1.00 | 0.00 to 1.00 | - | |
| Mean ± SD | 0.31 ± 0.18 | 0.43 ± 0.23 | 0.01 | |
| 3-month postoperative EI | ||||
| Range | 0.17 to 1.00 | 0.00 to 1.00 | - | |
| Mean ± SD | 0.36 ± 0.18 | 0.44 ± 0.25 | 0.04 | |
| P value‡ | 0.04 | 0.32 | - | |
| 6-month postoperative EI | ||||
| Range | 0.17 to 1.00 | 0.00 to 1.00 | - | |
| Mean ± SD | 0.37 ± 0.19 | 0.42 ± 0.27 | 0.23 | |
| P value‡‡ | 0.03 | 0.72 | - | |
EI = efficacy index; LRI = limbal relaxing incisions; SD = standard deviation; SI = safety index.
(*)Mann-Whitney U test.
(†)Wilcoxon test; SI at 1 months vs. SI at 3 months.
(††)Wilcoxon test; SI at 1 month vs. SI at 6 months.
(‡)Wilcoxon test; EI at 1 month vs. EI at 3 months.
(‡‡)Wilcoxon test; EI at 1 month vs. EI at 6 months.
SI showed no difference at any time point between groups. EI at 1 and 3 months after surgery was significantly higher in the toric IOL group (0.43 and 0.44, respectively) than in the LRI group (0.31 and 0.36, respectively).
Figure 2A compares the mean TIAs at 1, 3, and 6months after surgery with the mean SIAs at the same time points between the LRI and toric IOL groups. There was no significant difference in the mean TIAs between groups (Mann-Whitney U test, P>0.05), while the mean SIAs were significantly lower in the LRI group than in the toric IOL group (Mann-Whitney U test; P<0.05). However, within each group, there were no differences in the mean SIAs throughout the follow-up period (Wilcoxon test; P>0.05). The mean SIAs were significantly lower than the mean TIAs in the LRI group (Wilcoxon test; P<0.05), while there were no significant differences in mean TIAs and SIAs in the toric IOL group (Wilcoxon test; P>0.05). Figure 2B compares the postoperative 1-, 3-, and 6-month mean DVs between the LRI and toric IOL groups. The mean DVs were significantly higher in the LRI group than in the toric IOL group throughout the follow-up period (Mann-Whitney U test; P<0.05). There were no significant differences within the same group over time (Wilcoxon test; P>0.05).
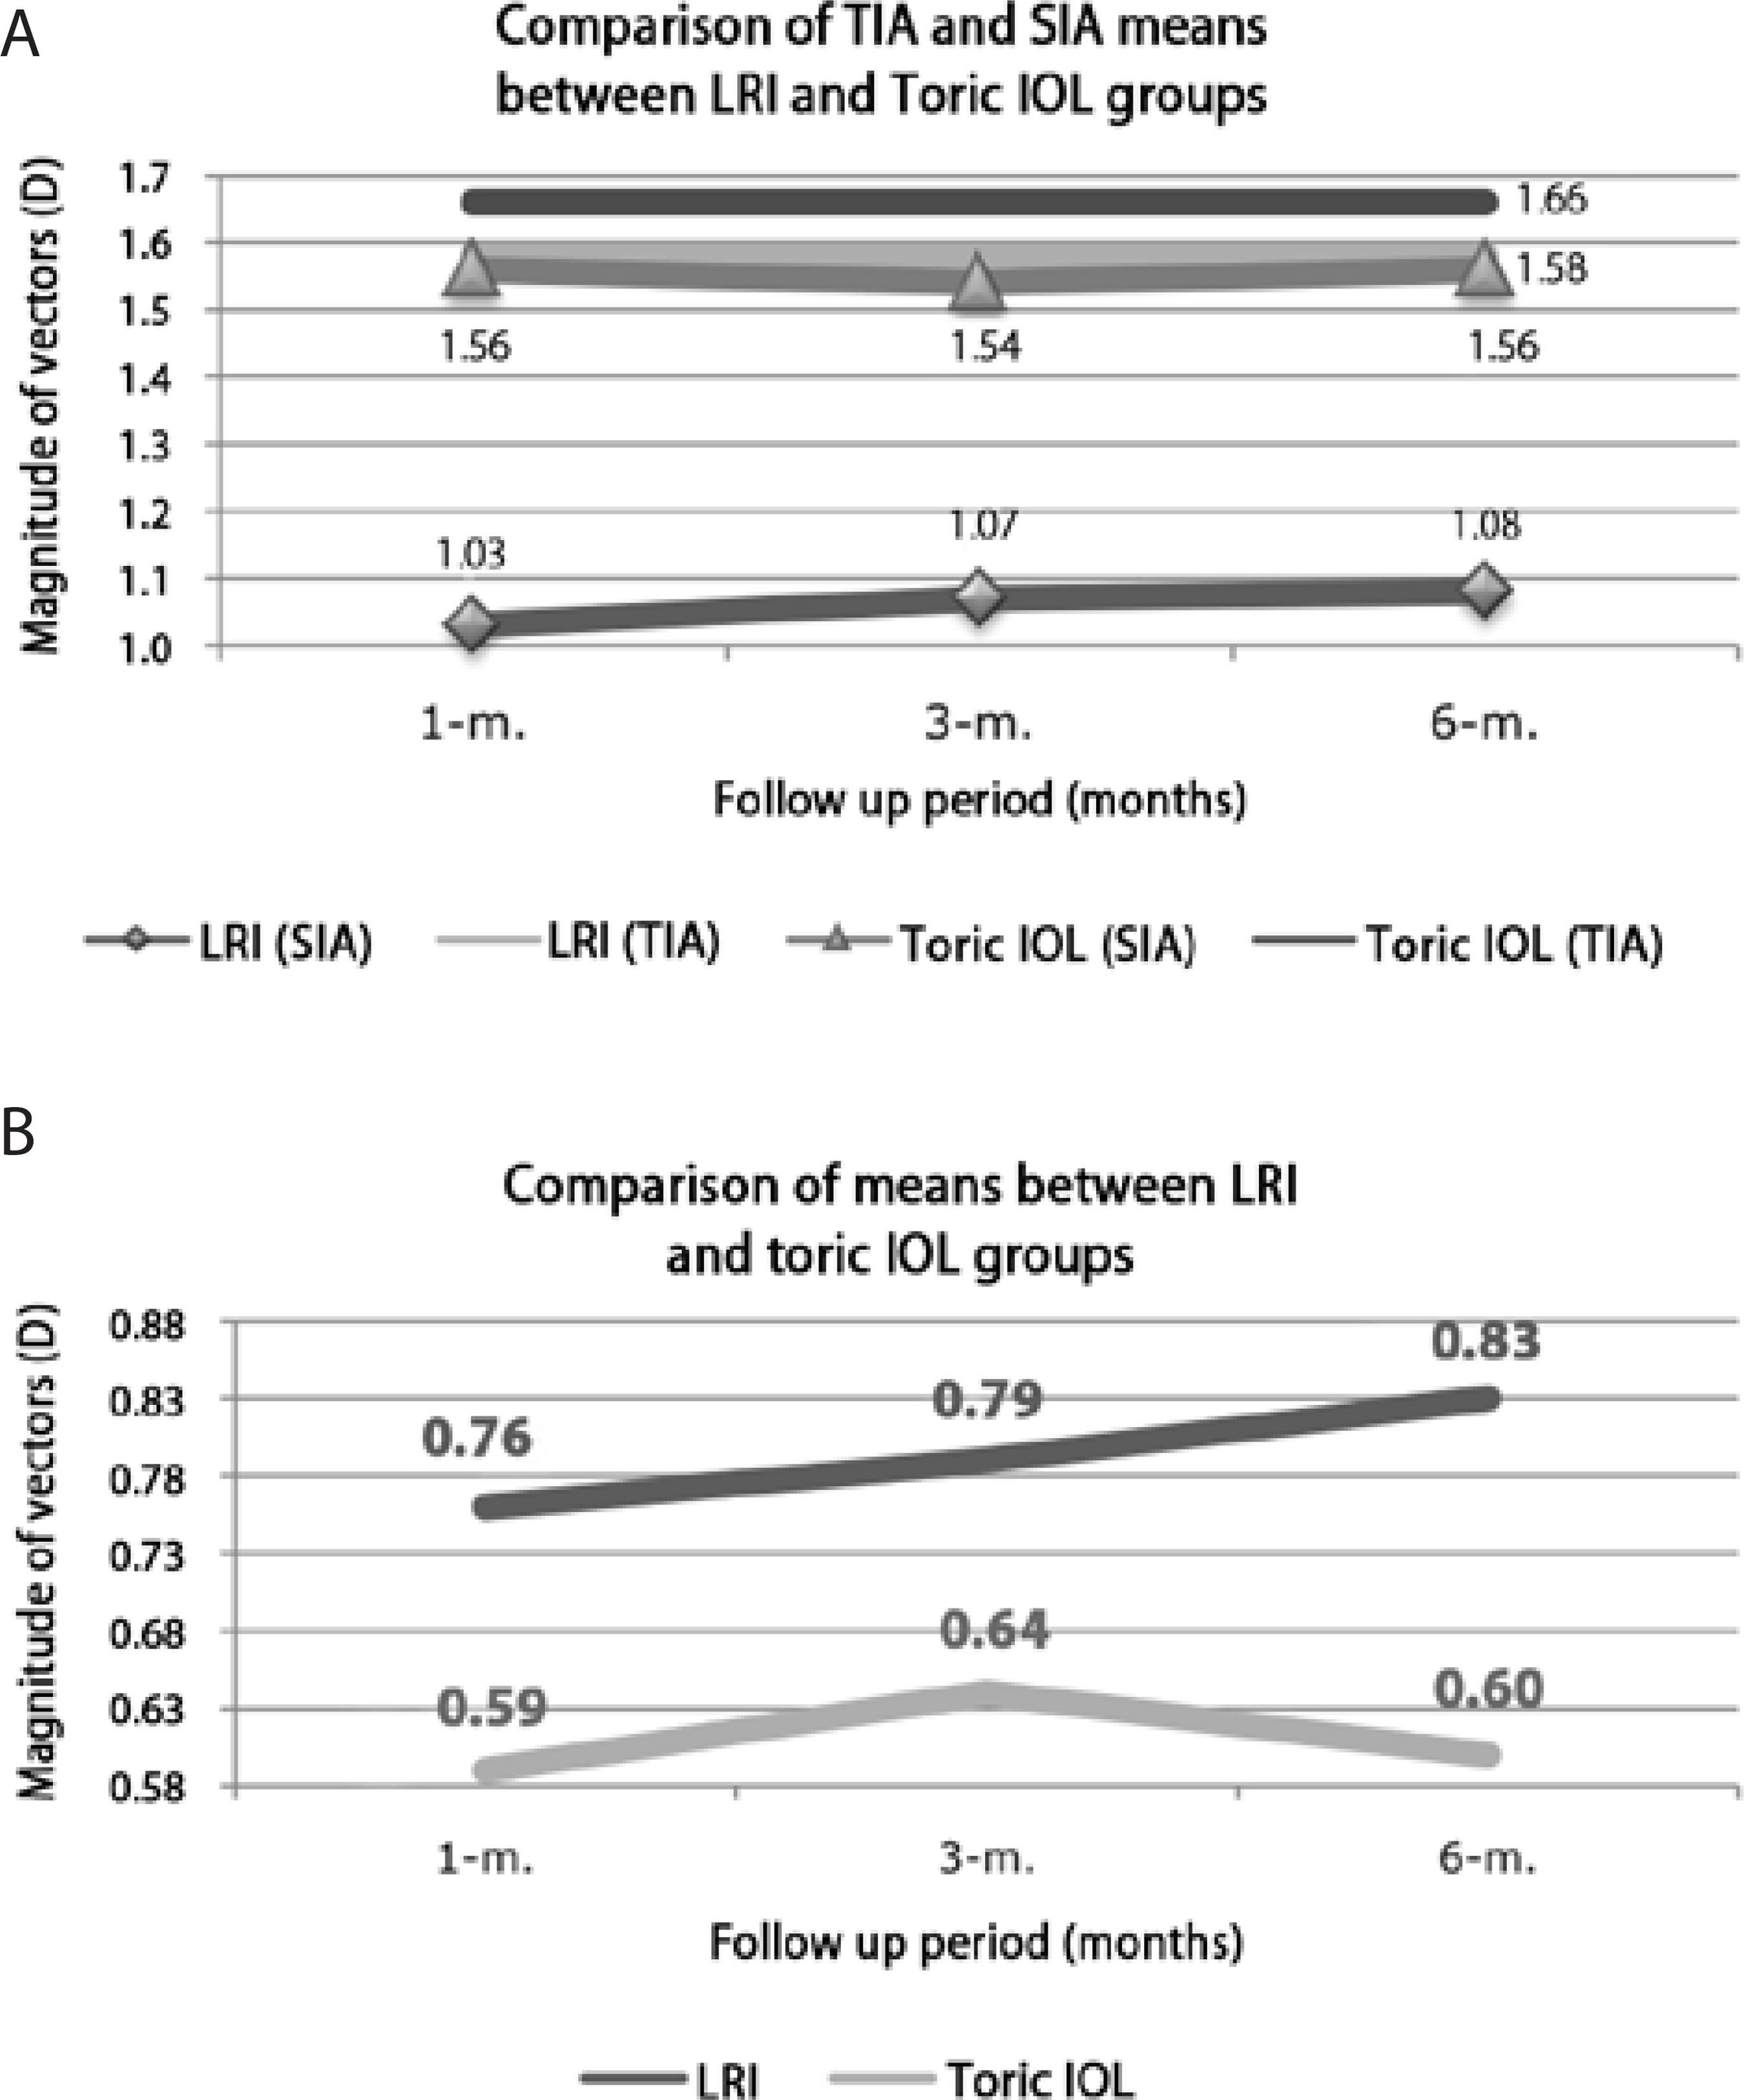
Figure 2 A) Comparison of TIA and SIA means, over time, between LRI and toric IOL groups and within each group. B) Comparison of DV means, over time, between LRI and toric IOL groups. (DV = difference vector; IOL intraocular lens; LRI = limbal relaxing incisions; SIA = surgically induced astigmatism vector; TIA = target induced astigmatism vector; m. = n-month postoperative)
Figure 3 compares the attempted versus achieved astigmatism 6 months after surgery in the LRI and toric IOL groups. Pearson's coefficient of determination (R2) for each group was 0.50 and 0.89 in the LRI and toric IOL groups, respectively (Figure 3).
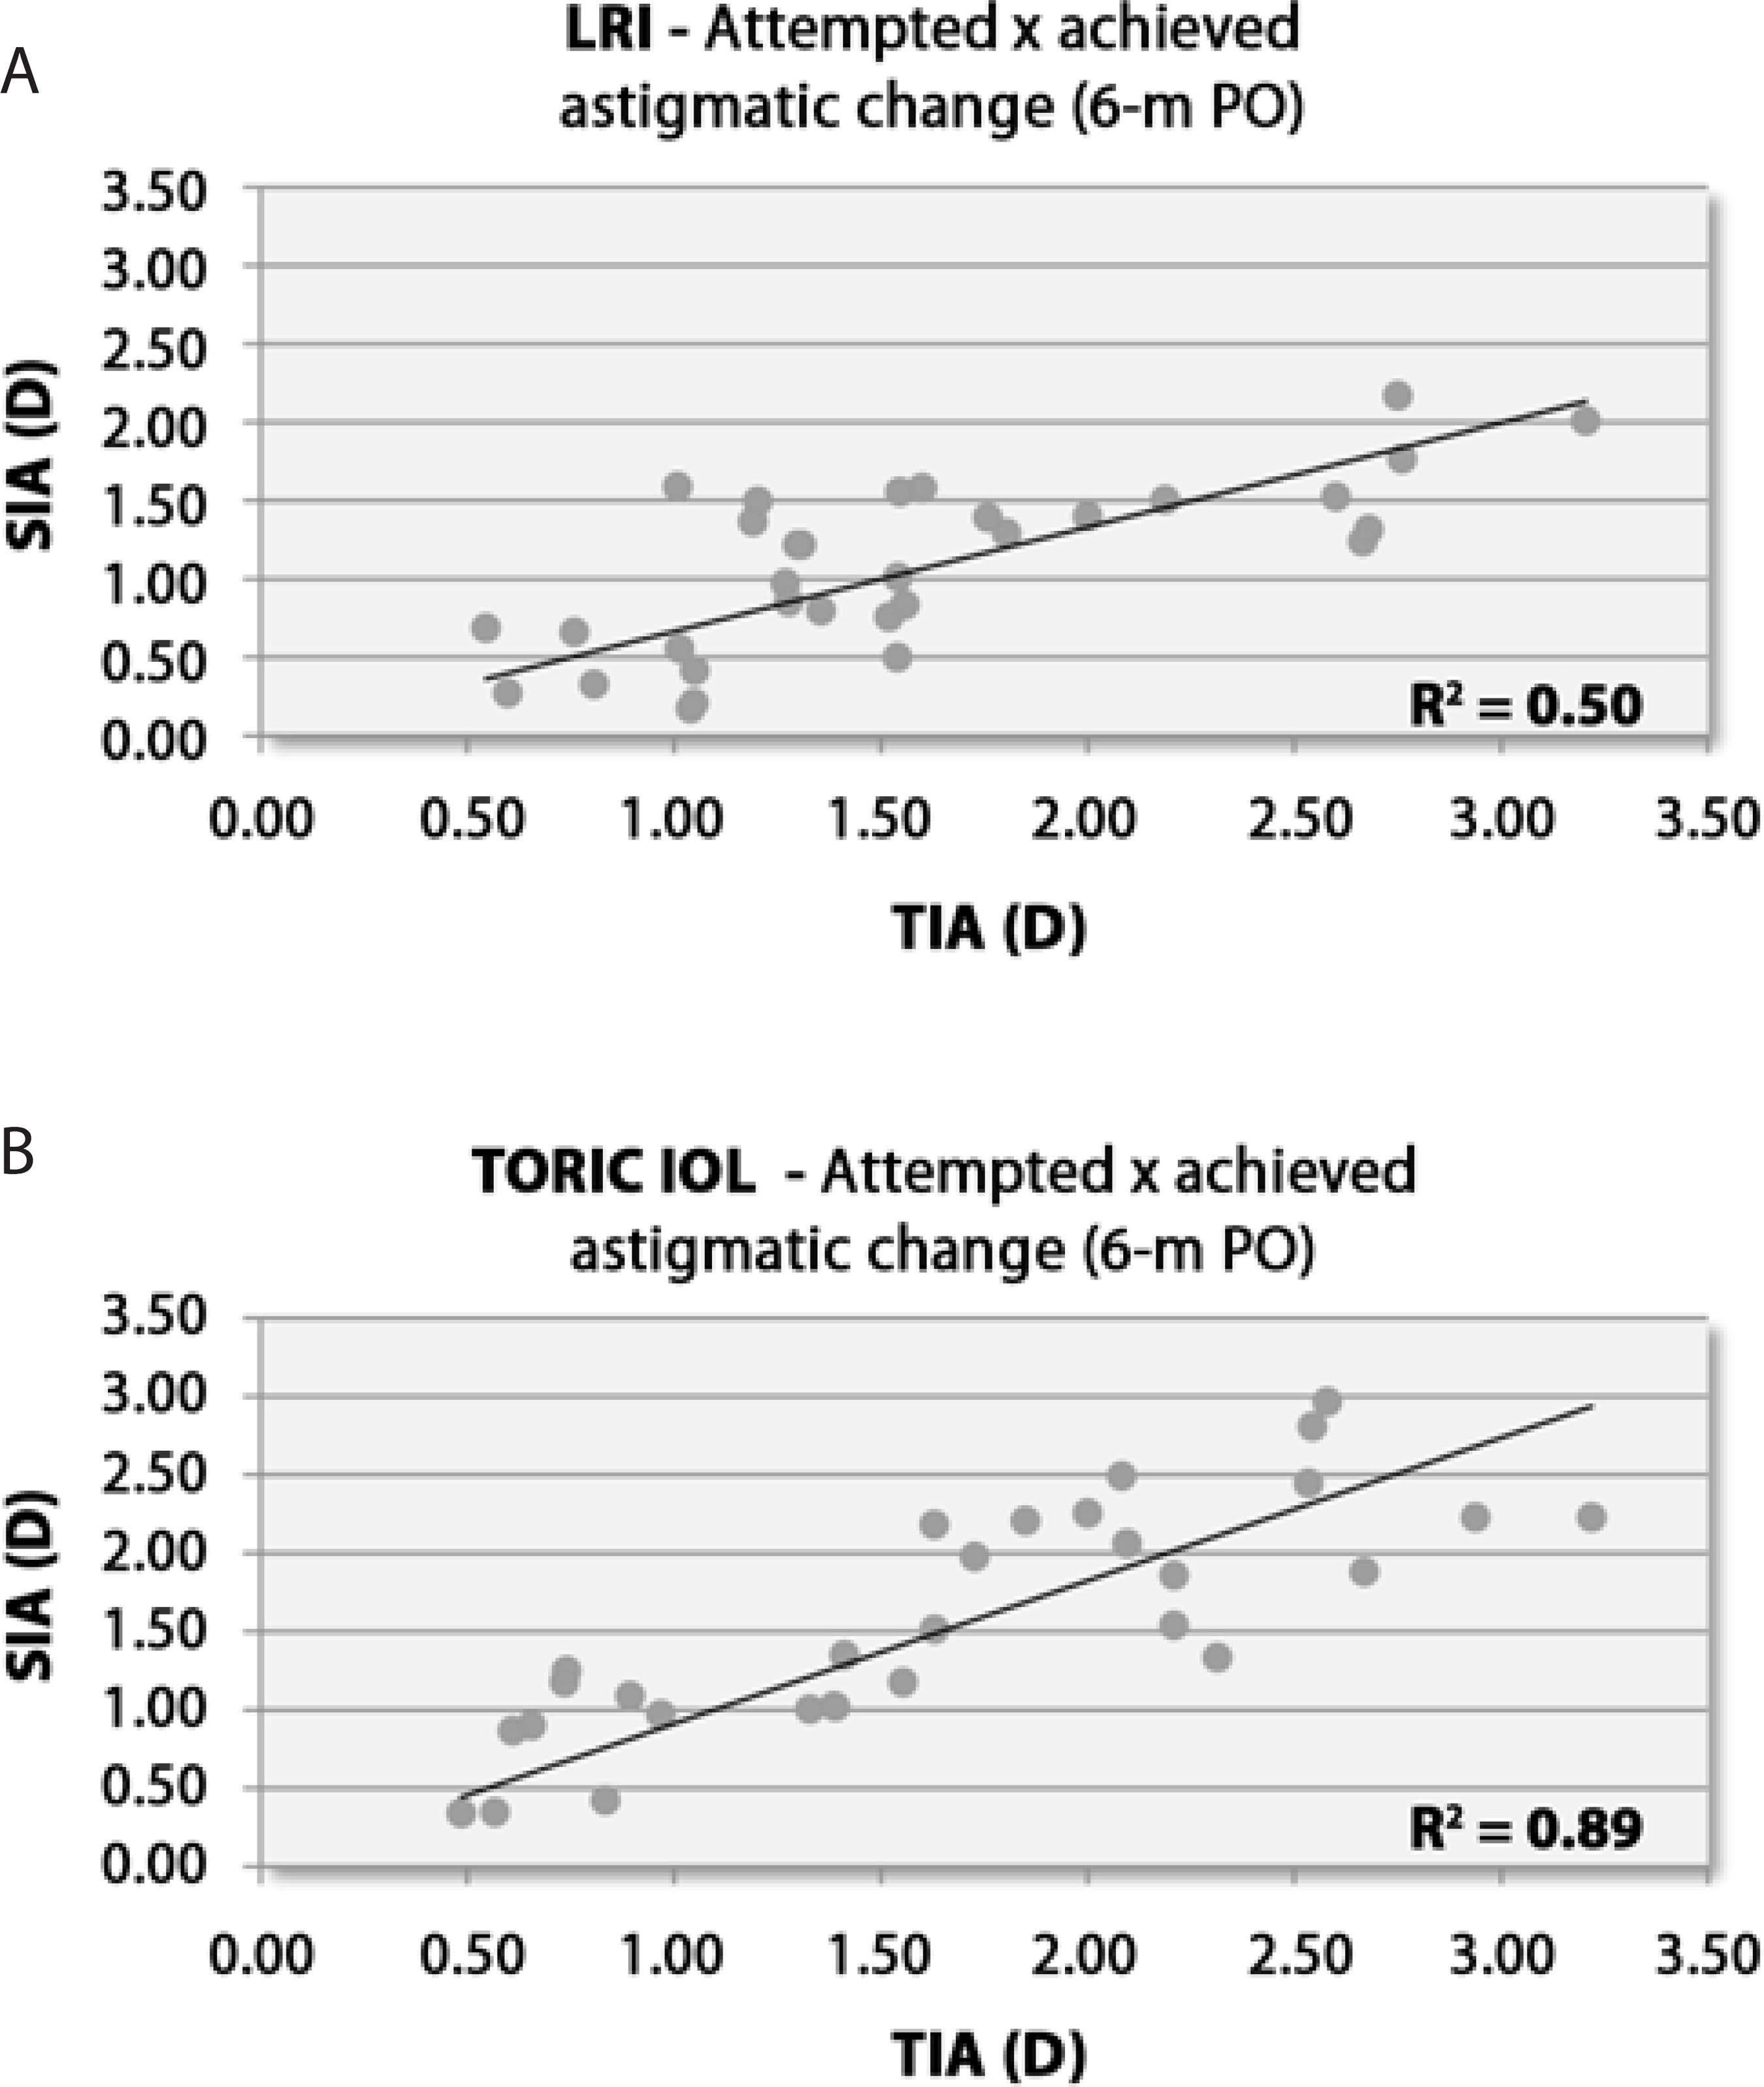
Figure 3 Scatterplots of attempted astigmatic correction and achieved astigmatic change at 6 months after surgery. A) LRI group. B) Toric IOL group. D= diopters; LRI= limbal relaxing incisions; SIA= surgically induced astigmatism; R2= Pearson’s coefficient of determination; TIA= target induced astigmatism; 6-m PO= 6-month postoperative period
Figure 4 shows the percentage distribution of astigmatic correction based on ME at 6 months after surgery in both groups. In the LRI group, 53.13% eyes were undercorrected, 43.74% eyes achieved the intended correction, and 3.13% eyes were over-corrected. In the toric IOL group, 16.76% eyes were undercorrected, 76.67% eyes reached the intended correction, and 6.67% eyes were overcorrected.
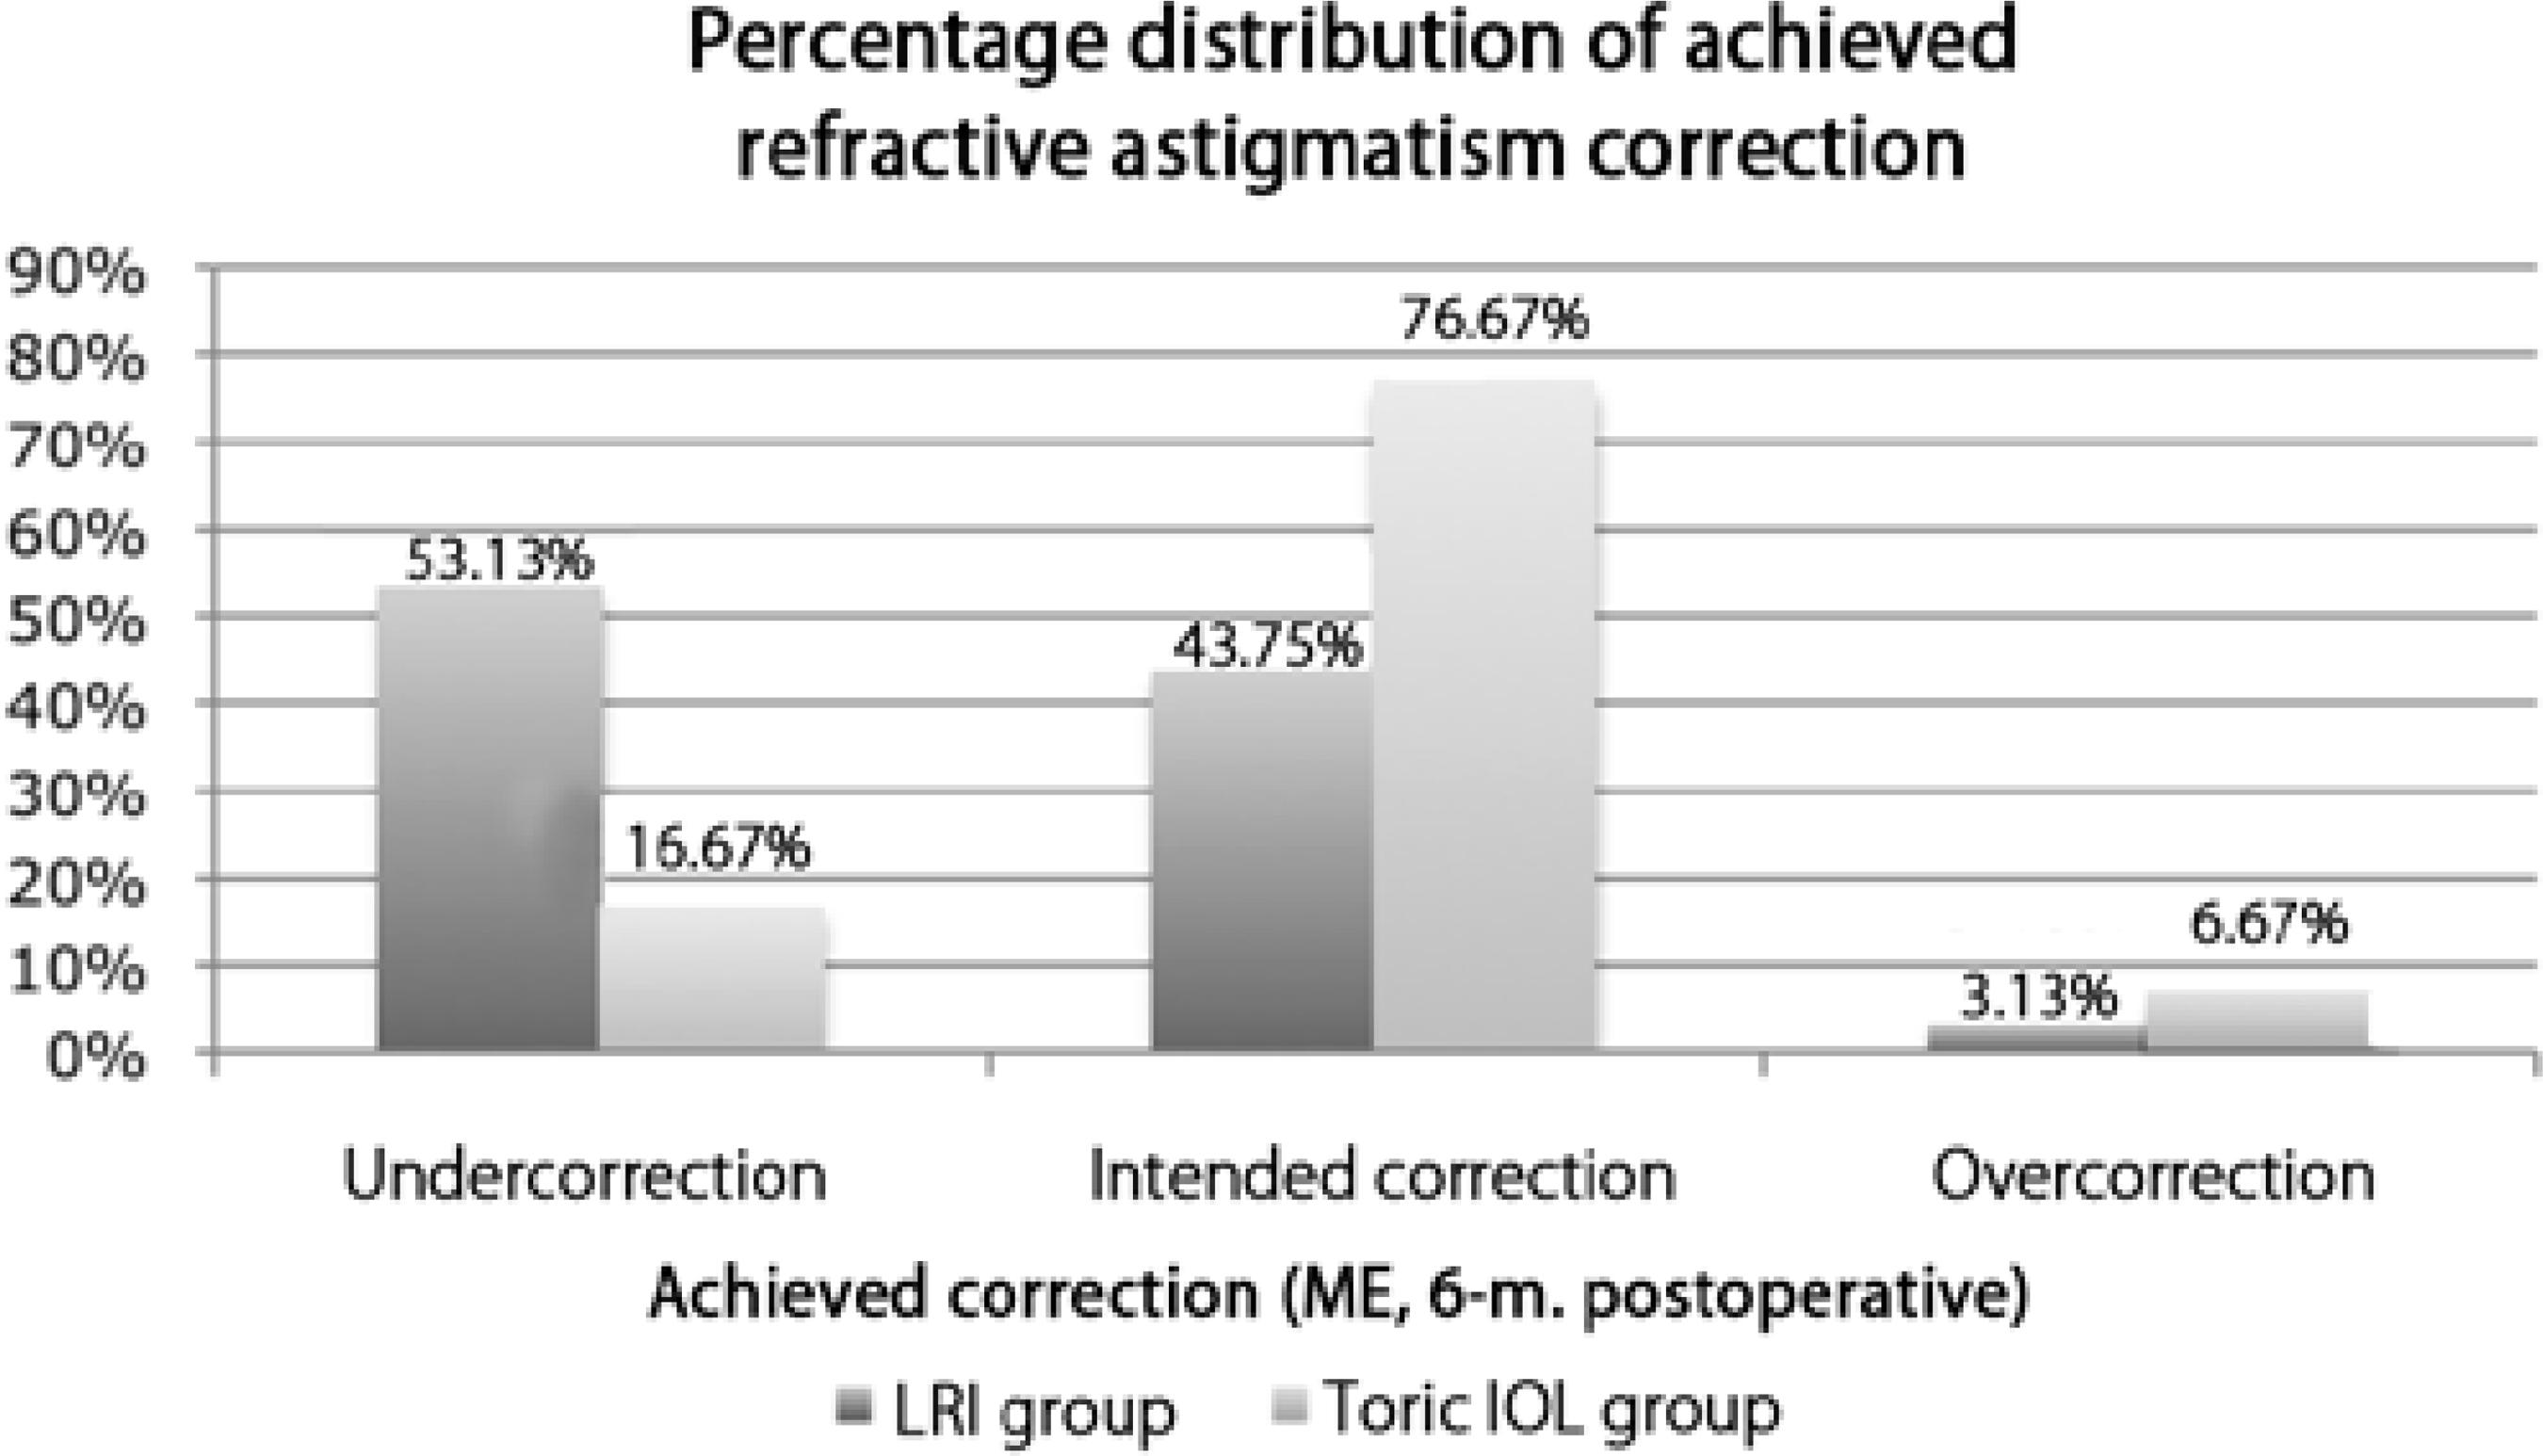
Figure 4 Histogram of the proportion of achieved astigmatic correction at 6 months after surgery. IOL= intraocular lens; ME= magnitude of error; LRI= limbal relaxing incisions; 6-m.= 6-month postoperative period
Figure 5 shows the success rates for astigmatic surgery, astigmatism reduction at the intended axis, and percentage of astigmatism corrected at 6 months after surgery in both groups. The success rates were 43%, 62%, and 64%, respectively, in the LRI group and 57%, 81%, and 94%, respectively, in the toric IOL group.
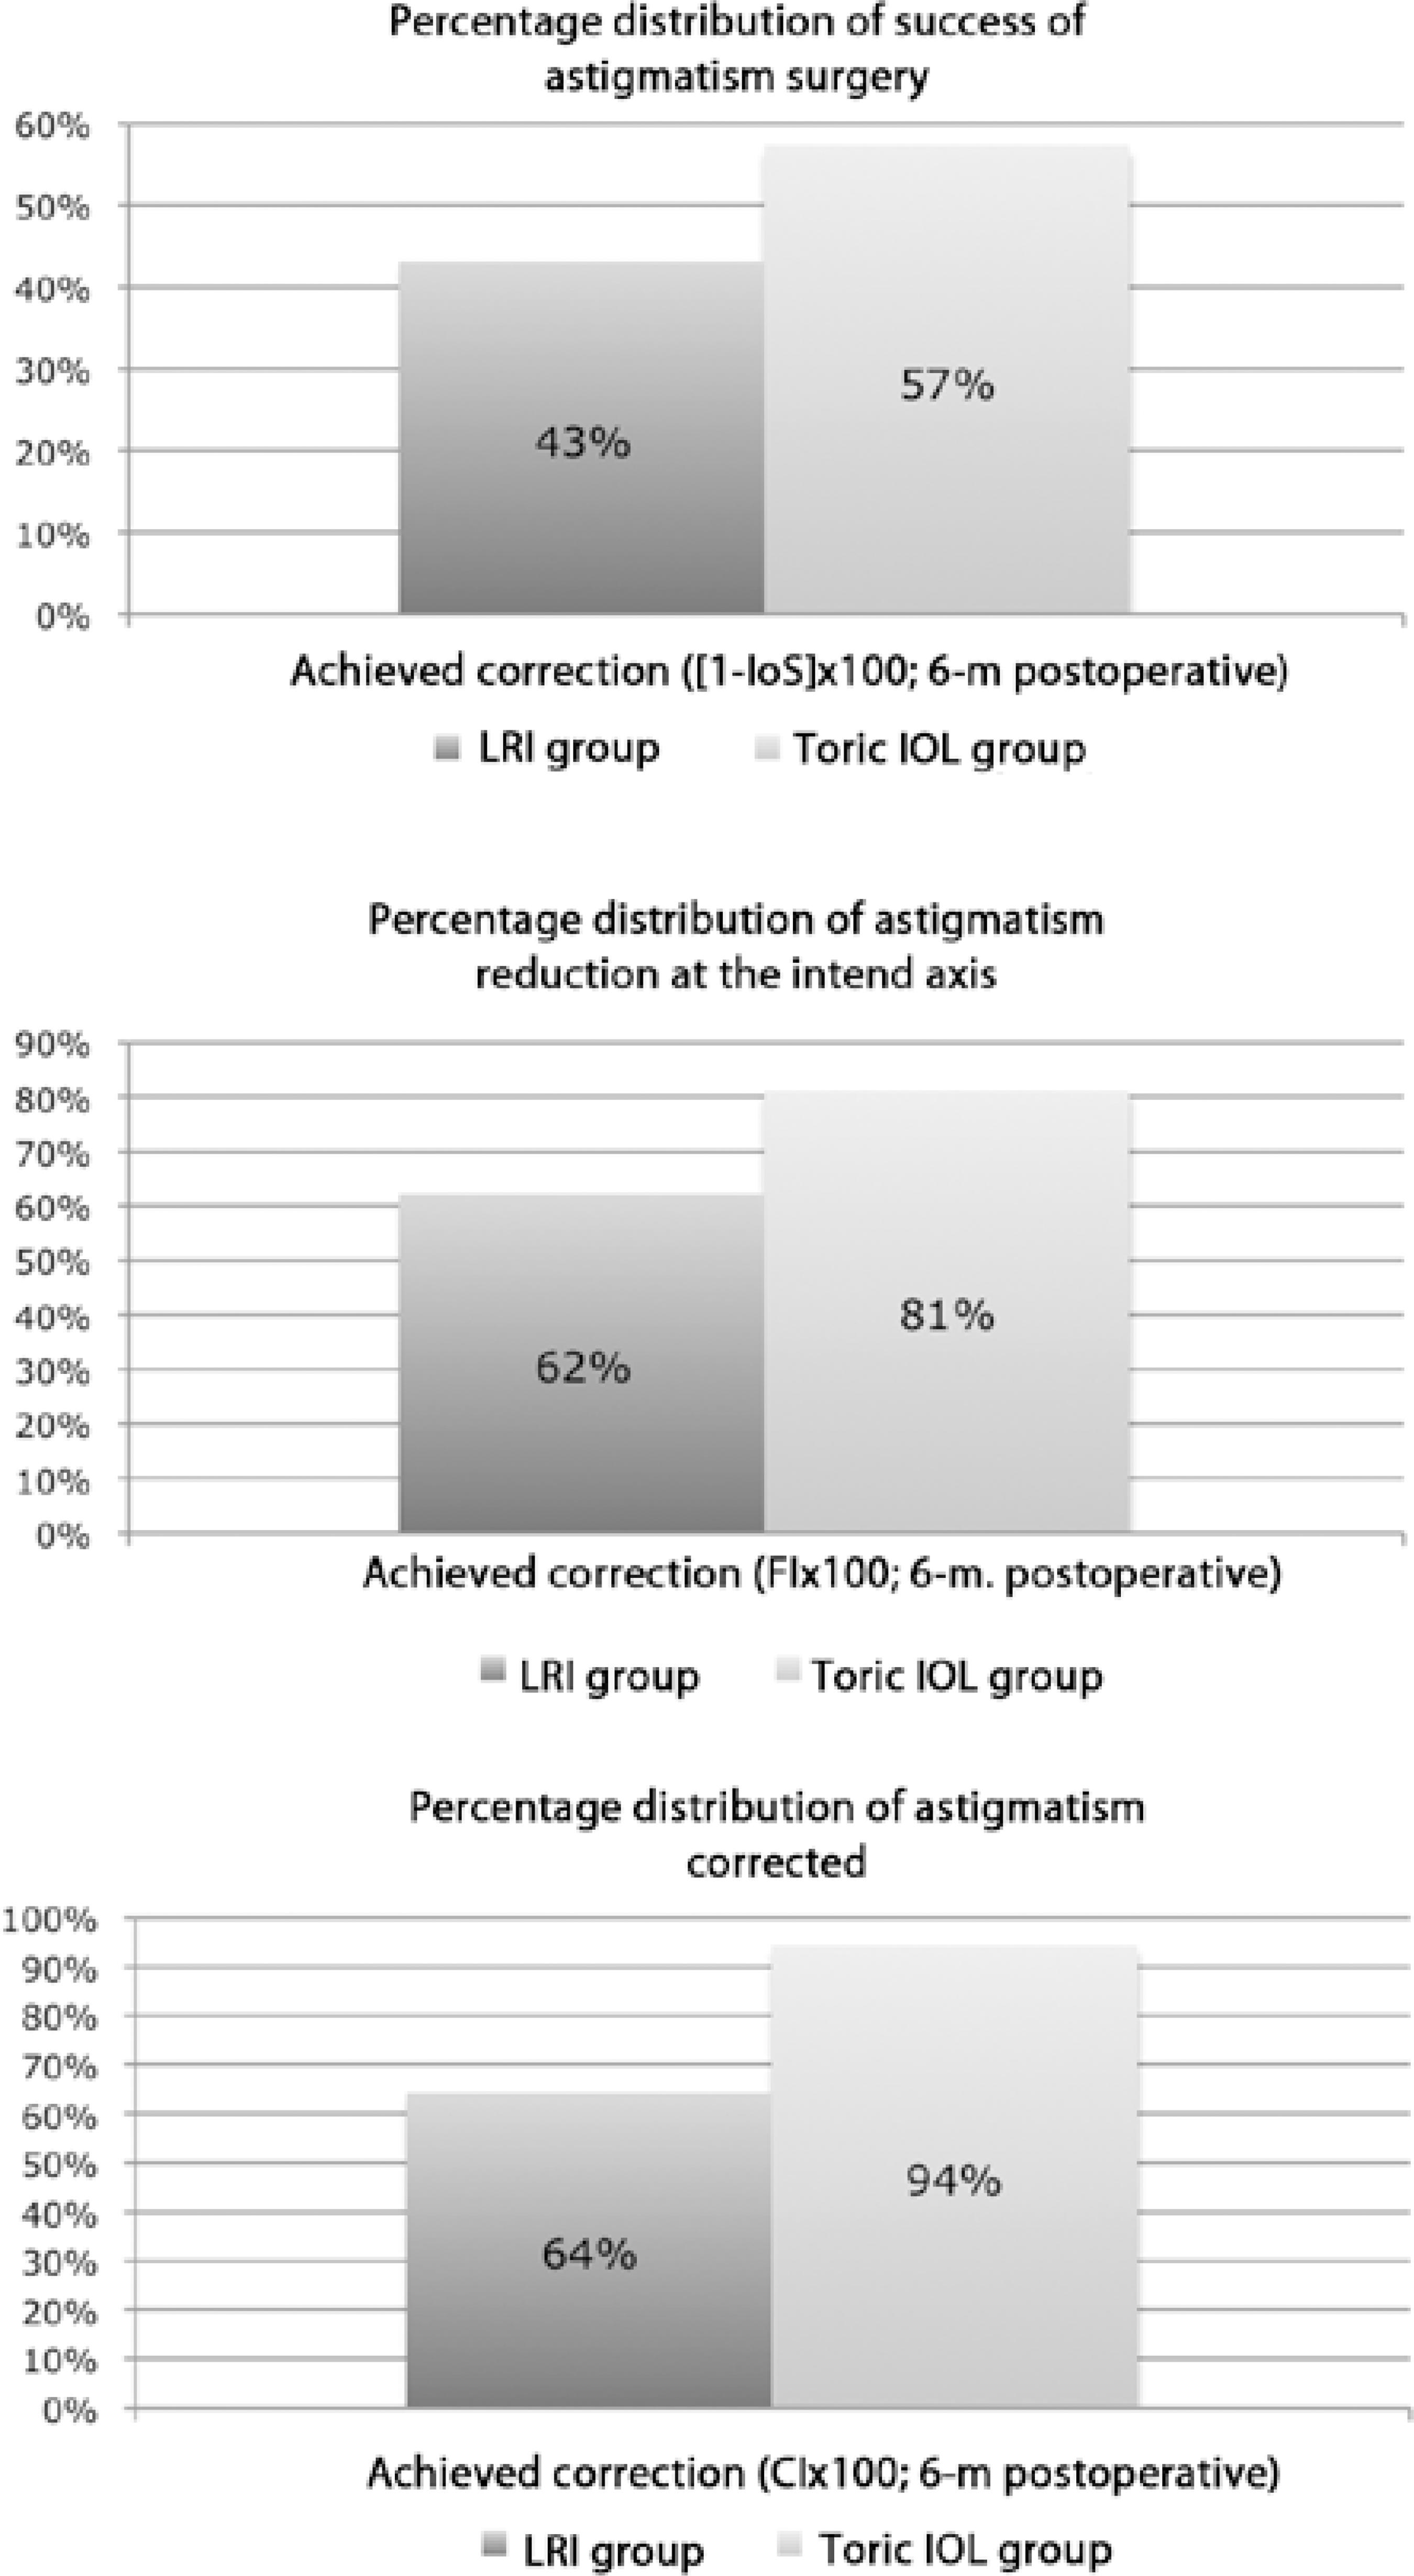
Figure 5 Histograms of the success rates at 6 months after surgery. A) Success of astigmatism surgery 6 months. B) Achieved astigmatic correction at the intended axis C) Percentage of astigmatism corrected. CI × 100= percentage of astigmatism corrected; FI × 100= astigmatism reduction at the intended axis; IOL= intraocular lens; LRI= limbal relaxing incisions; 6-m.= 6-month postoperative period Mann-Whitney U test ≤0.01 for all patients
DISCUSSION
In our study, both the LRI and toric IOL groups presented similar preoperative characteristics in most aspects of interest, as shown in Table 1, in accordance with the randomization design. However, one difference was remarkable; in the toric IOL group, the mean age of patients was significantly lower than that of patients in the LRI group. The incidence of both oblique and against the rule astigmatism increases with age(21). Both these forms of corneal astigmatism seem to respond somewhat poorly to LRI(10,22). Therefore, it may be expected that the overall capacity of LRI for treating pre-existing corneal astigmatism may have been underestimated and that the overall outcomes could possibly be different, if there were no such discrepancies in mean age between groups.
The postoperative manifest cylinder refraction at 6 months (means ± standard deviation) was -0.74 D ± 0.26 D in the LRI group and -0.62 D ± 0.17 D in the toric IOL group, values consistent with those reported in the current literature (-0.71 D ± 0.42 D(13) and -0.94 D ± 0.40 D(23)). These refractions were consistently lower than the intended astigmatism within each group and showed comparable outcomes between groups (Table 2). One factor should be considered here; the differences between groups were close to the cut-off value at the 6-month re-evaluation. The postoperative spherical equivalents exhibited consistent homogeneity between groups throughout the follow-up period.
The mean visual acuity for both groups is shown in Figure 1. Figure 1A shows the pre- and postoperative SDCVA. Figure 1B shows the postoperative UDVA (preoperative UDVA was not analyzed in our study). The preoperative SCDVA was slightly better in the toric IOL group. There was no significant difference between groups during the remaining period.
The mean predictability values are shown in Table 3. Predictability oscillated widely within and between groups throughout the follow-up period. We hypothesized that such variations arise from the subjective nature of manifest refraction. The mean ∆SE was significantly different between groups only at 1 month after surgery (better in the toric IOL group). In both groups, a considerable number of eyes achieved a refraction within 1.00 D (nearly 97% in the LRI group and 100% in the toric IOL group) or within 0.50 D of the goal refraction (nearly 72% in the LRI group and 67% in the toric IOL group); this was in accordance with the values reported in the current literature, which demonstrates that almost 90% patients are within 1.00 D of the goal refraction(24).
The mean SI, as shown in Table 4, remained stable throughout the follow-up period and exhibited no major differences between groups during any follow-up period. The mean EI, also shown in Table 4, increased over time in the LRI group (statistically significant), while they remained stable throughout the follow-up period in the toric IOL group. The EI exhibited lower values at 1 and 3 months after surgery, although this difference was no longer important by 6 months after surgery. We believed that the EI trend in the LRI group may be related to cicatricial demands associated with this technique(4); once the cicatricial process of incisions reached completion, the outcomes in the LRI and toric IOL groups became comparable.
Several studies have shown that both LRI and toric IOL implantation provide good safety, predictability, and efficacy associated with a postoperative improvement in visual acuity(3,22,25-36). Such studies, however, made comparisons with control groups. A straightforward comparison between LRI and toric IOL in terms of predictability, safety and efficacy is one of the original contributions of our study.
We believe that predictability, safety, and efficacy should be interpreted in a complementary fashion, rather than as discrete parameters. Our results suggest that both LRI and toric IOL implantation are predictable, safe, and efficient treatment options. Statistically significant differences, whenever present, are subtle, although they should be taken into account during surgical planning. A slightly greater stability in outcomes over time was found in the toric IOL group; this constitutes an advantage of toric IOL implantation over LRI placement for the treatment of astigmatism during phacoemulsification.
Figure 2A provides information concerning TIA and SIA trends over time within and between groups; the mean TIAs were comparable between groups (Mann-Whitney U test; P=0.62); however, the mean SIAs were significantly lower in the LRI group than in the toric IOL group (Mann-Whitney U test; P≤0.01). In addition, the mean SIAs were significantly lower than the mean TIAs in the LRI group (Wilcoxon test P=0.00); this was in accordance with values reported in the current literature, which documents that LRI most often undercorrects astigmatism(2,3,10). In both the LRI and toric IOL groups, there were no significant differences in the mean SIAs throughout the follow-up period (Wilcoxon test; P≥0.25). The trend for mean DVs between and within groups over time is presented in Figure 2B. The mean DV was always higher in the LRI group than in the toric IOL group (Mann-Whitney U test; P≤0.03); these differences were significant. Within each group, the variations over time were statistically insignificant (Wilcoxon test; P≥0.17). Consequently, the toric IOL group outcomes exhibited greater consistency with surgical planning; the mean SIAs were closer to the mean TIAs and lower mean DVs.
Scatterplots of attempted (TIA) versus achieved (SIA) astigmatic changes are shown for the LRI (Figure 3A) and toric IOL groups (Figure 3B). For each group, a trendline correlating TIA and SIA has been drawn. The points distributed along the trendline indicate eyes that achieved the desired correction (TIA= SIA). Eyes that were undercorrected (TIA> SIA) or overcorrected (TIA< SIA) were represented by points under and above the trendline, respectively(12). The strength of such correlations was assessed by Pearson's R2 to determine the group with the more accurate correction of astigmatism(19). The coefficient of determination was greater in the toric IOL group (R2=0.89) than in the LRI group (R2=0.50).
Alternatively, eyes that achieved the intended astigmatic correction and the under- or overcorrected eyes can be assessed by analyzing a parameter termed ME. The proportion of eyes that achieved the intended correction and that of under- and overcorrected eyes, determined on the basis of ME, in both groups are shown in Figure 4. Nearly 77% and 44% eyes achieved the intended correction in the toric IOL and LRI groups, respectively. Undercorrection was observed in 17% eyes in the toric IOL group and 53% eyes in the LRI group. Overcorrection was observed in approximately 7% eyes in the toric IOL group and 3% eyes in the LRI group. In our study, the greater number of patients with against the rule and oblique astigmatisms in the LRI group may have induced some bias because such categories of astigmatism are somewhat less responsive to LRI(2,3,10). The proportion of eyes that achieved the intended correction in the toric IOL group is remarkable compared with that in the LRI group. Although over-correction occurred in both groups, it was more frequent in the toric IOL group.
Figure 5 depicts 3 indices that, if examined together, enable complete assessment of any astigmatic change: the success of astigmatic surgery, calculated from the index of success (Figure 5A) and indicating a relative measure of success; the flattening index (FI; Figure 5B), related to the proportion of SIA at the TIA axis and suggestive of treatment effectiveness; and the correction index (CI; Figure 5C), the overall astigmatism correction achieved by SIA, representing treatment efficacy(7). These indices were better in the toric IOL group than in the LRI group: 57% vs. 43% for the success of astigmatic surgery, 81% vs. 62% for FI, and 94% vs. 64% for CI.
CONCLUSIONS
From both nonvectorial and vectorial perspectives, our results suggested that toric IOL implantation was advantageous over LRI placement for the treatment of astigmatism during phacoemulsification. Although such advantages often seem subtle in nonvectorial analysis, their importance is highlighted by the vectorial approach. The main limitation of our study was the considerable proportion of against the rule and oblique astigmatisms found in the LRI group, which introduced some bias of an uncertain extent.


 English PDF
 Print
Print
 Send this article by email
 How to cite this article
 Submit a comment
 Mendeley
 Scielo
 Pocket
 Share on Linkedin

