

Gustavo Galperín1; Martín Berra1; Maria Isabel Marquez2; Mariana Mandaradoni3; Julia Tau4; Alejandro Berra4
DOI: 10.5935/0004-2749.20180091
ABSTRACT
Purpose: To evaluate the effect of air pollution on the ocular surface of patients with Sjögren’s syndrome.
Methods: We investigated the ocular surfaces of thirty patients with Sjögren’s syndrome and thirty healthy volunteers (control group) living in the Metropolitan Area of Buenos Aires. We used nitrogen dioxide as an indicator of exposure to air pollution. An ocular symptoms questionnaire was answered by all subjects, who also underwent a complete ocular surface ophthalmic examination-including an Ocular Surface Disease Index questionnaire, biomicroscopy, tear breakup time, Schirmer 1 test, corneal and conjunctival vital staining with fluorescein and lissamine green, tear lysozyme concentration, and impression cytology.
Results: In almost all ocular surface test findings, we found a positive and significant correlation between higher levels of exposure to air pollution and higher levels of ocular surface damage in both the control group and Sjögren’s syndrome patients. In Sjögren’s syndrome patients, the Ocular Surface Disease Index questionnaire, tear breakup time, vital staining and impression cytology showed a significant correlation between high levels of air pollution and ocular surface disease. In the control group, the Ocular Surface Disease Index questionnaire, tear breakup time, and impression cytology showed a significant correlation between high levels of air pollution and ocular surface disease.
Conclusions: Here we demonstrated that in patients with dry eye syndrome associated with Sjögren, abnormalities of the ocular surface and eye irritation related to air pollution are more severe than those in the control group. We believe that measuring air quality should be not only an integral part of the evaluation of ocular surface disease but also a therapeutic consideration.
Keywords: Nitrogen dioxide; Ocular surface; Air pollution; Dry eye syndromes; Sjögren’s syndrome
RESUMO
Objetivo: Avaliar o efeito da poluição do ar na superfície ocular de pacientes com síndrome de Sjögren.
Métodos: Foram investigadas as superfícies oculares de trinta pacientes com síndrome de Sjögren e trinta voluntários saudáveis (grupo controle) residentes na Região Metropolitana de Buenos Aires. Usamos o dióxido de nitrogênio como um indicador de exposição à poluição do ar. Um questionário de sintomas oculares foi respondido por todos os indivíduos, que também foram submetidos a um exame oftalmológico completo da superfície ocular - incluindo um questionário do Índice da Doença da Superfície Ocular, biomicroscopia, tempo de ruptura do filme lacrimal, teste de Schirmer 1, coloração da córnea e conjuntiva com fluoresceína e lissamina verde, concentração de lisozima lacrimal e citologia de impressão.
Resultados: Em quase todos os achados do teste de superfície ocular, encontramos uma correlação positiva e significativa entre níveis mais altos de exposição à poluição do ar e níveis mais elevados de danos na superfície ocular tanto no grupo controle quanto nos pacientes com síndrome de Sjögren. Em pacientes com síndrome de Sjögren, o questionário do Índice da Doença da Superfície Ocular, tempo de ruptura do filme lacrimal, coloração vital e citologia de impressão mostraram uma correlação significativa entre altos níveis de poluição do ar e doença da superfície ocular. No grupo controle, o questionário do Índice de Doenças da Superfície Ocular, tempo de ruptura do filme lacrimal e citologia de impressão mostraram uma correlação significativa entre altos níveis de poluição do ar e doença da superfície ocular.
Conclusões: Aqui demonstramos que, pacientes com síndrome de olho seco associada a Sjögren, as anormalidades da superfície ocular e a irritação ocular relacionadas à poluição do ar são mais graves do que aquelas no grupo controle. Acreditamos que a medição da qualidade do ar não deve ser apenas uma parte integral da avaliação da doença da superfície ocular, mas também uma consideração terapêutica.
Descritores: Dióxido de nitrogênio; Superfície ocular; Poluição do ar; Síndromes do olho seco; Síndrome de Sjögren
INTRODUCTION
Ambient levels of air pollution have been demonstrated to have acute adverse health effects in humans, mostly in respiratory and cardiovascular events. The ocular mucosa is constantly exposed to the external environment, and chronic exposure to air pollution may also adversely affect the ocular surface(1).
Current levels of air pollution, as strongly evidenced by epidemiological studies published in the past 10 to 15 years, have a negative impact on public health in general and in particular on the ocular mucosa(2). Indeed, individuals living in highly polluted areas frequently report ocular symptoms(3,4), and previous studies of individuals living in cities with high levels of air pollution have detected tear film abnormalities and subclinical changes on the ocular surfaces(3-5). Moreover, a significant positive association between exposure to air pollution and goblet cell hyperplasia in the human conjunctiva was reported in a recent study(6). In an article published by our group in 2015, we documented the effect of acute exposure to air pollution-a product of increased air pollution from the burning of biomass-as being associated with a decrease in the stability of the tear film (TBUT). This decreased stability generated areas of ocular surface exposure potentially causing the increased sensation of irritation and affecting the group of patients with ocular surface diseases to a greater extent(7).
Air pollution is a complex mixture of thousands of pollutants, which may comprise solid and liquid particles suspended in the air-namely, particulate matter (PM)-and different types of gases, such as ozone, nitrogen oxides, volatile organic carbons, and carbon monoxide(6). Nitrogen dioxide (NO2), a product of combustion emitted from both stationary sources (for instance, incineration) and motor vehicles, may induce oxidative damage in humans(7,8), and is one of a group of highly reactive gases known as “oxides of nitrogen,” or “nitrogen oxides” (NOx). Other nitrogen oxides include nitrous acid and nitric acid. The Environmental Protection Agency’s (EPA) National Ambient Air Quality Standard uses nitrogen dioxide (NO2) as the indicator for the larger group of nitrogen oxides. NO2 forms rapidly from car, truck and bus, power plant, and off-road equipment emissions. In addition to contributing to the formation of ground-level ozone and fine particle pollution, NO2 has a number of adverse effects on the respiratory system. In our study, we measured concentrations of NO2 and used them as an indicator of exposure to air pollution.
Dry eye syndrome with SS is often more severe than non-SS dry eye syndrome. Severe ocular surface staining is caused by the lack of basic and reflex tearing, both of which result from lacrimal gland destruction.
SS is a systemic autoimmune disease that presents with sicca symptomatology of the main mucosa surfaces, the main features-xerophthalmia and xerostomia-detected by specific ocular (vital staining with fluorescein and lissamine green, Schirmer test and TBUT) and oral (salivary flow measurement, parotid scintigraphy) tests. A focal lymphocytic infiltration of the exocrine glands, determined by a biopsy of the minor labial salivary glands, is the histological hallmark of SS.
Here we evaluate the effect of ambient levels of air pollution on the ocular surface of individuals with SS living in the Metropolitan Area of Buenos Aires(8).
METHODS
Study population
The study involved 30 healthy volunteers and 30 SS patients, aged 20-65 years old. The healthy volunteers lived in the same area-the Metropolitan Area of Buenos Aires-as the SS patients.
We chose SICCA classification criteria for the diagnosis of SS because this classification is useful in diagnosing advanced SS patients with advanced ocular surface disease. SS diagnosis requires the fulfillment of at least 2 of the following 3 criteria: positive serum (anti-SSA and/or anti-SSB or positive rheumatoid factor and ANA ≥1:320); ocular staining score ≥3(9-13); and presence of focal lymphocytic sialadenitis with focus score ≥1 focus/4 mm2 in labial salivary gland biopsies.
The inclusion criteria were: over 18 years old and BCVA ≥ 20/40. Additionally, inclusion in the SS group required a SICCA diagnosis of SS, and those in the control group demonstrated no signs of ocular surface disease. Patients and members of the control group have been living in the study area for at least 5 years and have agreed to participate in the study after reading and signing an informed consent form.
The exclusion criteria were: chronic illnesses, smoking, the possibility of traveling to other areas during the seven-day monitoring period, and contact with chemical solutions, such as organic solvents, sodium hypochlorite and formalin, as well as a history of use of contact lenses, ophthalmic surgery, preexisting ophthalmic conditions such as posterior or anterior blepharitis, allergic conjunctivitis, non-SS dry eye, uveitis, high myopia, lagophthalmos, any systemic diseases (such as Diabetes Mellitus and depression), use of any systemic medication, and any auto-immune diseases.
The Ethics Committee of the institution approved the research protocol and before being enrolled in the study, all subjects gave their informed consent.
Exposure assessment
Nitrogen dioxide (NO2) was used as an indicator of exposure to air pollution. We employed a NO2 passive tubes monitoring system demonstrated to be simple and efficient and not to interfere with daily activities, thereby favoring compliance(12). Each subject carried a passive sampler containing a cellulose filter (Energetica, Rio de Janeiro, Brazil) impregnated with an absorbent solution-2% triethanolamine, 0.05% o-methoxyphenol, and 0.025% sodium metabisulfite-inside a small plastic tube with one of its extremities open to the ambient air. We determined the nitrite produced during sampling colorimetrically by reacting the exposed absorbing reagent with sulfanilamide and 8-anilino-1-naphthalenesulfonic acid at a wavelength of 550 nm; our collaborate group had previously evaluated the efficiency and sensitivity of this measuring system, finding an accuracy of 98.6% and a precision of 80%(12).
We fixed passive samplers in the pockets of the studied individuals, and instructed them to keep the samplers on their person at all times during their daily activities and by the bedside during the night for 7 days. We used a cumulative measure of 1 week of NO2 exposure and divided this measure by 7, which gave us a mean individual level of daily exposure for comparison with ophthalmological examinations.
Ocular surface disease index (OSDI)
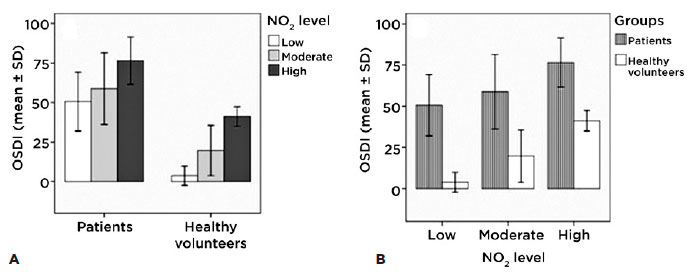
We evaluated all subjects using the 12-question OSDI questionnaire, translated into Spanish, for the assessment of the presence or absence of ocular dryness, irritation, heaviness, fatigue, and itching over the preceding 7 days. The test scale ranged from 0 to 100, with higher scores representing greater disability.
Schirmer 1 test
The Schirmer 1 test (without anesthesia) was carried out before any drops were instilled in the eye. Standardized Schirmer strips were bent at the notch and carefully placed over the lower lid margin as far as possible toward the temporal angle of the lids. During the test, the patient was instructed to keep her or his eyelids closed. The strips remained in place for 5 minutes, or until they were completely saturated with tears. After 5 minutes, the degree of moistening of the strips was measured using the millimeter scale on each strip.
Tear break-up time
We measured the tear break-up time (TBUT) by instilling 5 micro-liters of non-preserved, 2% sodium fluorescein onto the bulbar conjunctiva using a micro-pipette. Within 30 seconds of the fluorescein instillation, we asked the patient to stare straight ahead without blinking. We estimated TBUT by measuring the time elapsed, without touching the eyelid, from the last complete blink to the appearance of the first dry spot in the fluorescein-stained tear film (13,14).
Vital staining
We used corneal fluorescein staining with cobalt blue light to assess the presence or absence of corneal keratitis. We evaluated corneal fluorescein staining with fluorescein strips (Diagnóstico Ocular, Buenos Aires, Argentina), which we moistened with 0.9% sodium chloride solution and gently applied to the inferior fornix. We evaluated the staining pattern and graded it according to the ocular Sjögren’s International Collaborative Clinical Alliance grading score(11).
We performed vital staining with lissamine green using lissamine green strips (Diagnóstico Ocular, Buenos Aires, Argentina), which we moistened with 0.9% sodium chloride solution and gently applied to the inferior fornix. We evaluated and graded the staining pattern according to the ocular Sjögren’s International Collaborative Clinical Alliance grading score.
Impression cytology
We used impression cytology to obtain samples from the superficial epithelial cell layers of the inferior tarsal conjunctiva. We collected impression cytology samples after the 7-day monitoring of exposure to NO2. All samples were collected in the morning (between 9 AM and 11 AM). We applied semicircular filters approximately 15 mm diameter in size (cellulose ester filter 22-µm pore; Millipore Corp., Bedford, MA, USA) to the inferior tarsal conjunctiva after instilling one drop of topical anesthetic (Proparacaine hydrochloride ophthalmic solution 0.5%) in each eye, and wiped the excess fluid away. We applied the paper fragments for approximately 10 seconds, and after applying gentle pressure with the blunt end of the forceps, we peeled the fragments off and immediately immersed them in tubes containing absolute ethanol. After fixation, we rehydrated the specimens in 70% ethyl alcohol, and placed them successively in periodic acid-Schiff reagent, sodium metabisulfite, Gill’s hematoxylin, and Scott’s tap water. We then rinsed the specimens with 95% alcohol and absolute alcohol. We used xylene to make the filter paper transparent. Before mounting, we placed the filter paper with the epithelial cells facing upward. Slides were examined by light microscopy and goblet cells were counted in 10 high-power fields (HPF) with a 400× magnification. The observer performing the goblet cell counts was blinded to the place of origin of the samples(15).
Tear lysozyme concentration
We collected tears by gently applying a 5-mm diameter filter paper disc in the inferior conjunctival cul-de-sac of each eye for one minute with both eyes closed. We kept the samples at -20°C until they were processed. To determine the tear lysozyme concentration, we used the Micrococcus lysodeikticus (ATCC 4698, 770; Sigma-Aldrich, St. Louis, MO) agar diffusion assay in Mueller Hinton agar plates (Bio Merieux, Marcy l’Etoile, France). We placed each disc in the plate with the M. lysodeikticus (2 × 10⁶ CFU/mL) suspension gel, and measured the inhibition halo after 24 hours(16). To calculate the lysozyme concentration, we obtained a standard curve using identical discs moistened with 10,000 µg/mL, 1,000 µg/mL, 100 µg/mL, and 10 µg/mL of lysozyme (ATCC 4698, L6876; Sigma-Aldrich) diluted in phosphate-buffered saline (Invitrogen Corp., Carlsbad, CA). We considered values of 1,000 µg/mL or below to be abnormal(16,17), and to characterize patients with SS.
Statistical analysis
We evaluated the variables OSDI, the Schirmer 1 test, TBUT, corneal fluorescein staining, conjunctival green lissamine staining, impression cytology of conjunctival mucus membrane, and lysozyme and NO2 levels.
We divided the patients and the control group according to NO2 exposure levels: high exposure (NO2 >30 µg/m3), moderate exposure (20 µg/m3 to 30 µg/m3), and low exposure (NO2 <20 µg/m3). We performed one-way ANOVA with the Bonferroni test as the post hoc test (α=0.05) to compare means within groups. We also performed the independent samples T test (α=0.05) to compare means between patients and the control group exposed to the same levels of NO2 (high, moderate or low). We used SPSS 17.0 (WinWrap Basic, Copyright 1993-2007 Polar Engineering and Consulting) to perform the statistical analysis and to create the graphics.
RESULTS
Exposure assessment
In the group of individuals with severe dry eye syndrome the levels of exposure were as follows: low level of exposure to NO2 (<20 µg/m3), 10 individuals; moderate level of exposure to NO2 (20 µg/m3 to 30 µg/m3), 6 individuals; high level of exposure to NO2 (>30 µg/m3), 14 individuals.
In the healthy volunteer group the levels of exposure to NO2 was as follows: low level of exposure to NO2 10 individuals; moderate level of exposure to NO2: 7 individuals; high level of exposure to NO2: 13 individuals.
Questionnaire relating to ocular surface signs and symptoms (ocular surface disease index, OSDI) according to the level of exposure
The only a significant difference we found in the patients group (intragroup) in the OSDI was between low and high exposures (p<0.01); in the healthy volunteer group (intragroup) there was a significant difference between all three groups (p<0.01) (Figure 1A). The intergroup figure clearly shows that, with a similar level of exposure, patients presented a higher symptom score according to the OSDI questionnaire than did the control group (p<0.01) (Figure 1B).
Schirmer 1 test (without anesthesia) according to the levels of exposure in each group
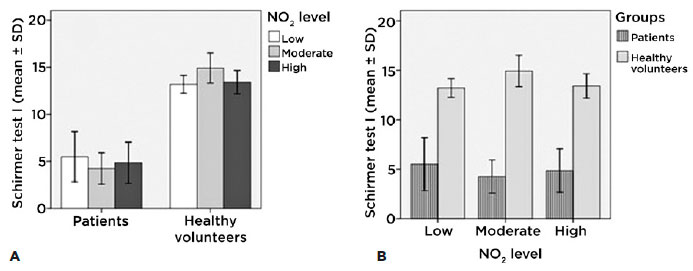
Among patients with different levels of exposure, we found no significant changes (Figure 2A). On the other hand, with similar levels of exposure patients presented less lacrimal secretion, a phenomonon justified by their ocular surface pathology (Figure 2B).
Tear break-up time (TBUT) according to the levels of exposure of each group
We found significant differences in TBUT in patients (intragroup) with low levels of exposure compared to those with high levels of exposure (p<0.01). In the healthy volunteer group (intragroup) we found significant differences among all three groups (low and moderate (p<0.05); low and high (p<0.001); and moderate and high (p<0.001)) (Figure 3A).
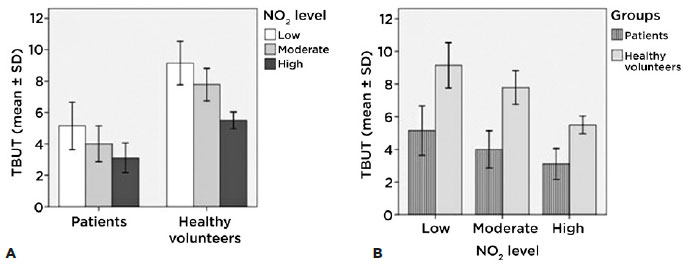
The intergroup figure shows clearly that-according to the TBUT-there are significant differences (p<0.001) between the patients and the control group: for similar levels of exposure the patients presented lower stability of the tear film than did the control group (Figure 3B).
Lissamine green according to levels of exposure of each group
We found significant differences between patients (intragroup) with low levels of exposure and those with high levels of exposure (p<0.001), and between those with moderate levels of exposure and high levels of exposure (p<0.001). In the healthy volunteer group (intragroup) we found significant differences between low levels of exposure and high levels of exposure (p<0.001) (Figure 4A). These results clearly show a connection between the level of exposure to NO2 and ocular surface damage.
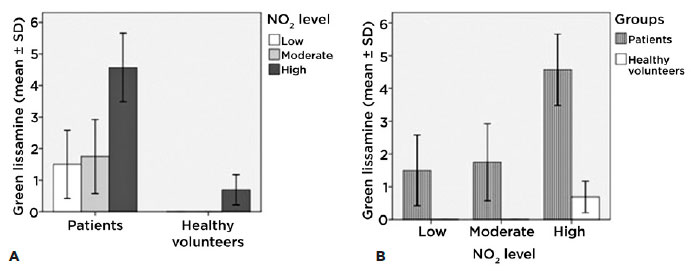
We can see in the intergroup figure that at similar levels of exposure the patient group presented more ocular surface damage than did the control group (p<0.001) (Figure 4B).
Corneal dye/staining with 2% fluorescein with slit lamp according to the levels of exposure of each group
There were significant differences among patients (intragroup) with low exposure levels and those with high exposure levels (p<0.001). We found no such differences in the healthy volunteer group (intragroup). We also demonstrated that the extent of corneal damage is directly related to the level of exposure (Figure 5A).
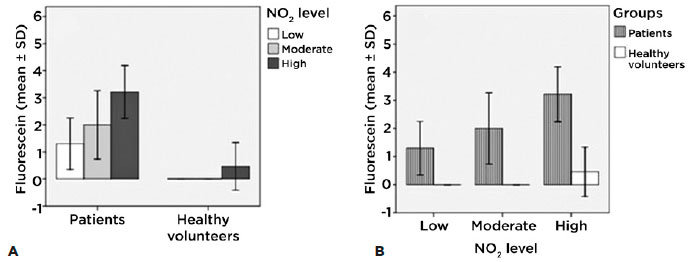
The intergroup figure shows that there are significant differences between all levels of exposure (p<0.01) (Figure 5B).
Impression cytology according to levels of exposure of each group
We found significant differences between patients (intragroup) with low exposure levels compared with those with high exposure levels (p<0.001) and between those with moderate exposure levels compared with those with high exposure levels (p<0.001). According to results obtained with lissamine green, in the healthy volunteer group (intragroup) we found significant differences among those with low exposure levels compared with those with high exposure levels (p<0.001) and between those with moderate exposure levels compared with those with high exposure levels (p<0.01) (Figure 6A).
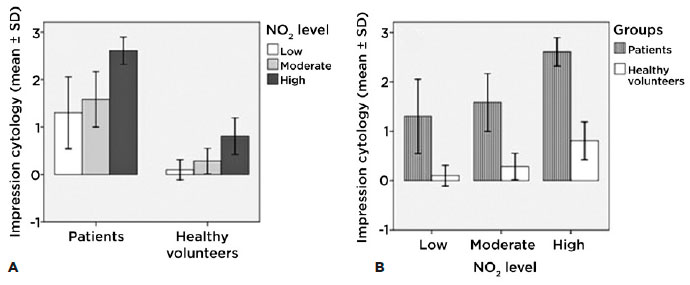
The intergroup figure also demonstrates the differences (p<0.001) between low and high levels of exposure. Conjunctival impression cytology has shown with lissamine green staining that the affectation of the ocular surface reveals how the damage from chronic exposure is connected to high levels of NO2 (Figure 6B).
Lacrimal lysozyme and levels of exposure of each group
We found no significant differences as regards lacrimal lysozyme among patients (intragroup) at each level of exposure, nor among the control group (intragroup). Lysozyme levels were not affected by NO2 exposure because patients with Sjögren dry eye syndrome present low levels of this enzyme (Figure 7A).
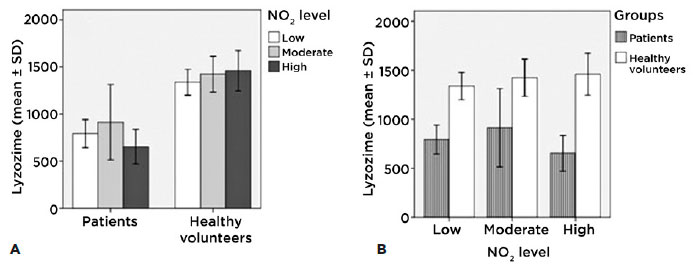
The intergroup figure shows differences (p<0.001) between patients and the control groups for all levels of exposure; at all three levels of exposure, patients show values under 1000 µg/ml, as is justified by their pathology (Figure 7B).
DISCUSSION
Epidemiological studies have revealed that a significantly higher proportion of persons residing in the metropolis had tear film abnormalities as compared with those staying outside the metropolis(5). Another study showed that in persons traveling in highly polluted areas, subclinical ocular surface changes were found(3), and also proposed that the ocular mucosa-constantly exposed to the external environment-may be a bioindicator of exposure to air pollution(6).
This study has focused on a topic that has been unexplored. No currently available publications evaluate the effect of environmental pollution on the ocular surface of patients with severe dry eye syndrome. Our analysis took place in Buenos Aires City and its surrounds.
We studied and evaluated thirty patients with dry eye syndrome associated with SS and thirty healthy patients living in the same environment. We were able to prove that in both groups the results of various ophthalmic tests-such as signs, symptoms and laboratory results-were affected according to the level of environmental pollution to which they had been exposed. We were also able to demonstrate the more severe level of impact of the exposure to urban pollution (NO2) experienced by patients with dry eye syndrome associated with SS than that experienced by the control group. We additionally demonstrated that those with higher exposure to nitrogen dioxide demonstrated more severe cases of ocular surface damage.
The present study has allowed us to learn that urban air contamination can have a great impact on severe dry eye syndrome and must be taken into account when giving therapeutic recommendations to patients.
We are convinced that the knowledge of the impact of the environment on patients with dry eye syndrome and the use of this information in therapeutic recommendations can improve their quality of life.
The ophthalmic examinations of these patients should include the reading of NO2 concentrations in their environment as an air contaminant agent witness. In cases of patients residing in areas with high NO2 contamination, a change of residency should be included in the course of treatment of severe dry eye syndrome.
In conclusion, our study shows that environmental pollution generates greater damage in patients with SS than in healthy subjects, and that the measurement of the levels of air pollution may be useful in the management of the disease.
REFERENCES
1. Touloumi G, Katsouyanni K, Zmirou D, Schwartz J, Spix C, de Leon AP, et al. Short-term effects of ambient oxidant exposure on mortality: a combined analysis within the APHEA project. Air Pollution and Health: a European Approach. Am J Epidemiol. 1997;146(2):177-85.
2. Kunzli N, Medina S, Kaiser R, Quenel P, Horak F, Jr., Studnicka M. Assessment of deaths attributable to air pollution: should we use risk estimates based on time series or on cohort studies? Am J Epidemiol. 2001;153(11):1050-5.
3. Saxena R, Srivastava S, Trivedi D, Anand E, Joshi S, Gupta SK. Impact of environmental pollution on the eye. Acta Ophthalmol Scand. 2003;81(5):491-4.
4. Versura P, Profazio V, Cellini M, Torreggiani A, Caramazza R. Eye discomfort and air pollution. Ophthalmologica. 1999;213(2):103-9.
5. Gupta SK, Gupta V, Joshi S, Tandon R. Subclinically dry eyes in urban Delhi: an impact of air pollution? Ophthalmologica. 2002;216(5):368-71.
6. Novaes P, Saldiva PH, Matsuda M, Macchione M, Rangel MP, Kara-Jose N, et al. The effects of chronic exposure to traffic derived air pollution on the ocular surface. Environ Res. 2010;110(4):372-4.
7. Berra M, Galperin G, Dawidowski L, Tau J, Marquez I, Berra A. Impact of wildfire smoke in Buenos Aires, Argentina, on ocular surface. Arq Bras Oftalmol. 2015;78(2):110-4.
8. Ramos-Casals M, Solans R, Rosas J, Camps MT, Gil A, Del Pino-Montes J, et al. Primary Sjogren syndrome in Spain: clinical and immunologic expression in 1010 patients. Medicine (Baltimore). 2008;87(4):210-9.
9. Shiboski SC, Shiboski CH, Criswell L, Baer A, Challacombe S, Lanfranchi H, et al. American College of Rheumatology classification criteria for Sjogren’s syndrome: a data-driven, expert consensus approach in the Sjogren’s International Collaborative Clinical Alliance cohort. Arthritis Care Res (Hoboken). 2012;64(4):475-87.
10. Bunya VY, Bhosai SJ, Heidenreich AM, Kitagawa K, Larkin GB, Lietman TM, et al. Association of Dry Eye Tests With Extraocular Signs Among 3514 Participants in the Sjogren’s Syndrome International Registry. Am J Ophthalmol. 2016;172:87-93.
11. Whitcher JP, Shiboski CH, Shiboski SC, Heidenreich AM, Kitagawa K, Zhang S, et al. A simplified quantitative method for assessing keratoconjunctivitis sicca from the Sjogren’s Syndrome International Registry. Am J Ophthalmol 2010;149(3):405-15.
12. Novaes P, do Nascimento Saldiva PH, Kara-Jose N, Macchione M, Matsuda M, Racca L, et al. Ambient levels of air pollution induce goblet-cell hyperplasia in human conjunctival epithelium. Environ Health Perspect. 2007;115(12):1753-6.
13. van Bijsterveld OP. Diagnostic tests in the Sicca syndrome. Arch Ophthalmol. 1969;82(1):10-4.
14. Methodologies to diagnose and monitor dry eye disease: report of the Diagnostic Methodology Subcommittee of the International Dry Eye WorkShop (2007). Ocul Surf. 2007;5(2):108-52.
15. Nelson JD. Impression cytology. Cornea 1988;7(1):71-81.
16. Gonzalez-Garcia MJ, Gonzalez-Saiz A, de la Fuente B, Morilla-Grasa A, Mayo-Iscar A, San-Jose J, et al. Exposure to a controlled adverse environment impairs the ocular surface of subjects with minimally symptomatic dry eye. Invest Ophthalmol Vis Sci. 2007;48(9): 4026-32.
17. Jones LT. The lacrimal secretory system and its treatment. J All India Ophthalmol Soc 1966;14(5):191-6.
Submitted for publication:
October 19, 2017.
Accepted for publication:
March 13, 2018.
Funding: No specific financial support was available for this study
Disclosure of potential conflicts of interest: None of the authors have any potential conflicts of interest to disclose
Approved by the following Research Ethics Committee: Hospital Oftalmológico Pedro Lagleyze (# 37/14)
© 2024 - All rights reserved - Conselho Brasileiro de Oftalmologia
![]()
 English PDF
 Print
Print
 Send this article by email
 How to cite this article
 Submit a comment
 Mendeley
 Pocket
