

INTRODUCTION
Imaging the choroid is not easy with commercial standard spectral domain optical coherence tomography (SD-OCT) because of blocking of signal transmission by the retinal pigment epithelium. Recent modifications in enhanced depth imaging optical coherence tomography (EDI-OCT) allow imaging of the choroid with reasonable clarity(1).
The choroid has the highest blood supply per area of any tissue(2). It has long been thought that, unlike retinal blood flow, choroidal blood flow does not exhibit autoregulation(3). However, recent studies have shown that choroidal blood flow can autoregulate according to fluctuations in systemic blood pressure(4,5). In addition to diurnal or circadian variations of intraocular pressure (IOP) and anterior chamber depth, diurnal variations of choroidal thickness (CT) have been reported, and it was found that these changes are associated with changes in systemic blood pressure(6-8).
It was thought that after a single hemodialysis session, some changes could be observed in systemic hemodynamic and ocular parameters. It was reported that hemodialysis usually reduces blood pressure and body weight and increases the concentration of plasma proteins, which is related to a decrease in plasma volume and leads to an increase in plasma colloid osmotic pressure(9). After an increase in colloid osmotic pressure in hemodialysis patients, an osmotic pressure gradient develops between the plasma and the interstitial fluid that causes a shift of water from the interstitial fluid to the plasma(10).
The purpose of this study was to evaluate immediate changes in several ocular parameters, including subfoveal choroidal thickness (SFCT), in response to systemic hemodynamic changes induced by hemodialysis. To the best of our knowledge, this is the first study that evaluates ocular changes not only from before to after hemodialysis but also during hemodialysis.
METHODS
Forty-six patients with chronic renal failure (CRF) undergoing hemodialysis in the Haemodialysis Unit of Pendik Government Hospital were enrolled in this study. The study was approved by the local university ethics committee. Informed consent from all patients and institutional review board approval were obtained in accordance with the Declaration of Helsinki. The inclusion criterion was a best corrected visual acuity (BCVA) >20/200. The exclusion criteria were the presence of ocular disease that would preclude examination of the cornea or macula or a history of ocular surgery, laser, or intravitreal injection during the previous three months.
Nineteen patients were excluded: 14 with diabetes mellitus (DM), 4 with hypertensive nephrosclerosis, and 1 with polycystic kidney disease whose choroidal tissue could not be clearly visualized by SD-OCT (signal image <8) in both eyes. The measurements were taken from the right eye except for four patients in whom SFCT could not be measured in the right eye. Thus, 27 eyes of 27 patients were included in the study.
The patients underwent hemodialysis three times per week for an average of 4 to 4.5 hours with the use of a high-performance dialyzer at a blood flow rate of 250 mL/min. The causes of CRF in the 27 patients were hypertensive nephrosclerosis (n=13), DM (n=7), polycystic kidney disease (n=3), chronic glomerulonephritis (n=2), and idiopathic renal failure (n=2). Four patients with DM also suffered from hypertension. Patients with CRF and DM (n=7) were diagnosed with nonproliferative diabetic retinopathy (NPDR) in three eyes and proliferative diabetic retinopathy (PDR) in four eyes. Three patients with PDR had previously undergone panretinal laser photocoagulation treatment. Two patients underwent a focal or grid laser or intravitreal injection for diabetic macular edema.
A detailed ophthalmologic examination, including IOP, central corneal thickness (CCT), iridocorneal angle (ICA), and SFCT, was performed on each patient. The patients were examined in their beds in the sitting position just before and half an hour after a single hemodialysis session and also during the second hour of hemodialysis. The hemodialysis sessions started around 8:00 to 9:00 AM, and three or four patients were examined per day.
For IOP measurements, a tonometer (Tonopen-Avia, Reichert, Depew, NY, USA) was used. The measurements were taken with the patient in the sitting position and repeated three times. The mean value was noted.
CCT, ICA, and SFCT were measured with an SD-OCT device (Nidek RS-3000 Advance, Nidek Co, Aichi, Japan). For measurements of CCT and ICA, the anterior segment attachment of the device was used. A horizontal cross section of the central cornea was taken for CCT measurements. Care was taken that all measurements were obtained from the same section. The average of the measured three points, obtained automatically by the device, was used for calculating corneal thickness (Figure 1).
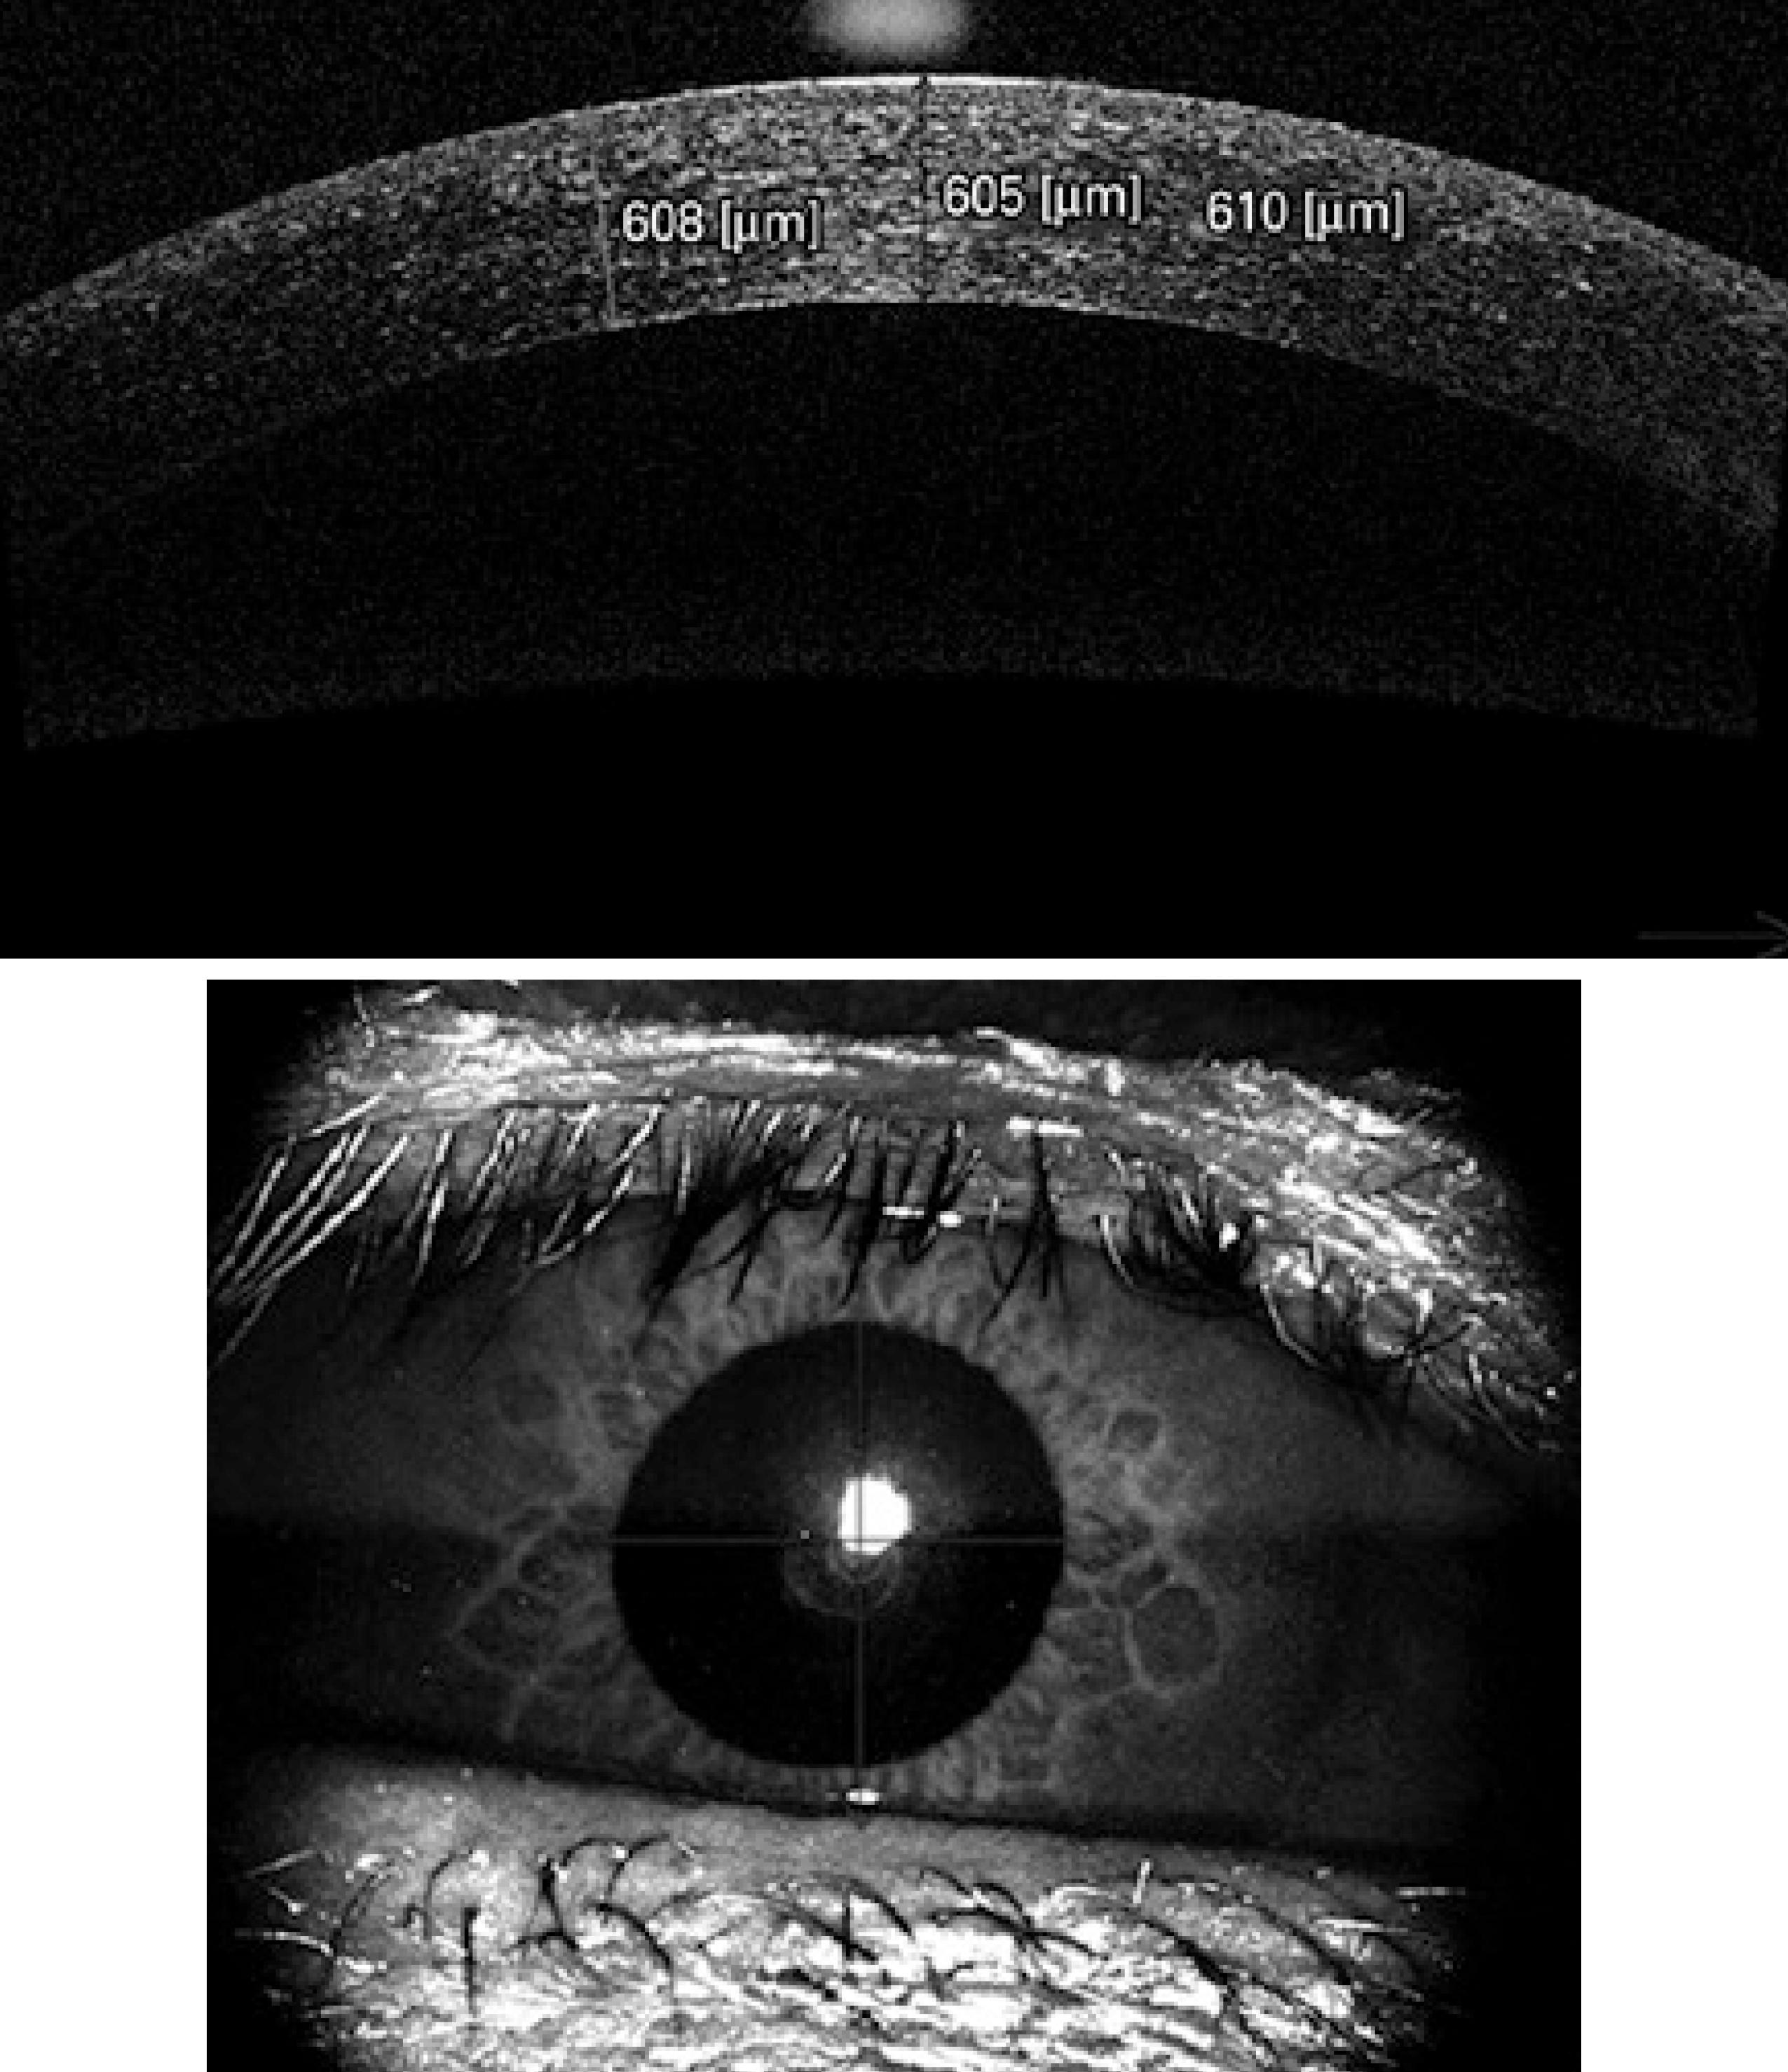
Figure 1 Optical coherence tomography image of central corneal thickness (CCT) measurement in a patient
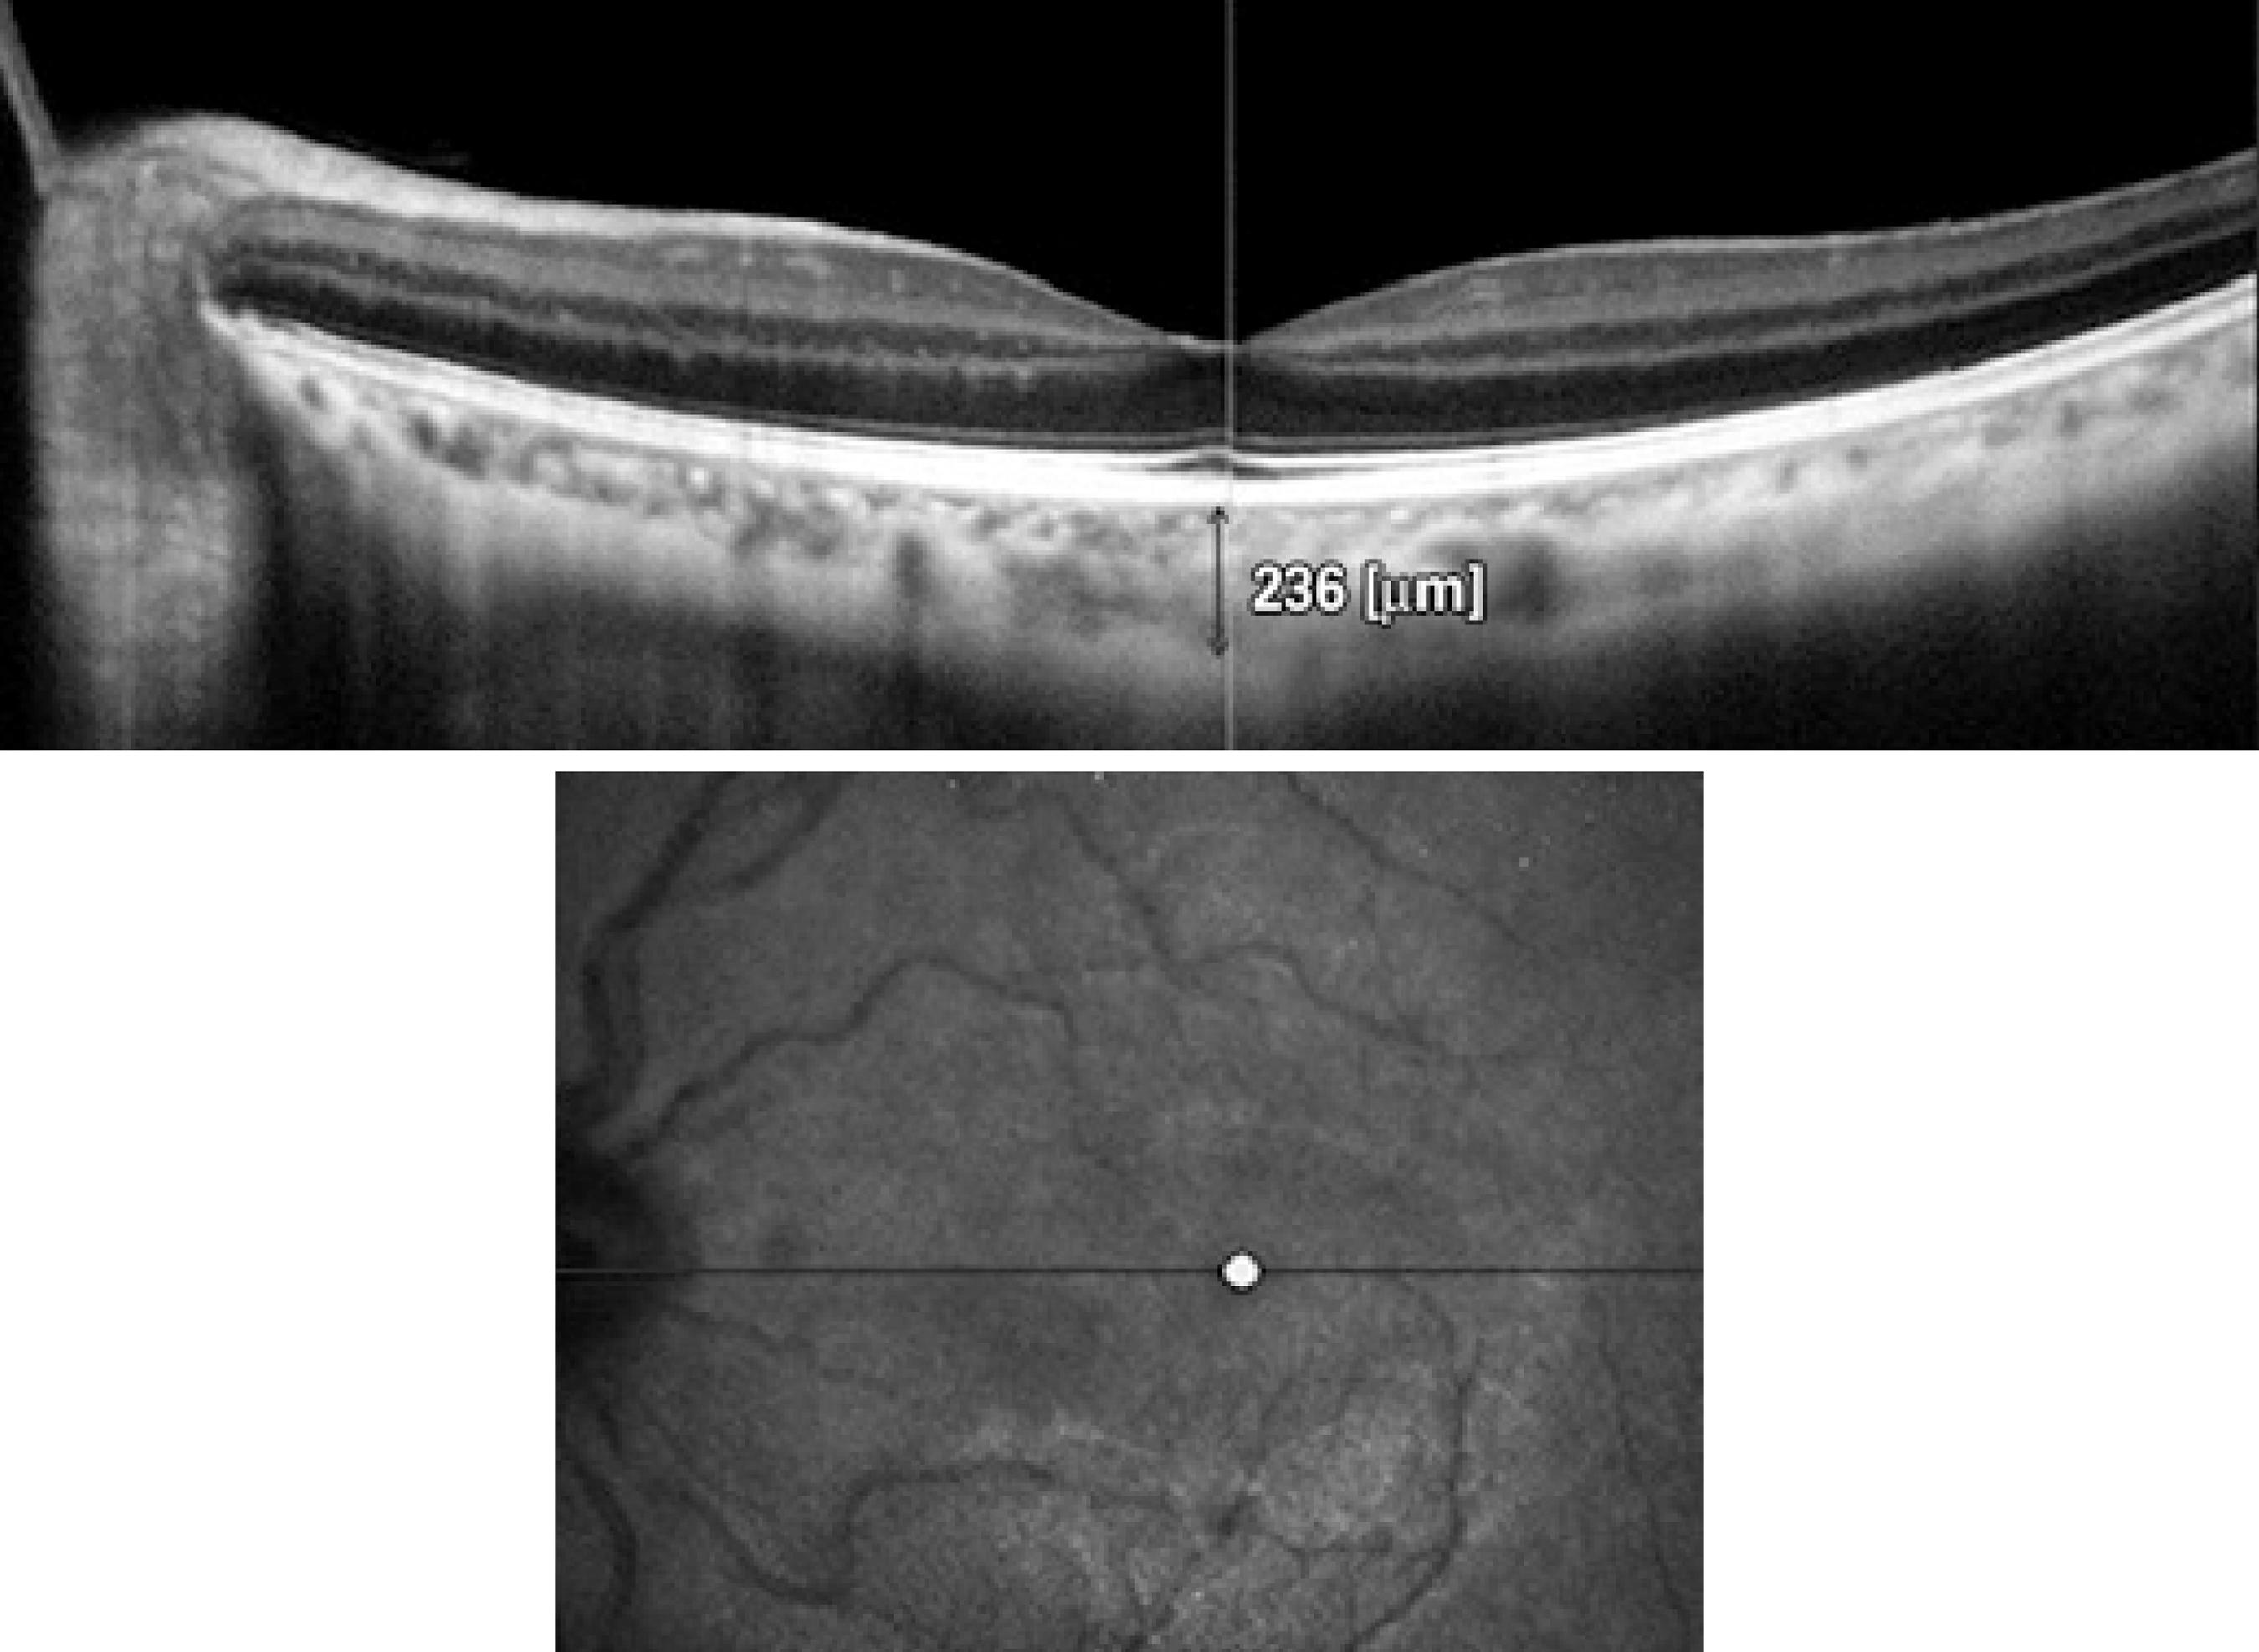
The iridocorneal angle could be measured in 24 eyes of 27 patients. One section was taken from the nasal quadrant for ICA measurement. All measurements were taken from the same section. To calculate the ICA, first the scleral spur point on the OCT image was manually marked. Then, a circle with 750-µm radius centered on this scleral spur point was displayed. After another point was marked on the intersection of this circle and the posterior surface of the cornea, a red line was displayed vertically from this point. After marking a third point on the intersection of the red line and the anterior surface of the iris, another red line aligning close to the anterior surface of the iris was displayed. Finally, the red line was manually dragged exactly onto the surface of the iris. Thus, the ICA was displayed and was automatically calculated by the device (Figure 2). The limitations of this method include measurement of only one section and an absence of follow-up. The Macula Line scan protocol and ultrafine mode was used to evaluate SFCT, which enables good-quality depth penetration with 120 averaged B-scans. SFCT was defined as the distance between the hyperscattering line of the retinal pigment epithelial cells and the border between the choroid and sclera, that is, the choroid-scleral interface (CSI)(11). This method of CT analysis involves taking manual measurements perpendicularly from the outer edge of the hyperreflective retinal pigment epithelium to the CSI (Figure 3). All measurements were performed by the same physician. The device has an eye tracking system and reference scans.
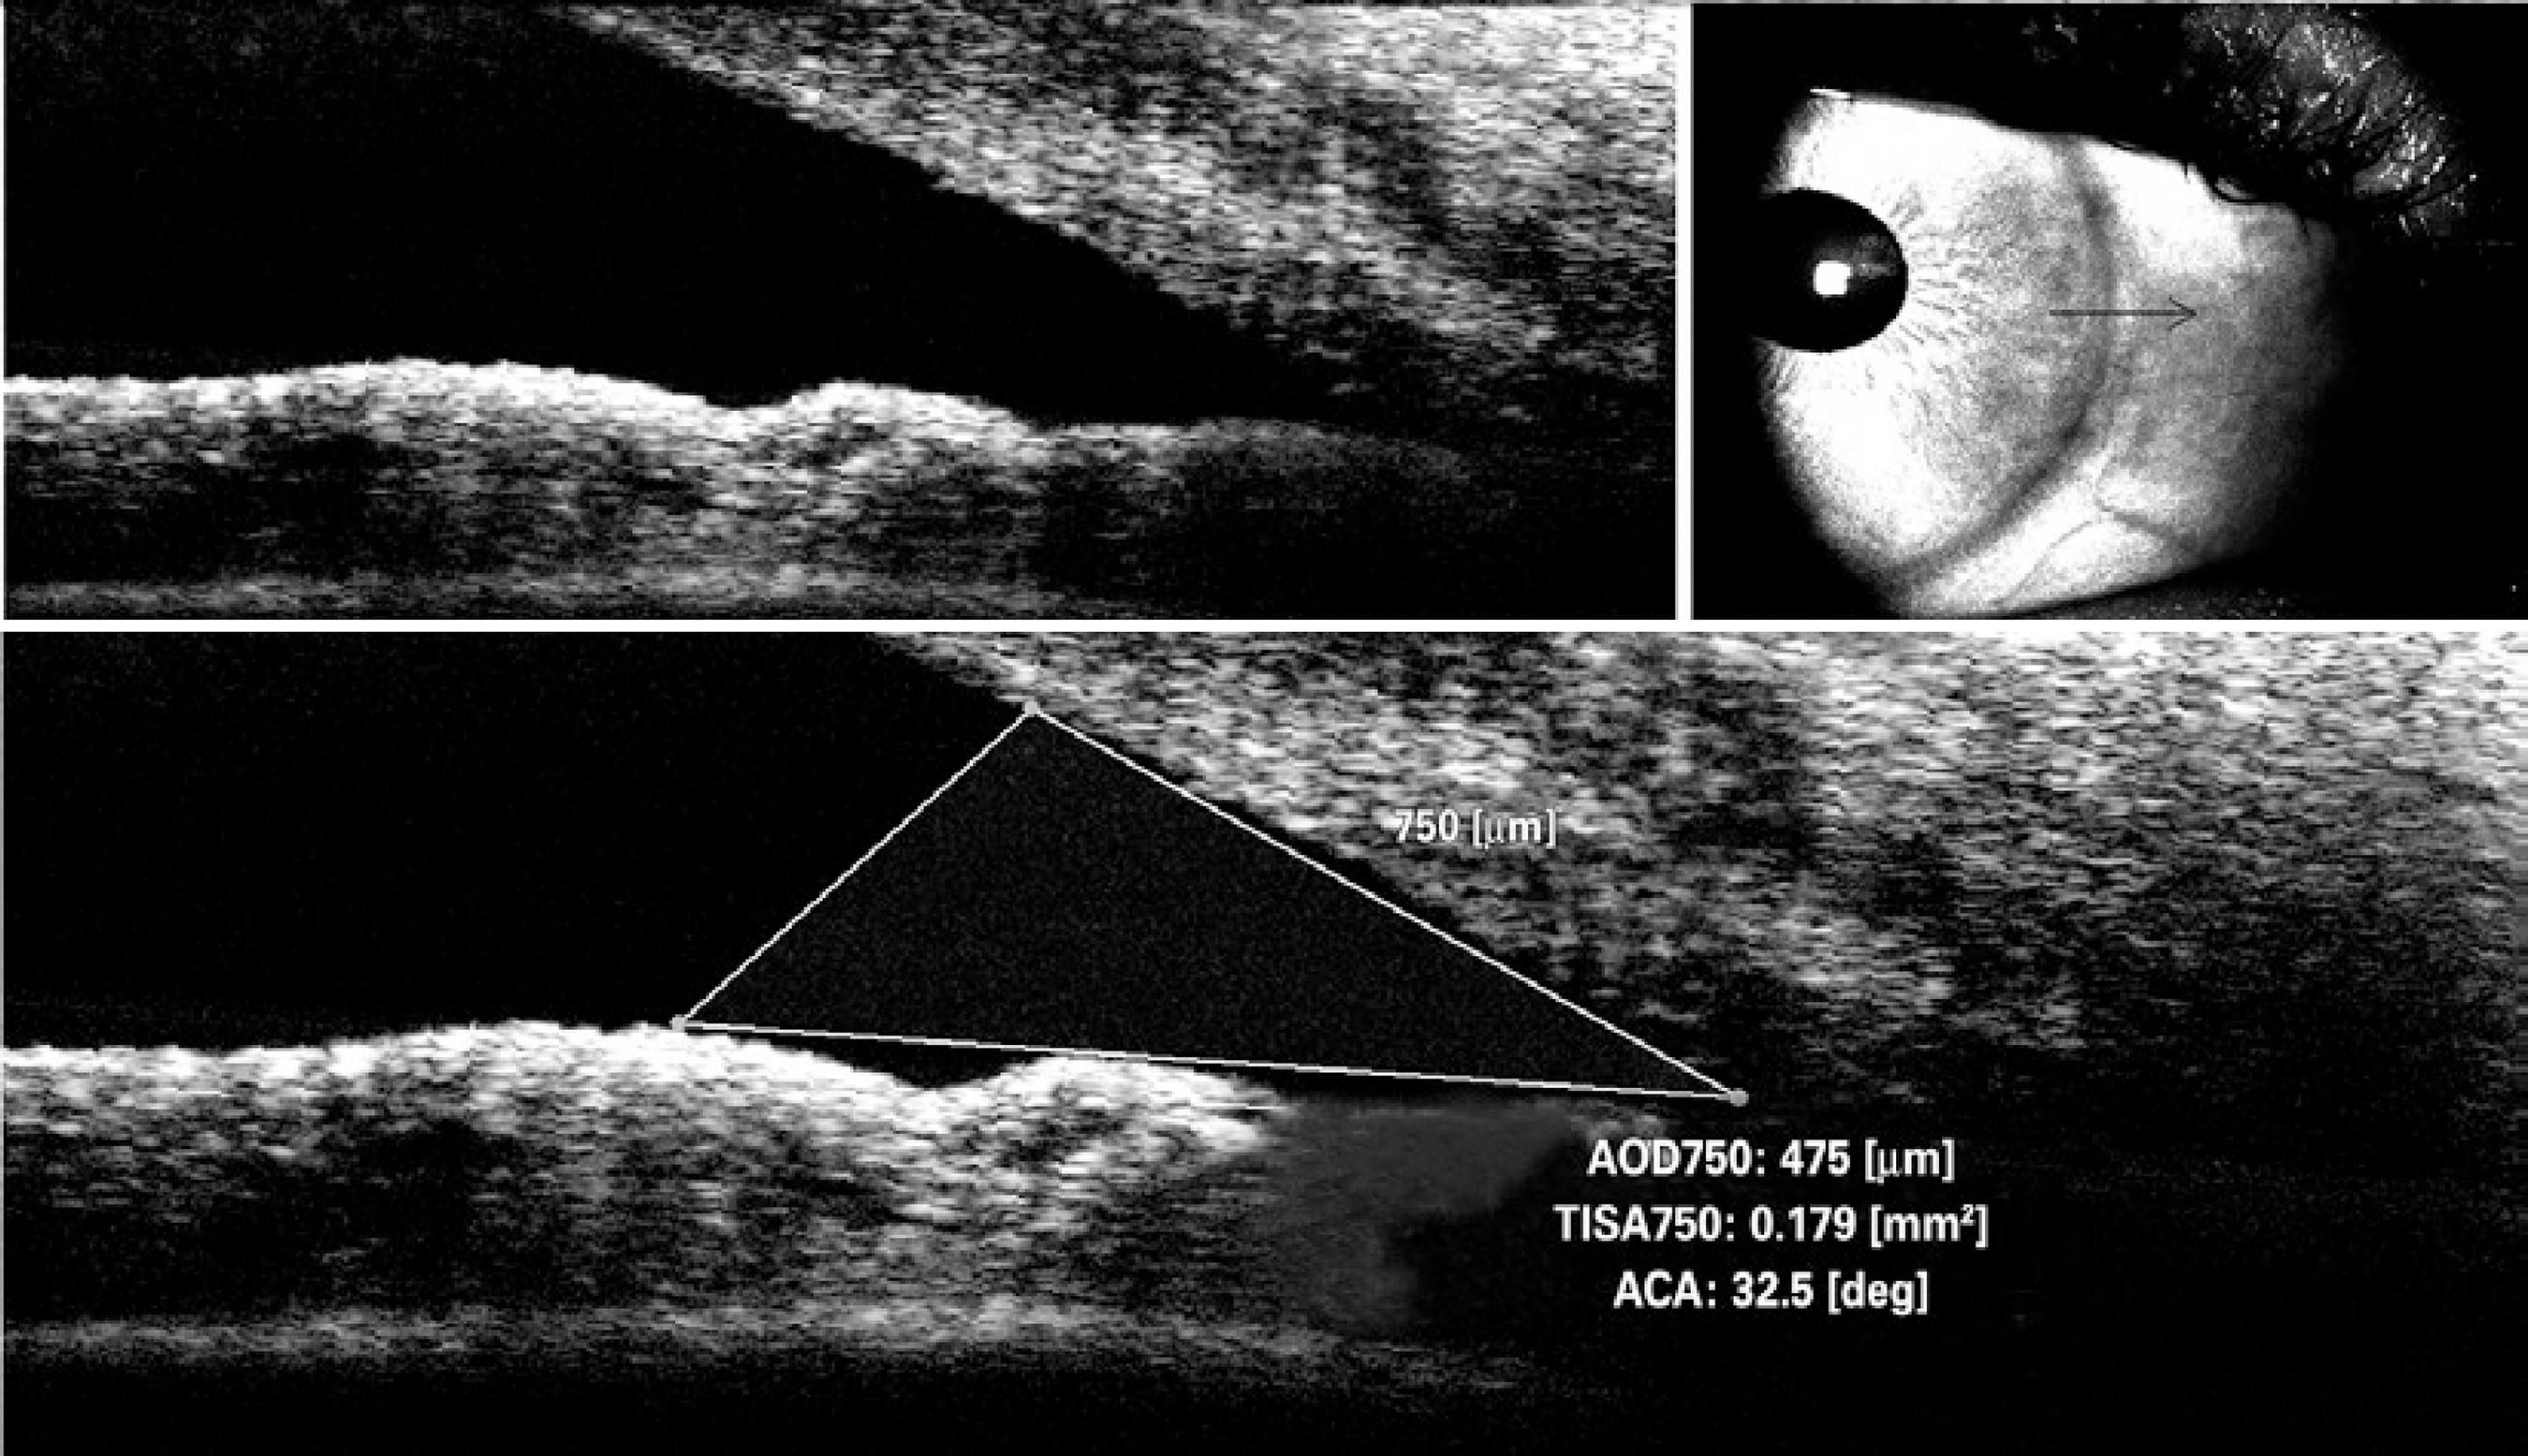
Figure 2 Optical coherence tomography image of iridocorneal angle (ICA) measurement in a patient. Figure 3. Optical coherence tomography image of choroidal thickness (CT) measurement in a patient
Systemic blood pressure was measured at the same time as the ophthalmic examinations. Body weight was measured with a calibrated scale (DESİS M307, ETS Co, Istanbul, Turkey) before and after hemodialysis, with the patient wearing the same clothes. The ultrafiltration volume for each patient was noted after the hemodialysis session from the screen of the dialysis machine (Fresenius 4008-S, Fresenius Medical Care AG, Bad Homburg, Germany).
Statistical analyses were performed with the Statistical Package for Social Sciences version 20.0 (SPSS, Chicago, IL, USA). Normality was initially assessed by the Kolmogorov-Smirnov test. Numerical data are expressed either as the median (minimum and maximum) or the mean ± standard deviation. The paired t-test or Wilcoxon test was used to compare means or medians, and the Pearson correlation test or Spearman’s rho correlation test was used to evaluate the correlations of numerical variables. A p value<0.05 was required for statistical significance.
RESULTS
Demographic characteristics
A total of 27 eyes from 27 patients (16 men and 11 women; aged 20-82 years, mean age 54.92 ± 18.84 years) were examined in this study. The patients had been undergoing dialysis for a mean of 3.37 ± 2.30 years. Table 1 summarizes the demographic and clinical characteristics of the patients.
Effect of hemodialysis on systemic parameters
Body weight decreased significantly from 64.53 ± 12.71 kg before hemodialysis to 62.41 ± 12.25 kg after hemodialysis (p<0.001). Systolic blood pressure (SBP) decreased significantly from 140 (80-180) mmHg before hemodialysis to 120 (50-170) mmHg during the second hour of hemodialysis (p<0.01) and 120 (80-260) mmHg after hemodialysis (p<0.001). Diastolic blood pressure (DBP) was 80 (50-110) mmHg before hemodialysis, 80 (30-100) mmHg during the second hour of hemodialysis, and 70 (40-120) mmHg after hemodialysis; the differences were not statistically significant (p=0.701 and p=0.054, respectively) (Table 2).
Table 2 Effect of hemodialysis on systemic parameters (n=27)
| Variable | Pre-HD | 2nd hour of HD | Post-HD |
|---|---|---|---|
| SBP (mmHg), median (range) | 140 (80-180) | 120 (50-170) p=0.002* |
120 (80-260) p<0.001* |
| DBP (mmHg), median (range) | 080 (50-110) | 080 (30-100) p=0.701* |
070 (40-120) p=0.054* |
| Body weight (kg), mean ± SD | 64.53 ± 12.71 | - | 62.41 ± 12.25 p<0.001** |
HD= hemodialysis; SBP= systolic blood pressure; DBP= diastolic blood pressure.
*Wilcoxon test.
**Paired sample t-test.
Effect of hemodialysis on ocular parameters
Mean SFCT decreased significantly from 270.85 ± 73.82 µm before hemodialysis to 257.01 ± 71.49 µm during the second hour of hemodialysis (p<0.001). After hemodialysis, it increased slightly to 258.44 ± 75.17 µm, but it was still significantly lower than before hemodialysis (p<0.001).
Mean IOP increased significantly from 16.20 ± 3.27 mmHg before hemodialysis to 18.28 ± 3.79 mmHg during the second hour of hemodialysis (p=0.001). After hemodialysis, it decreased to 16.09 ± 2.97 mmHg, which did not differ significantly from the value before hemodialysis (p=0.844).
Mean CCT increased significantly from 546.11 ± 35.14 µm before hemodialysis to 553.89 ± 33.89 µm during the second hour of hemodialysis (p=0.011). However, no significant difference was observed after hemodialysis (550.44 ± 31.39 µm, p=0.246).
Mean ICA decreased slightly during the second hour of hemodialysis, then increased slightly after hemodialysis. There were no significant differences from the values before hemodialysis (p=0.101 and p=0.589, respectively). Table 3 summarizes the effects of hemodialysis on ocular parameters.
Table 3 Effect of hemodialysis on ocular parameters
| Variable | Pre-HD | 2nd hour of HD | Post-HD |
|---|---|---|---|
| SFCT (n=27, µm) (mean ± SD) | 270.85 ± 73.82 | 257.01 ± 71.49 p<0.001* |
258.44 ± 75.17 p<0.001* |
| IOP (n=27, mmHg) (mean ± SD) | 016.20 ± 03.27 | 018.28 ± 03.79 p=0.001* |
016.09 ± 02.97 p=0.844* |
| CCT (n=27, µm) (mean ± SD) | 546.11 ± 35.14 | 553.89 ± 33.89 p=0.011* |
550.44 ± 31.39 p=0.246* |
| ICA (n=24º) (mean ± SD) | 035.74 ± 07.85 | 034.79 ± 07.65 p=0.101* |
035.38 ± 07.43 p=0.589* |
HD= hemodialysis; SFCT= subfoveal choroidal thickness; IOP= intraocular pressure; CCT= central corneal thickness; ICA= iridocorneal angle.
*Paired sample t-test.
Associations between changes in SFCT and other parameters
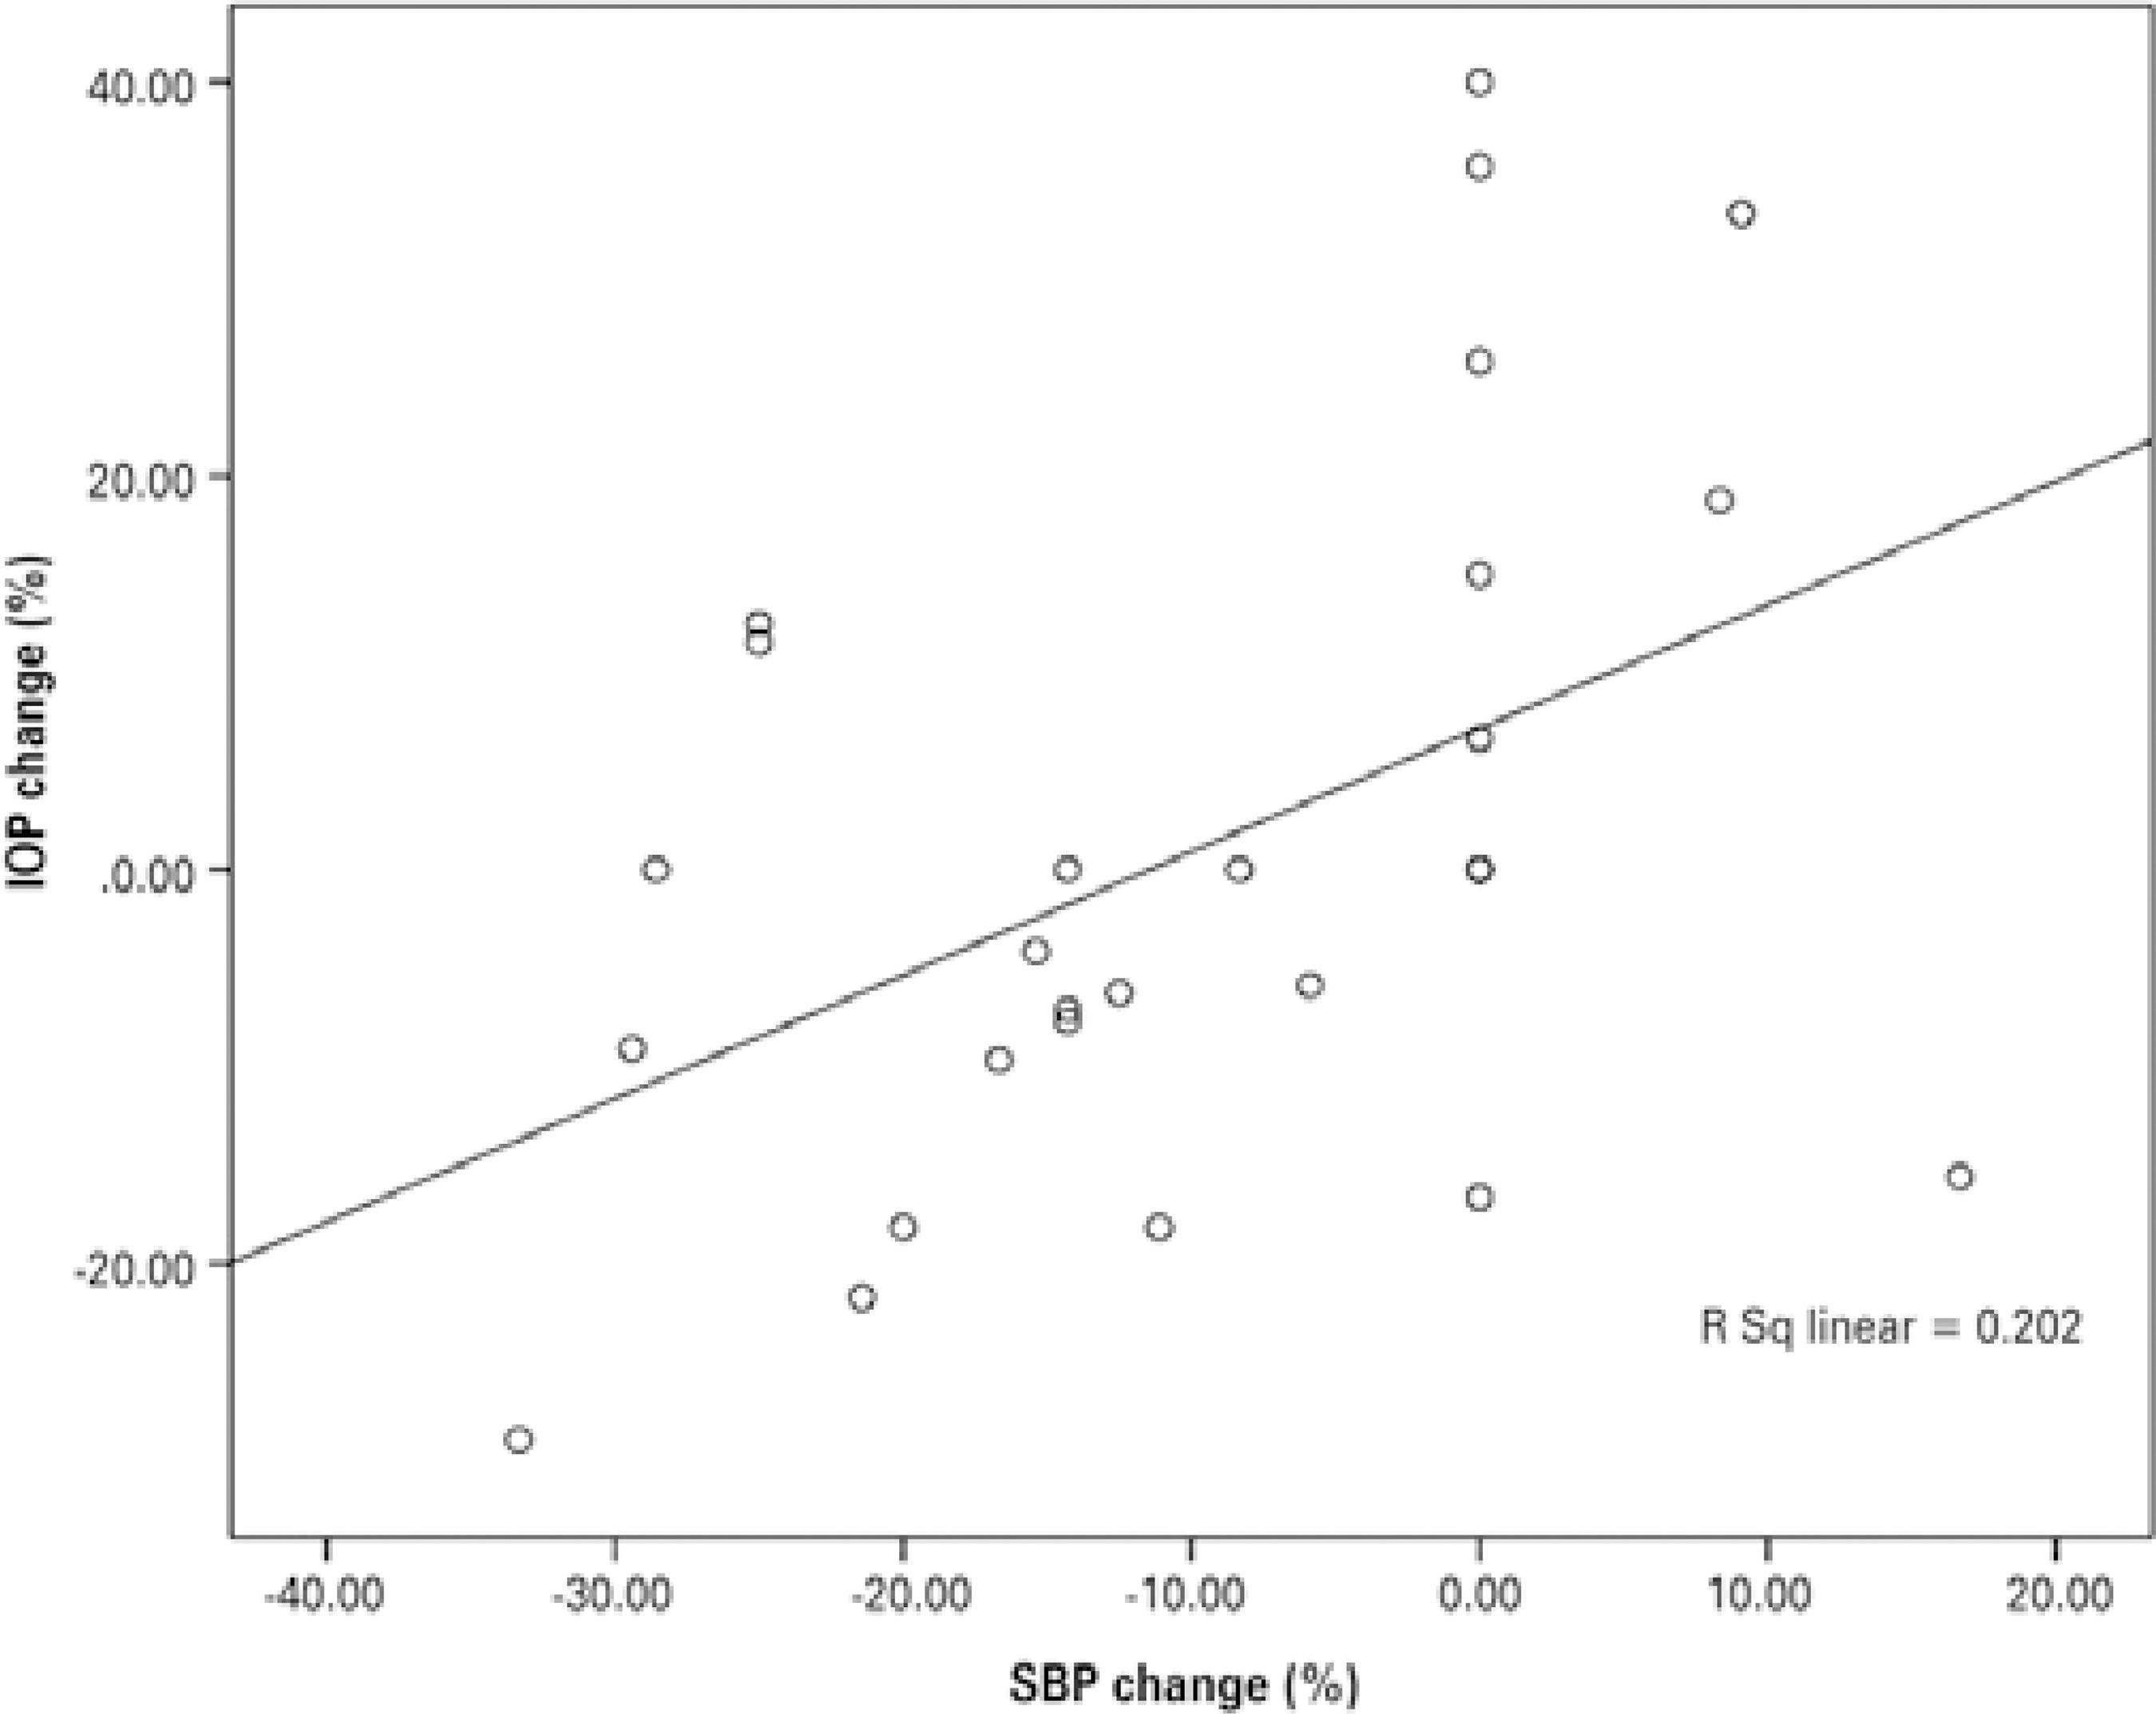
No significant correlations were observed between the percentage changes in SFCT and other ocular and systemic parameters. On the other hand, the percentage changes in IOP from before to after hemodialysis were positively correlated with changes in SBP (r=0.449, p=0.019) (Figure 4). The power of these tests was calculated as between 0.497 and 0.509.
DISCUSSION
Patients with CRF are treated with hemodialysis. Although hemodialysis is relatively effective, it has some side effects on systemic and ocular parameters. There is a wide range of ocular changes, including refractive changes, increased tear osmolarity, dry eye, corneal endothelium changes, band keratopathy, and lenticular opacity(10). Macular and retinal alterations have also been reported(12).
It is important to consider the potential effects of normal diurnal variation of IOP, CCT, and especially CT on the reported results(7,8). One study reported that CT decreased progressively during the period from 9:00 AM to 5:00 PM, which is presumably when the hemodialysis treatments were performed(7). However, Usui et al. found that CT did not change significantly between 9:00 and 12:00 AM(8). Therefore, we measured the ocular parameters in the morning hemodialysis sessions, not only before and after hemodialysis but also during hemodialysis.
In addition, hemodialysis has some unfavorable side effects on systemic parameters. One of the most frequent complications of hemodialysis is hypotension. It has been reported that the systemic parameters blood pressure, body weight, and serum osmolarity significantly decreased and plasma colloid osmotic pressure significantly increased after a single session of hemodialysis(9,10). During a single session, removal of 2 to 4 L of fluid is probably the most important factor in dialysis-induced hypotension and decrease in body weight. Autonomic nervous system dysfunction, which is common among dialysis patients, contributes to the pathogenesis of hypotension(13). In agreement with other reports, we found that mean systolic and diastolic blood pressure and body weight decreased significantly after hemodialysis.
A structurally and functionally normal choroidal tissue is essential for retinal function. Abnormal choroidal blood flow can result in dysfunction and death of photoreceptors(14). The choroid also modulates IOP by vasomotor control of blood flow and outflow of aqueous humor from the anterior chamber via the uveoscleral pathway, which is responsible for approximately 35% of the drainage(5).
Imaging the choroid with conventional SD-OCT has been difficult, mainly because of the difficulty in signal transmission beyond the retinal pigment epithelium. Recent modifications have provided a reasonably clear image of the choroid(1). We investigated SFCT with macula line scan protocol and ultrafine mode in this study, which enables good-quality depth penetration with 120 averaged B-scans.
CT varies for several reasons. A recent review suggested five hypotheses that include redistribution of fluid as the cause of CT changes(15). First, it is possible that the increase in thickness is due to increased synthesis of proteoglycans, which would draw water into the choroid. Second, the increase in thickness could be the result of an increase in the size or number of fenestrations in the choriocapillaris. Third, fluid could enter the choroid as part of the drainage from the anterior chamber. Fourth, the fluid could enter as a result of altered transport of fluid from the retina across the retinal pigment epithelium. Finally, the increase in thickness could be due to changes in nonvascular smooth muscle tonus. Previous studies have reported age, axial length, and refractive error as factors affecting CT(16,17). Recent investigations have shown that choroidal autoregulation or baroregulation can compensate for systemic blood pressure fluctuations(4). Hemodialysis and associated changes in systemic circulatory parameters, such as systemic blood pressure, hematocrit, and the amount of fluid removed, may affect the retinal and choroidal circulation, which decrease after hemodialysis(18).
In our study, mean SFCT decreased significantly during hemodialysis. Although SFCT increased slightly just after hemodialysis, it was still significantly thinner than before hemodialysis. Two recent studies by Ulas et al. and Celikay et al. reported similar results(19,20).
Conversely, Usui et al. and Jung et al. reported increased SFCT after hemodialysis(5,8). They suggested that SFCT was significantly negatively correlated with SBP and that the increase in SFCT was due to vasodilation of choroidal vessels induced by a choroidal autoregulatory response to the reduction in blood pressure.
There are contradictory reports about the relationship between SBP and SFCT. Tan et al.(7) found a positive correlation between diurnal SBP and SFCT changes. On the other hand, Ulas et al.(19) found that mean arterial pressure did not change after dialysis. They did not observe any correlation between changes in mean SBP and SFCT. Recently, Celikay et al.(20) suggested that SBP, DBP, and SFCT decreased after hemodialysis. Although there was no correlation between the changes in SFCT and SBP, there was a positive correlation between changes in SFCT and DBP. In our study, mean SFCT and SBP decreased after hemodialysis, but there was no significant change in DBP after hemodialysis. SBP increased in only four patients and decreased by more than 30 mmHg in three patients. Additionally, we did not observe any significant correlations among changes in SBP, DBP, and SFCT. However, the power analysis of the correlation tests of the present study did not reveal strong findings. Further research with a larger sample size is needed to clarify the matter.
In a previous study, color Doppler ultrasonography revealed that the velocity of systolic and diastolic blood flow in the ophthalmic artery, central retinal artery, and posterior ciliary arteries significantly decreased after hemodialysis when compared with predialysis values(14). This decrease may be the cause of the choroidal thinning that we observed.
On the other hand, an important mechanism in the changes in ocular parameters related to hemodialysis is shifting of fluid and molecules between the blood and intraocular fluids, including the aqueous humor, vitreous, and choroidal interstitium. There seem to be two intradialytic forces that affect ocular structures: ultrafiltration and solute clearance. During hemodialysis, ultrafiltration gives rise to a gradual decrease in the volume of the liquid in the extracellular fluid compartment. Ultrafiltration finally increases the oncotic pressure of the extracellular space, resulting in pulling out of fluid from the surrounding tissues. During hemodialysis, the efflux of water from the eye to the plasma occurs due to an increase in plasma colloid osmotic pressure(21). These changes can lead to a decrease in CT(20,21). Therefore, ultrafiltration-induced hypovolemia and increased plasma colloid osmotic pressure are thought to play a role in choroidal thinning. Several studies found that retinal thickness and macular edema decreased after hemodialysis(10), a result compatible with this idea. Significant retinal thinning has also been observed in diabetic patients after hemodialysis(22,23). Decreases in corneal thickness and IOP after a hemodialysis session have been mentioned in some studies with similar mechanisms of changing the extracellular fluid compartment(10,21,24).
In the early period of dialysis, a different mechanism has a role. As mentioned above, in hemodialysis patients with narrow angles, neovascular glaucoma, or exfoliative glaucoma, a peak in IOP was observed after hemodialysis(25,26). According to this mechanism, a rapid fall in plasma osmolarity during hemodialysis results in an osmolar gradient between the plasma and ocular tissue that provokes a shift of fluid into the ocular tissue(25). Burn proposed a similar mechanism and described it as being analogous to cerebral edema in the disequilibrium syndrome(27). This mechanism was further supported by Ghaffariyeh et al.(28), who noted high vitreous urea rebound in a glaucoma patient with increased IOP during hemodialysis. The shift of fluid from the choroid into the eye may lead to choroidal thinning as well as an increase in IOP. In the later period of hemodialysis, the relatively stable SFCT may be related to relatively stable serum osmolarity(29,30), which may result in a decrease in the shift of fluid between the blood, intraocular fluid, and choroidal interstitium.
A significant elevation in IOP during hemodialysis may increase the risk of the development and progression of glaucoma. A history of hemodialysis needs to be considered in anamnesis of patients who have progression of glaucoma, even when IOP has been well controlled. Routine monitoring of IOP during hemodialysis sessions may be beneficial for glaucoma patients to minimize elevation in IOP.
The lack of correlation between mean SFCT change and ultrafiltration volume or body weight in our study may due to the fact that other parameters that also influence CT are affected during the course of hemodialysis. The alterations in CT during hemodialysis cannot be explained only by the choroidal autoregulatory response to SBP. Choroidal regulation can be caused by a range of factors (Müller cells, vascular endothelial growth factor [VEGF], and other cytokines). Several studies have demonstrated that clearance or membrane adsorption of cytokines during hemodialysis can alter circulating cytokine levels(31,32). Further studies of this mechanism are needed.
There are several limitations to this study. Serum osmolarity and plasma total protein and albumin levels were not measured. Due to the small sample size, it is difficult to apply these results to all hemodialysis patients. On the other hand, these findings are quite consistent and repetitive, which suggests that they represent the effects of hemodialysis for most CRF patients. We did not control what the patients did during hemodialysis, such as watching television or reading. These factors might have affected the ocular surface changes.
In conclusion, CCT and IOP increased and SFCT decreased during the first half of the hemodialysis session. During the second half of the session, CCT and IOP showed a trend towards reduction, whereas SFCT had a relatively steady course. Measurements of the iridocorneal angle revealed no statistically significant changes during and after hemodialysis sessions. When analyzing the ocular effects of dialysis, it would be reasonable to evaluate the changes not only from before to after hemodialysis but also during hemodialysis.
Further large-scale randomized studies are needed to fully evaluate the effect of hemodialysis on ocular structures and the relationships among ophthalmologic changes and systemic hemodynamic alterations induced by hemodialysis in patients with CRF.
 English PDF
 Print
Print
 Send this article by email
 How to cite this article
 Submit a comment
 Mendeley
 Scielo
 Pocket
